SlideShare une entreprise Scribd logo
1  sur  35
McKinsey & Company 1
Six emerging consumer themes in March 2022
1
Slow return to
normalcy
Only 6% of
consumers in Japan
expect a rebound
within two to three
months
Splurging intent has
decreased since
October 2021; travel
is the biggest
spending category
2
Digital is
ascendant
Social-media influence
is rising, especially
among Gen Z and
millennials; around
72% of consumers
engage with a social-
media platform
Intention to use digital
services post-COVID-
19 remains high
5
Divided loyalty
Over half (58%) of
consumers facing a
stockout either did
not purchase or
waited for the
retailer to restock
12% say they tried a
new retailer and
11% tried a new
brand in the past
three months
4
Modified return
to out-of-home
Work, shopping, and
personal-care
services rebounded
with modified
behavior
Travel, entertain-
ment, and social
activities have yet to
rebound; no behavior
change is expected
3
Low spending
intent
Net intent1 of spending
for all categories other
than tourism is negative
Decrease in income is
the primary reason for
decrease in spend for
most categories
6
Subdued
holiday outlook
Consumers expect
to spend less than
last year in all
categories during
this year’s Golden
Week
Responses
suggest that travel
is the most popular
spending category
1. Net intent is calculated by subtracting the % of respondents stating they expect to decrease spending from the % of respondents stating they expect to increase spending.
McKinsey & Company 2
Confidence in own country’s economic recovery after COVID-19,1 % of respondents
11 15 15
21
14
29 32
20 29
34
46
56
51 63
48 47
75
68
55
38
28 27
23 23 21
5 3
29
59
12
Mixed: The economy will be
impacted for 6–12 months or
longer and will stagnate or show
slow growth thereafter
Pessimistic: COVID-19 will
have lasting impact on the
economy and show regression
or fall into lengthy recession
Optimistic: The economy will
rebound within 2–3 months and
grow just as strong as or
stronger than before COVID-19
1. Q: What is your overall confidence level surrounding economic conditions after the coronavirus (COVID-19) crisis subsides (ie, once there is herd immunity)? Rated from 1 “very optimistic” to 6 “very pessimistic.” Bars may not sum to
100% due to rounding.
Change in Optimistic vs.
last wave survey, percentage points
Source: McKinsey & Company COVID-19 Consumer Pulse Survey
India
3/11–24
+1
Oct 2021
China
3/11–20
-12
Oct 2021
US
3/1–25
-6
Oct 2021
Japan
3/16–26
-2
Oct 2021
Indonesia
3/16–26
+15
Sept 2020
Australia
3/16–25
-10
Nov 2020
Korea
3/19–26
+15
June 2020
Germany
3/22–28
-10
Oct 2021
France
3/23–28
-9
Oct 2021
UK
3/22–29
-12
Oct 2021
Japanese consumers are the least optimistic geographic segment
Slow return to normalcy | Current as of March 2022
McKinsey & Company 3
Slow return to normalcy | Current as of March 2022
1. Q: What is your overall confidence level surrounding economic conditions after the coronavirus (COVID-19) crisis subsides (ie, once there is herd immunity)? Rated from 1 “very optimistic” to 6 “very pessimistic.” Figures may not sum to
100% because of rounding.
2. Average of weekly pulse surveys shown for March and April 2020.
Optimistic: The
economy will rebound
within 2–3 months and
grow just as strong as or
stronger than before
COVID-19
Mixed: The economy will
be impacted for 6-12
months or longer and will
stagnate or show slow
growth thereafter
Pessimistic: COVID-19
will have lasting impact
on the economy and
show regression or fall
into lengthy recession
Source: McKinsey & Company COVID-19 Japan Consumer Pulse Survey, 3/16–3/26/2022, n = 1,018; 10/18–10/20/2021, n = 1,014; 2/24–2/27/2021, n = 1,014; 11/9–11/15/2020, n = 1,039; 9/22–9/28/2020, n = 1,034, sampled and weighted to
match Japan general population 18+ years
Pessimism has seen a marked increase, while optimism has
decreased slightly
Confidence in own country’s economic recovery after COVID-19,1 % of respondents
41 46 42
35 31 33
21 21
29
53
49 53
60
62 60
67 65
59
6 5 5 5 7 7 12 14 12
Nov 2020 Oct 2021
Feb 2021
Apr 20202
Mar 20202 May 2020 June 2020 Sept 2020 Mar 2022
McKinsey & Company 4
Lower-income consumers are more pessimistic than higher-income
groups
1. Q: What is your overall confidence level surrounding economic conditions after the coronavirus (COVID-19) crisis subsides (ie, once there is herd immunity)? Rated from 1 “very optimistic” to 6 “very pessimistic.”
Optimism by income Pessimism by income
Source: McKinsey & Company COVID-19 Japan Consumer Pulse Survey, 3/16–3/26/2022, n = 1,018; 10/18–10/20/2021, n = 1,014; 2/24–2/27/2021, n = 1,014;
11/9–11/15/2020, n = 1,039; 9/22–9/28/2020, n = 1,034, sampled and weighted to match Japan general population 18+ years
Confidence in own country’s economic recovery after
COVID-19 by income level,1 % of respondents
5
8
10
8
15
9 8
17 18
13
35
0
30
5
20
10
15
25
40
45
50
55
Oct 2021
7
Sept 2020
5
Nov 2020 Feb 2021
14
Mar 2022
9
16
Low (<4M yen) Medium (4M–8M yen) High (>8M yen)
35 36
24
26
34
28
23
27
31
16
18
26
0
30
15
10
55
5
20
25
35
40
45
50
31
Sept 2020
17
Nov 2020 Oct 2021
20
Feb 2021 Mar 2022
Slow return to normalcy | Current as of March 2022
McKinsey & Company 5
The older the generation is, the less pessimistic respondents are
about Japanese economic recovery
Slow return to normalcy | Current as of March 2022
Confidence in own country’s economic recovery after COVID-191
% of respondents
28
33
61 50
11 18
Unvaccinated
Vaccinated
1. Q: What is your overall confidence level surrounding economic conditions after the coronavirus (COVID-19) crisis subsides (ie, once there is herd immunity)? Rated from 1 “very optimistic” to 6 “very pessimistic.”
2. Baby boomers includes silent generation.
36 33 30
24
52 54 60
63
13 12 10 13
Gen Z Millennials Gen X Baby boomers2
Mixed
Optimistic Pessimistic
Source: McKinsey & Company COVID-19 Japan Consumer Pulse Survey, 3/16–3/26/2022, n = 1,018, sampled and weighted to match Japan general population 18+ years
By generation By vaccination status
McKinsey & Company 6
Slow return to normalcy | Current as of March 2022
23 25 29
19
2
2
2
77 73 69
79
Gen Z Millennials Gen X Baby boomers3
0
21
40
2
2
77
59
Vaccinated Unvaccinated
23
2
75
Overall
1. Q: When do you expect your routines will return to normal? Figures may not sum to 100% because of rounding.
2. Q: Which best describes your vaccination status?
3. Baby boomers includes silent generation.
Source: McKinsey & Company COVID-19 Japan Consumer Pulse Survey, 3/16–3/26/2022, n = 1,018, sampled and weighted to match Japan general population 18+ years
After June 2022
By June 2022
Not affected/already returned
By generation By vaccination status2
Expectations are
similar across the
generations,
although baby
boomers expect a
slower return to pre-
COVID-19 routine
~40% of
unvaccinated
consumers are
engaging in pre-
COVID-19 routines
Key findings
Overall, 75 percent of consumers expect pre-COVID-19 routines will
return after June 2022
Expectations on routines returning to pre-COVID-19,1 % of respondents
McKinsey & Company 7
Perceived impact of COVID-19 on consumers’ income, spending,
and savings has been limited and improved slightly in March 2022
Slow return to normalcy | Current as of March 2022
Source: McKinsey & Company COVID-19 Japan Consumer Pulse Survey, 3/16–3/26/2022, n = 1,018; 10/18–10/20/2021, n = 1,014; 2/24–2/27/2021, n = 1,014;
11/9–11/15/2020, n = 1,039, sampled and weighted to match Japan general population 18+ years
1. Q: How has the coronavirus (COVID-19) crisis affected the following over the past 1 month/2 weeks? Figures may not sum to 100% because of rounding.
COVID-19 impact on household finances,1 % of respondents
26 26 24 20
72 71 73 77
2 3 3 3
Past 2 weeks Past 2 weeks
27 24 23 23
65
65 68 71
8 11 9 5
Past 2 weeks Past 2 weeks Past 2 weeks Past 2 weeks
19 19 18
13
68
63
70
73
13
18
12 14
Past 2 weeks Past 2 weeks Past 2 weeks Past 2 weeks
Household income Household spending Household savings
Nov 2020 Feb 2021 Oct 2021
Reduce slightly/a lot Increase slightly/a lot
About the same
Mar 2022 Nov 2020 Feb 2021 Oct 2021 Mar 2022 Nov 2020 Feb 2021 Oct 2021 Mar 2022
McKinsey & Company 8
Almost two-thirds of Japanese consumers say their finances have
returned to ‘normal’ already
Slow return to normalcy | Current as of March 2022
61 65 63 64
7
32 32 35 34
Gen X
Gen Z Baby boomers3
Millennials
3
2 1
63
68
35
29
2
Vaccinated Unvaccinated
3
64
34
Overall
2
1. Q: When do you expect your personal/household finances will return to normal? Figures may not sum to 100% because of rounding.
2. Q: Which best describes your vaccination status?
3. Baby boomers includes silent generation.
Source: McKinsey & Company COVID-19 Japan Consumer Pulse Survey, 3/16–3/26/2022, n = 1,018, sampled and weighted to match Japan general population 18+ years
By generation By vaccination status2
Expectations are
similar across
generations
Unvaccinated
respondents are
more positive than
the vaccinated
about when their
finances will return
to ‘normal’
Expectations on personal/household finances
returning to ‘normal,’1 % of respondents
After June 2022 Not affected/already returned
By June 2022
McKinsey & Company 9
Slow return to normalcy | Current as of March 2022
Intent to ‘splurge’ is greatest among higher-income Gen Z
consumers; intent for middle-income Gen Z has risen 17 points
Source: McKinsey & Company COVID-19 Japan Consumer Pulse Survey, 3/16–3/26/2022, n = 1,018; 10/18–10/20/2021, n = 1,014, sampled and weighted to match Japan general population 18+ years
24
27
73
Do not plan
on splurging
Oct 2021
76
Plan on
splurging
Mar 2022
Millennials
Gen X
Baby boomers2
41%
−4
42%
17
Gen Z 55%
3
36%
−1
23%
−10
39%
7
15%
−1
23%
2
38%
10
20%
−8
17%
−6
19%
−2
Generation
Respondents who plan/do not plan to ‘splurge’
or ‘treat themselves’ in 20221
% of respondents
Low
(<$50K/year)
Middle
($50K–100K/year)
High
(>$100K/year)
>70%
<30% 50-70%
30-50% p.p. change from Oct 21
XX
Respondents who plan to splurge, by household income, %
1. Q: With regard to products and services you will spend money on, do you plan to splurge/treat yourself in 2022? For example, are there categories of products or services you have spent less on over the last year and a half which you feel
you will spend more on in the next 3 months?
2. Baby Boomers includes silent generation.
McKinsey & Company 10
Tourism is the biggest category driven by baby
boomers; younger generations want to splurge on
fashion, entertainment, and cosmetics
Slow return to normalcy | Current as of March 2022
Categories where consumers intend to treat themselves1
% of all respondents with intent to splurge
1. Q: You mentioned that you plan to splurge/treat yourself in next 3 months. Which categories do you intend to treat yourself to? Please select all that apply.
2. Baby boomers includes silent generation.
48
40
22
20
13
10
8
8
7
7
6
5
2
Electronics
Sports apparel and equipment
Items for your home
Travel, lodging, and vacation
Restaurants, dining out, bars
Apparel, shoes, accessories
Outdoor living
Out-of-home entertainment
Makeup and skin care products
Household essentials
Personal services
Fitness
Pets
Millennials Gen X
Gen Z
Baby
boomers2
43 46 32 62
43 39 40 40
31 30 17 15
25 22 19 18
24 14 15 7
7 12 11 9
12 13 10 3
10 8 6 8
7 12 6 5
Generational cut
8 11 7 2
5 14 4 2
5 9 5 3
0 5 2 1
Change from
Oct 2021,
percentage points
Source: McKinsey & Company COVID-19 Japan Consumer Pulse Survey, 3/16–3/26/2022, n = 1,018; 10/18–10/20/2021, n = 1,014, sampled and weighted to match Japan general population 18+ years
Between −3 and +3
< −3 > +3
5
8
−12
5
−9
−5
−3
−1
2
−3
−1
0
−2
Categories
Difference from all respondents,
percentage points
McKinsey & Company 11
Social media has the strongest influence on Gen Z and millennials
purchasing across all categories
Digital is ascendant | Current as of March 2022
1. Q: Think about the purchases you have made in the following categories over the past 3 months. Were you influenced toward a certain brand by a post on social media in the following categories?.
2. Baby boomers includes silent generation.
31
30
26
26
23
23
21
15
14
13
11
11
10
10
8
8
Vitamins, supplements, and over-the-counter medicine
Accessories
Apparel
Home decoration and furniture
Jewelry
Consumer electronics
Sports and outdoors equipment and supplies
Fitness and wellness services
Skin care and makeup
Groceries, food for home
Footwear
Kitchen and dining
Pet food and supplies
Personal-care products
Home improvement and garden supplies
Household supplies
Millennials Gen X
Gen Z
Baby
boomers2
44 28 0
39 44 11 33
37 36 18 19
52 30 21 8
59 32 24 7
35 41 26 15
58 33 13 10
54 23 12 6
47 22 9 5
Generational cut
26 21 11 9
30 18 7 8
23 22 8 6
36 15 6 5
Source: McKinsey & Company COVID-19 Japan Consumer Pulse Survey, 3/16–3/26/2022, n = 1,018, sampled and weighted to match Japan general population 18+ years
Between −3 and +3
< −3 > +3
Categories
Categories where respondents were influenced by social media1
% of all respondents
25
32
56
23
19
13
14
7
8
5
4
6
5
Difference from all respondents,
percentage points
McKinsey & Company 12
About 70 percent of consumers engage on a social-media platform
at least once a week
Frequency of engagement with social-media platforms1
% of all respondents whose purchases were influenced in last 6 months (across any product category)
1. Q: What social media platforms do you engage with, and if so, how frequently?
Source: McKinsey & Company COVID-19 Japan Consumer Pulse Survey, 3/16–3/26/2022, n = 1,018, sampled and weighted to match Japan general population 18+ years
72
61
37 35
24
10 4 3 3 2
28
39
63 65
76
90
96 97 97 98
YouTube
Overall Pinterest
Twitter Instagram Facebook TikTok Reddit LinkedIn Snapchat
Never/less than weekly
Weekly or more
Digital is ascendant | Current as of March 2022
McKinsey & Company 13
Source: McKinsey & Company COVID-19 Japan Consumer Pulse Survey, 3/16–3/26/2022, n = 1,018, sampled and weighted to match Japan general population 18+ years
Intent to use when the COVID-19 crisis subsides2
% of new or increased users who intend to keep doing activity
User
growth
since
COVID-19
1
1. User growth is calculated as % of respondents who replied that they are new users over % of respondents who replied that they were using the product/service pre-COVID-19 (using more, using the same, or using less) on Q: Which best
describes when you have done or used each of these items?
2. Q: Compared to now, will you do or use the following more, less, or not at all, once the coronavirus (COVID-19) crisis subsides (ie, once there is herd immunity)? Possible answers: “will stop this”; ”will reduce this”; “will keep doing what I am
doing now”; “will increase this.” Number indicates percent who chose “will keep doing what I am doing now” and “will increase this” among new or increased users.
Consumers have made shifts in loyalty and shopping behavior
and intend to maintain changes in the next phase of COVID-19
76
10
52 92
86
54
18
94
68 70 88
72 74
22
8
12
60
14
78
16
90
80
0
84
56
20
58 82
2
4
6 Personal care/grooming at home
New store/restaurant app
Purchased
pre-owned product
Drive-thru lane
Buy online, pick up in store
Downloaded/used
deal-finding plug-ins
Paid more for same-day delivery
Grocery delivery
Meal kit delivery
Purchased directly from social media
Restaurant food delivery
Shopped at a new store
Changed my primary store
Paid more for 2-hour
or 1-hour delivery
Digital is ascendant | Current as of March 2022
McKinsey & Company 14
Digital is ascendant | Current as of March 2022
Source: McKinsey & Company COVID-19 Japan Consumer Pulse Survey, 3/16–3/26/2022, n = 1,018, sampled and weighted to match Japan general population 18+ years
Intent to use when the COVID-19 crisis subsides2
% of new or increased users who intend to keep doing activity
User
growth
since
COVID-19
1
1. User growth is calculated as % of respondents who replied that they are new users over % of respondents who replied that they were using the product/service pre-COVID-19 (using more, using the same or using less) on Q: Which best
describes when you have done or used each of these items?
2. Q: Compared to now, will you do or use the following more, less, or not at all, once the coronavirus (COVID-19) crisis subsides (ie, once there is herd immunity)? Possible answers: “will stop this”; ”will reduce this”; “will keep doing what I am
doing now”; “will increase this.” Number indicates respondents who chose “will keep doing what I am doing now” and “will increase this” among new or increased users.
Intent to use digital services after the next phase of COVID-19
remains high for all service categories
81 96
51 62 92 93 95
50 64
52 97 99
98
61 85
63 100
65
3
70 74
0
67
66 77 79
68
6
69 84
71 72 73 75 82
76 78 80 83
9
86 94
87 88 89 90 91
Remote learning: myself
Watching e-sports
Social player/video app
Playing online games
Online fitness
Wellness app
Online streaming
Videoconferencing: professional
Remote learning: my children
Social media
Video chat: personal
McKinsey & Company 15
5
32
6
56
3
26
4
60
29
2
3
12
11
0
9
43
4
12
2
36
46
24
45
69
3
27
13
13
3
78
42
50
2
39
17
6
5
40
58
8
30
15
4
55
44
46
5
29
50
40
0
20
21
76
3
0
8 14 64 14
6 6 46 42
10 15 35
4 12
2
54
70
55
15
22
A drive-thru line for a fast-food restaurant
Curbside pickup from a restaurant
Curbside delivery at a store
Buy online, pick up in store
Self-checkout or scan-and-go at a physical store
Downloaded/used deal-finding plug-ins
Downloaded/used a new store/restaurant app
21
Purchased secondhand products online
Used an app/website for delivery within 2 hours
Used an app/website for same-day delivery
Bought or sold a cryptocurrency
Bought or sold an NFT
Used an augmented-reality/virtual-reality headset
Changed my primary grocery store
Shopped at a store I had not shopped at before for groceries
Cooked regularly for myself/my family
Personal care/grooming at home
Tried making something myself/DIY project
Purchased directly from social media
Source: McKinsey & Company COVID-19 Japan Consumer Pulse Survey, 3/16–3/26/2022, n = 1,018, sampled and weighted to match Japan general population 18+ years
Intent to
continue2
Consumers who use alternatives to in-store shopping report using
them as often or more frequently in the last three months
Digital is ascendant | Current as of March 2022
88
78
81
79
74
68
93
53
83
90
50
70
95
92
97
88
88
Which best describes when you have done or used each of these items?1
% of respondents who have used in the last 3 months
Just started using Using less Using more
Using same
96
89
1. Q: And have you used or done any of the following in the last 3 months? If yes, Q: Which best describes when you have done or used each of these items? Possible answers: “just started using since COVID-19 started”; “I have not used in
the last 3 months”; “I have used in the last 3 months at the same rate as before”; “I have used this more in the past 3 month than before”; “I have used this less in the past 3 months than before.”
2. Q: Compared to now, will you do or use the following more, less, or not at all, once the coronavirus (COVID-19) ) crisis subsides (ie, once there is herd immunity)? Possible answers: “will stop this”; ”will reduce this”; “will keep doing what I
am doing now”; “will increase this.” Number indicates % of respondents who chose “will keep doing what I am doing now” and “will increase this” among new or increased users.
McKinsey & Company 16
Digital services are being used more frequently, and there is strong
intent to continue this behavior
1. Q: Have you used or done any of the following since the coronavirus (COVID-19) crisis started? If yes, Q: Which best describes when you have done or used each of these items? Possible answers: “just started using since COVID-19
started”; “using more since COVID-19 started”; “using about the same since COVID-19 started”; “using less since COVID-19 started.”
2. Q: Compared to now, will you do or use the following more, less, or not at all, once the coronavirus (COVID-19) crisis subsides (ie, once there is herd immunity)? Possible answers: “will stop this”; ”will reduce this”; “will keep doing what I am
doing now”; “will increase this.” Number indicates % of respondents who chose “will keep doing what I am doing now” and “will increase this” among new or increased users.
Source: McKinsey & Company COVID-19 Japan Consumer Pulse Survey, 3/16–3/26/2022, n = 1,018, sampled and weighted to match Japan general population 18+ years
Digital is ascendant | Current as of March 2022
2
59
61
14
42
5
6
7
0 35
5
60
36
0
40
50
0
0
2
10
20
39
1
75
1
0
Online streaming
4
1
4
45
0
55
2 41
75
45
5
21
0
0
55
0
64
36
0
54
39
57
1
48
7
69
31
0
0
47
50
0
73
34
63
3
0
Online fitness
Wellness app
Meal-kit delivery
Restaurant delivery
Grocery delivery
3
Video chat: personal
Telemedicine: physical
Telemedicine: mental
Watching e-sports
Playing online games
Remote learning: myself
Remote learning: my children
Social player/video app
Social media
Videoconferencing: professional
67
100
61
78
81
88
76
62
89
96
51
81
100
90
80
97
Intent to
continue2
Which best describes when you have done or used each of these items?1
% of respondents who have used in the last three months
Just started using Using less Using same Using more
McKinsey & Company 17
With increasing out-of-home activities, the in-store channel is
seeing a rise, followed closely by omnichannel
Digital is ascendant | Current as of March 2022
1. Q: Which best describes how you have researched the following categories over the last 3 months?
2. Q: Which best describes how you have purchased the following categories over the last 3 months?
85
80
77
77
72
72
68
63
60
54
53
53
52
48
47
47
46
42
40
32
14
18
18
18
22
20
27
27
33
30
36
29
28
34
34
30
28
28
35
45
1
2
5
5
6
8
5
10
7
16
11
18
20
18
19
23
26
30
25
23
Tobacco products and smoking supplies
Books, magazines, newspapers
Food takeout/delivery
Home improvement and gardening supplies
Groceries/food for home
Household supplies
Alcoholic beverages
Pet care services (eg, walkers, grooming)
Personal-care products
Kitchen and dining
Fitness and wellness services
Skin care and makeup
Home decoration and furniture
Apparel
Accessories (eg, handbags, sunglasses)
Pet food and supplies
Consumer electronics
Vitamins, supplements, and over-the-counter medicine
Sports and outdoors equipment and supplies
Toys and baby supplies
Research and purchase only in stores Omnichannel Research and purchase only online
Product searches1 and purchases2 by channel
% of respondents who purchased and searched in these categories in the last 3 months
Source: McKinsey & Company COVID-19 Japan Consumer Pulse Survey, 3/16–3/26/2022, n = 1,018, sampled and weighted to match Japan general population 18+ years
McKinsey & Company 18
Expected spending per category over the next 2–3 months vs usual1
Net intent2
Source: McKinsey & Company COVID-19 Japan Consumer Pulse Survey, 3/16–3/26/2022, n = 1,018; 10/18–10/20/2021, n = 1,014; 2/24–2/27/2021, n = 1,014; 11/9–11/15/2020, n = 1,039; 9/22–9/28/2020, n = 1,034; 6/19–6/22/2020,
n = 664, sampled and weighted to match Japan general population 18+ years
Spending intent is gradually recovering but expected to be lower
than usual across most categories over next several months
1. Q: Over the next 2–3 months, do you expect that you will spend more, about the same, or less money on these categories than usual? Figures may not sum to 100% because of rounding.
2. Net intent is calculated by subtracting the % of respondents stating they expect to decrease spending from the % of respondents stating they expect to increase spending.
Low spending intent | Current as of March 2022
0
−40
−50
20
−30
−20
−10
10
May
2020
Feb
2021
Mar
2020
Apr
2020
June
2020
Sept
2020
Nov
2020
Oct
2021
Mar
2022
Household supplies
Groceries
Consumer electronics
Skin care and makeup
Fitness and wellness
​Personal-care products
Apparel
McKinsey & Company 19
Consumers report negative net intent to spend for all categories
except tourism, which saw an increase since October 2021
Net intent >1
Net intent −15 to 0
Net intent: < −15
Source: McKinsey & Company COVID-19 Japan Consumer Pulse Survey, 3/16–3/26/2022, n = 1,018; 10/18–10/20/2021, n = 1,014, sampled and weighted to
match Japan general population 18+ years
7
8
18
13
15
21
27
19
33
31
14
6
13
26
19
10
10
8
2
8
6
6
7
13
4
14
16
11
2
Alcohol
Quick-service restaurant
Footwear
Restaurant
Jewelry
Accessories
Toys and baby
Household supplies
Skin care and makeup
Home and furniture
Sports and outdoors
Kitchen and dining
Home improvement, garden
5
3
Apparel
Groceries
12
11
5
Personal-care products
Tobacco products
6
Food takeout and delivery
6
Increase
Decrease Stay the same
10
12
10
25
18
12
10
12
14
16
15
17
21
19
21
15
5
11
15
20
23
28
100
21
21
25
16
Fitness and wellness
Consumer electronics
5
Vehicles
Pet food and supplies
Out-of-home entertainment
Vitamins and OTC medicine
Entertainment at home
Books/magazines/newspapers
Pet care services
3
Personal-care services
Gasoline
Hotel/resort stays
Short-term home rentals
13
5
3
Cruises 0
4
4
Adventures and tours
International flights
12
Domestic flights
Travel by car
Net
intent2
−1
−6
−20
−2
−8
3
−10
5
8
11
100
1
2
4
−4
−4
1. Q: Over the next 2–3 months, do you expect that you will spend more, about the same, or less money on these categories than usual? Figures may not sum to 100% because of rounding.
2. Net intent is calculated by subtracting the % of respondents stating they expect to decrease spending from the % of respondents stating they expect to increase spending.
3. Sample size < 30.
Expected spending per category over the next 2 weeks vs usual1
% of respondents
−5
−2
−14
−6
2
6
−10
−1
N/A3
−5
−2
−8
−3
−8
−6
1
2
−8
Change since
Oct 2021
Change since
Oct 2021
−2 −1
−5
−23
−3
−16
7
−8
7
−2
5
−2
N/A3
10
N/A3
13
N/A3
21
1 24
Net
intent2
−22
1
−1
−3
−12
−6
−10
−8
−9
−10
−22
−13
−24
−3
−8
−3
1
−8
Low spending intent | Current as of March 2022
McKinsey & Company 20
Net intent to spend is expected to decrease across most categories,
but vaccinated respondents are more likely than others to spend
Low spending intent | Current as of March 2022
Source: McKinsey & Company COVID-19 Japan Consumer Pulse Survey, 3/16–3/26/2022, n = 1,018, sampled and weighted to match Japan general population 18+ years
1. Net intent is calculated by subtracting the % of respondents stating they expect to decrease spending from the % of respondents stating they expect to increase spending.
2. Q: Over the next 2–3 months, do you expect that you will spend more, about the same, or less money on these categories than usual?
+4
percentage points
Likelihood of
vaccinated vs
unvaccinated people
to spend
For selected categories
Net intent1 for expected spending per category over the next 2–3 months vs usual2
Unlikely Cautious Interested Vaccinated
Groceries
Food takeout and delivery
Restaurant
Quick-service restaurant
Home decor
Home and garden
Personal-care items
Fitness and wellness
Out-of-home entertainment
International flights
4
−7
−12
−4
14
−20
−6
−31
−6
0
−3
−1
−12
−18
0
0
−11
0
21
0
−16
−22
−49
−13
−49
−14
−13
−17
19
0
1
−11
−9
−9
−14
3
−2
5
−3
2
Between −3 and +3
< −3 > +3
McKinsey & Company 21
Increase in price and shift to premiumization are the major factors
across categories where spend has increased
4
6
5
4
16
7
11
35
8
3
9
12
15
22
20
16
5
15
10
33
25
33
37
18
19
20
40
18
25
27
16
33
14
7
13
37
16
15
19
30
32
32
31
62
36
43
46
46
35
33
57
79
48
33
47
32
56
40
33
40
26
11
27
15
32
18
49
29
14
Footwear
Pet care services
Groceries
Food takeout/delivery
Meal at restaurant
Meal at quick-serve rest
Pet food and supplies
Personal-care products
Household supplies
Vitamins & supplements
Vehicles
Apparel
Accessories
Consumer electronics
Home and decoration
0
Kitchen and dining
Skin care and makeup
Personal-care services
Increase in income
Larger quantity Increase in price
Premium brands/products
1. Q: Please indicate the main reason for planning to spend more on the following categories.
Reasons for increase in spend1
% of respondents who increased spend
Low spending intent | Current as of March 2022
Source: McKinsey & Company COVID-19 Japan Consumer Pulse Survey, 3/16–3/26/2022, n = 1,018, sampled and weighted to match Japan general population 18+ years
McKinsey & Company 22
Decrease in income and quantity are the major reasons across
categories where spend has decreased
43
21
27
28
32
40
40
40
39
34
26
42
26
41
30
62
38
49
31
33
26
26
12
27
26
24
28
26
45
23
34
9
25
20
27
28
11
18
18
15
19
20
14
12
11
16
7
8
7
24
10
8
12
9
14
28
29
30
18
13
18
12
19
24
19
24
30
25
30
10
23
14
1
19
2
11
3
1
4
3
3
5
Meal at quick-serve rest
Kitchen and dining
Pet food and supplies
Groceries
Food takeout/delivery
1
0
Skin care and makeup
Meal at restaurant
Household supplies
Personal-care products
Pet care services
Vitamins & supplements
Apparel
Footwear
0
Accessories
Consumer electronics
0
Vehicles
Home and decoration
Personal-care services
Switch to less expensive
Decrease in income
Spend more on other categories
Smaller quantity
Reduced price
1. Q: Please indicate the main reason for planning to spend less on the following categories.
Reasons for decrease in spend1
% of respondents who decreased spend
Low spending intent | Current as of March 2022
Source: McKinsey & Company COVID-19 Japan Consumer Pulse Survey, 3/16–3/26/2022, n = 1,018, sampled and weighted to match Japan general population 18+ years
McKinsey & Company 23
Modified return to out-of-home | Current as of March 2022
Overall
14
25
Vaccinated Unvaccinated
18
Millennials
Gen Z
20
18
Gen X Baby boomers3
12
Low
(<4M yen)
High
(>8M yen)
Medium
(4M–8M yen)
16
16 16
1. Q: Which best describes when you will regularly return to stores, restaurants, and other out-of-home activities? Chart shows those already participating in these activities
2. Gen Z are people under 26 years old, millennials are 26–41 years old, Gen X are people 42–57 years old, baby boomers are 58 years old and above.
3. Baby boomers includes silent generation.
Source: McKinsey & Company COVID-19 Japan Consumer Pulse Survey, 3/16–3/26/2022, n = 1,018; 10/18–10/20/2021, n = 1,014; 2/24–2/27/2021, n = 1,014;
11/9–11/15/2020, n = 1,039; 9/22–9/28/2020, n = 1,034; 6/19–6/22/2020, n = 664, sampled and weighted to match Japan general population 18+ years
By
generation2
By
vaccination
adoption
By income
~20%
of Gen X are doing out-
of-home activities
~16%
of households across
income levels are doing
out-of-home activities
~25%
of people who are
unvaccinated are doing
out-of-home activities
Consumers engaging in out-of-home activities,1 % of respondents
About one-sixth of consumers say they have returned to out-of-
home activities
16
24
15
29
27
19
Nov 2020
Mar 2022
Sep 2020
Oct 2021
Feb 2021
Jun 2020
McKinsey & Company 24
Modified return to out-of-home | Current as of March 2022
Source: McKinsey & Company COVID-19 Japan Consumer Pulse Survey, 3/16–3/26/2022, n = 1,018, sampled and weighted to match Japan general population 18+ years
Social
Personal
care
Entertain-
ment 80
57
59
51
60
93
62
78
55
Get together with family
Attend an outdoor event
Dine indoors at a restaurant or bar
Go out for family entertainment
Attend an indoor cultural event
Go to the gym or fitness studio
Visit a crowded outdoor public place
Go to a hair or nail salon
Get together with friends
82
99
97
84
71
53
89
36
51
58
57
Use public transportation
Shop for non-necessities
Work outside my home
Use a ride-sharing service
Shop for groceries/necessities
Rent a short-term home
Go to a shopping mall
Travel more than 2 hours by car
Travel by airplane
Travel by train
Stay in a hotel
Work
Shopping
Transport/
travel
−4
26
6
38
−3
61
26
2
45
43
13
42
49
40
27
42
58
14
58
34
50% and above
Less than 50%
Change >10 pp
Change from
Oct 2021,
percentage points
Change from
Oct 2021,
percentage points
Consumers have increased most of their out-of-home activities
since last year
Out-of-home activities currently engaging1
% of respondents who reported doing this in the same or a modified way
1. Q: Which best describes how you are engaging in each of these activities? Possible answers: “Not doing this all”; “Doing this in the same way as pre-COVID-19 but less often”; “Doing this in a modified way vs pre-COVID-19”; “Doing this just
as much and in the same way as I did pre-COVID-19”
McKinsey & Company 25
1. Q: With the rise of the omicron variant of COVID-19, how, if at all, has your out-of-home behavior changed?
Source: McKinsey & Company COVID-19 Japan Consumer Pulse Survey, 3/16–3/26/2022, n = 1,018, sampled and weighted to match Japan general population 18+ years
20
16 14
27
30 28
51 52 54
Low
(<4M yen)
1
Medium
(4M–8M yen)
High
(>8M yen)
2 4
Modified return to out-of-home | Current as of March 2022
8
16
30
28
27
55
36
1
Vaccinated Unvaccinated
18
28
52
Engage less
Overall
Engage with
adjusted behavior
Engage more
Engage same as
before omicron
2
By income By vaccination status
Lower-income
consumers are the
likeliest income group
to indicate they
engage the same as
or more than before
omicron
A third of
unvaccinated
consumers have not
reduced or changed
their out-of-home
behavior, despite
omicron variant
Key findings
Adjustments to out-of-home behavior due to prevalence of omicron variant,1 % of respondents
About half of consumers reduced engagement in out-of-home
activities due to the omicron variant; 28 percent engage differently
McKinsey & Company 26
Modified return to out-of-home | Current as of March 2022
Source: McKinsey & Company COVID-19 Japan Consumer Pulse Survey, 3/16–3/26/2022, n = 1,018, sampled and weighted to match Japan general population 18+ years
1. Q: Which best describes how you are engaging in each of these activities? Possible answers: “Not doing this at all”; “Doing this in the same way as pre-COVID-19 but less often”; “Doing this in a modified way vs pre-COVID-19”;
“Doing this just as much and in the same way as I did pre-COVID-19.”
Work
Shopping
Transport/
travel
Social
Personal
care
Entertain-
ment
89
Visit a crowded outdoor public place
11
9
15
Dine indoors at a restaurant or bar
91
10
85
15
Go out for family entertainment
85
Attend an indoor cultural event
10
90
Attend an outdoor event
Go to the gym or fitness studio 53
90
84
48
52
16
Go to a hair or nail salon
47
Get together with family
Get together with friends
48
Work outside my home
52
84
45 55
Shop for groceries/necessities
Shop for non-necessities
82
21
79
Go to a shopping mall
20
80
0
58
18
42
82
Use public transportation
23
77
Use a ride-sharing service
19
81
Travel by airplane
18
Travel by train
16
Stay in a hotel
100
Rent a short-term home
Travel more than 2 hours by car
Doing less, doing in a modified way
Doing as much as and in the same way as pre-COVID-19
Out-of-home activities engagement1
% of respondents having engaged in activity pre-COVID-19
Japanese consumers modified their out-of-home behavior for all
categories except working and grocery and non-essential shopping
McKinsey & Company 27
Main life events done in the last 12 months as a result of COVID,1 % of respondents
Modified return to out-of-home | Current as of March 2022
Source: McKinsey & Company COVID-19 Japan Consumer Pulse Survey, 3/16–3/26/2022, n = 1,018; 10/18–10/20/2021, n = 1,014, sampled and weighted to match Japan general population 18+ years
Change >3 pp
6
4
1
3
1
1
2
1
1
1
1
Worked more from home
Renovated/remodeled my home
Got a new pet at home (eg, dog, cat)
Set up a specific work-from-home space
Decided to change jobs
Started homeschooling children
Set up a gym at home
Moved into a bigger home
Moved into a smaller home
Bought a property
Sold a property
Work/study
change
Mar 2022
Pet adoption
House move
Home
renovation
Investments/
divestments
Total,2
%
Change from
Oct 2021,
percentage points
-1
-1
0
0
0
-1
0
-1
-4
-3
2
2
10
2
4
2
1. Q: Which of the following have you done in the last 12 months as a result of the COVID-19 crisis?
2. Total percentage of people who choose option(s) in the category.
Fewer Japanese consumers are investing in their home
environment due to COVID-19 than in October 2021
McKinsey & Company 28
Milestones for the Japan population not yet engaging with out-of-home activities1
% of respondents awaiting each milestone before engaging
10
33
15
42
Government
lifts restrictions
COVID-19 no
longer spreading
Vaccination
coverage
Government lifts
restrictions and
other requirements
84%
of people are not
currently engaging
in ‘normal’ out-of-
home activities
Vaccination coverage
Government lifts restrictions and…
1. Q: Which best describes when you will regularly return to stores, restaurants, and other out-of-home activities? Chart rebased to exclude those already
participating in these activities and those who do not deem any of these items important. Figures may not sum to 100% because of rounding.
13%
Medical authorities deem safe
9%
Stores, restaurants, and other
indoor places start taking safety
measures
12%
I see other people returning
11%
Vaccine is widely distributed
3%
I have been vaccinated
1%
Family member(s) vaccinated
Cautious consumers cite spread of COVID-19 and
government restrictions as primary reasons for
not yet engaging in out-of-home activities
Source: McKinsey & Company COVID-19 Japan Consumer Pulse Survey, 3/16–3/26/2022, n = 1,018, sampled and weighted to match Japan general population 18+ years
Modified return to out-of-home | Current as of March 2022
McKinsey & Company 29
26
12
11
10
7
5
New digital shopping method
Different retailer/store/website
Any new shopping behavior
Different brand
Private label/store brand
New shopping method3
Divided loyalty | Current as of March 2022
Source: McKinsey & Company COVID-19 Japan Consumer Pulse Survey, 3/16–3/26/2022, n = 1,018; 10/18–10/20/2021, n = 1,014, sampled and weighted to
match Japan general population 18+ years
83 −9
96 13
90 2
84 −6
High
(>8M yen/year)
Gen Z Millennials
33
35 37
16
88 −2 11 16
17
17 16
10
8 17
12
15 11
8
7 12
Income cut
Generational cut
All consumers
% of
respondents
Change from Oct
2021, percentage
points
Intent to continue behavior2
Between −3 and +3
< −3 > +3
1. Q: Over the past 3 months, which of the following have you done? 74% replied “None of these.”
2. Q: Which best describes whether or not you plan to continue with these shopping changes? Possible answers: “will go back to what I did before 3 months ago”; ”will keep doing both this and what I did before 3 months ago”; ”will keep doing
this and NOT go back to what I did before 3 months ago.” Intent to continue includes respondents who selected “will keep doing both this and what I did before 3 months ago” and “will keep doing this and NOT go back to what I did before 3
months ago.”
3. “New shopping method” includes curbside pickup and delivery apps.
Behaviors since COVID-19 started1
% of respondents
Changes in consumer behavior have been more extensive among
younger and higher-income consumers
Difference from all respondents,
percentage points
McKinsey & Company 30
Consumers facing a stockout of a planned purchase are most likely
to not buy anything, followed by buying at different retailer
Divided loyalty | Current as of March 2022
1. Q: Over the last 3 months, have you wanted to buy something and not been able to purchase it because it was out of stock or otherwise not available?
2. Q: The most recent time this happened (when you wanted to buy something and it was not available), what did you do?
Source: McKinsey & Company COVID-19 Japan Consumer Pulse Survey, 3/16–3/26/2022, n = 1,018, sampled and weighted to match Japan general population 18+ years
76
24
Could not purchase
at least 1 item
Able to purchase
all items
Mar 2022
Respondents who planned to purchase
something but could not, due to unavailability1
% of respondents
24
9
10
14
44
Bought the product
at different retailer
Bought a different product
at the same retailer
Bought a different brand or similar
product at a different retailer
Waited until product was available
at the same retailer
Did not buy anything
All consumers who could not make a planned
purchase2
% of respondents
McKinsey & Company 31
Reason for trying a new brand since COVID-19 began1
% of respondents selecting reason in top 3
Divided loyalty | Current as of March 2022
1. Q: You mentioned you tried a new/different brand than what you normally buy. What were the main reasons that drove this decision? Select up to 3 relevant reasons. “Brand” includes different brand, new
private label/store brand. Overarching reason based on % of individual respondents responding to at least 1 reason in the group.
2. Baby boomers includes silent generation.
Source: McKinsey & Company COVID-19 Japan Consumer Pulse Survey, 3/16–3/26/2022, n = 1,018, sampled and weighted to match Japan general population 18+ years
Supporting local businesses
Better value
Is available where I’m shopping (ie, in-store or online)
Larger package sizes
Products are in stock
Better prices, promotions
21
More sustainable, better for the environment
Better shipping, delivery cost
Shares my values
6
The company treats its employees well
3
Cleaner, safer
37
4
2
5
3
3
3
7
19
Using recyclable packing materials
Wanted to try a new brand I found
Better quality
Is natural/organic 5
19
Wanted to try a type of product I’ve never tried before 25
26
7
Wanted to treat myself
Wanted variety/a change from my normal routine 9
Novelty
Personal choice
Purpose-driven
Quality/organic
Convenience
Health/hygiene
Availability 7
Value 56
14
23
42
19
3
17
Baby
boomers2
Gen Z/
millennials Gen x
20 21
25
36 26
57
6 4
9
4 2
6
23 33
20
26 24
22
15 33
3
5 4
6
24 15
15
6 8
9
13 6
6
1 4
0
6 2
0
6 0
0
1 11
3
6 2
0
8 4
10
All consumers
Between −3 and +3
< −3 > +3
Value was a primary reason for brand switch; novelty came next for
older consumers, and convenience for younger consumers
x Net % of respondents per category
Difference from all respondents,
percentage points
5 2
0
McKinsey & Company 32
Out of non-daily-life categories, travel seems to be the most popular
spending category for the new season
Subdued holiday outlook | Current as of March 2022
1. Q: For the new season starting this spring, do you plan to spend money this year on each of the following items?
5
20
31
24
67
51
12
30
83
50
44
46
20
29
61
43
12
30
25
30
14
21
27
27
Gifts for others
Clothes
House-moving
Furniture and home appliances
Daily necessities
Travel
Special dinners at restaurants
Luxury goods
Don’t know
Yes No
Spending for new season starting this spring1
% of respondents who plan to spend money on each of the following items
Source: McKinsey & Company COVID-19 Japan Consumer Pulse Survey, 3/16–3/26/2022, n = 1,018, sampled and weighted to match Japan general population 18+ years
McKinsey & Company 33
Across categories, Japanese are generally willing to spend less than
last year
Subdued holiday outlook | Current as of March 2022
74
36
39
35
10
14
48
32
2
8
8
10
5
9
9
7
3
10
10
12
7
13
10
8
18
43
35
39
77
61
32
50
2
2
8
5
1
3
2
2
1
1
2
1
1
House-moving
Luxury goods
Special dinner at restaurants
Furniture and home appliances
Travel
Daily necessities
Gifts for others
Clothes
Won’t spend any Will spend about the same amount
Will spend significantly less
Will spend less
Will spend more
Will spend significantly more
Change in spending for new season starting this spring1
% of respondents who plan to change spending vs 2021
Source: McKinsey & Company COVID-19 Japan Consumer Pulse Survey, 3/16–3/26/2022, n = 1,018, sampled and weighted to match Japan general population 18+ years
1. Q: If you compare the upcoming new season starting in this spring with the one last year, how much do you plan to change your spending level in the following categories for each of the items?
McKinsey & Company 34
Out of non-daily-life categories, travel and special dinners at
restaurants are the most popular spending categories
Subdued holiday outlook | Current as of March 2022
1. Q: We would like to ask you questions about your plans for Golden Week this year. Do you plan to spend money this year on each of the following items?
4
9
19
17
40
23
6
14
83
61
55
54
36
47
69
60
13
30
27
29
24
30
25
26
Special dinners at restaurants
Furniture and home appliances
Gifts for others
House-moving
Travel
Daily necessities
Clothes
Luxury goods
Yes No Don’t know
Plan to spend in Golden Week1
% of respondents who plan to spend during golden week
Source: McKinsey & Company COVID-19 Japan Consumer Pulse Survey, 3/16–3/26/2022, n = 1,018, sampled and weighted to match Japan general population 18+ years
McKinsey & Company 35
Japanese consumers are expected to spend less across all
categories during this year’s Golden Week, compared with last year
Subdued holiday outlook | Current as of March 2022
1. Q: If you compare the upcoming Golden Week this year with the one last year, how much do you plan to change your spending level in the following categories for each of the items?
77
55
52
45
26
36
59
51
60
2
5
5
7
6
6
5
5
5
3
6
6
7
5
8
6
6
4
17
32
30
36
62
48
28
36
26
1
1
5
4
1
2
2
2
3
1
1
1
1
1
1
2
Other special expenditure
Luxury goods
House-moving
Travel
Furniture and home appliances
Special dinners at restaurants
0
Daily necessities
Clothes
0
Gifts for others
Won’t spend any Will spend about the same amount
Will spend significantly less
Will spend less
Will spend more
Will spend significantly more
Plan to change spending from last year during Golden Week1
% of respondents who plan to change spending level
Source: McKinsey & Company COVID-19 Japan Consumer Pulse Survey, 3/16–3/26/2022, n = 1,018, sampled and weighted to match Japan general population 18+ years

Contenu connexe

Similaire à McKinsey Survey: Japanese consumer sentiment during the coronavirus crisis

Similaire à McKinsey Survey: Japanese consumer sentiment during the coronavirus crisis (20)

McKinsey Survey: Australian consumer sentiment during the coronavirus crisis
McKinsey Survey: Australian consumer sentiment during the coronavirus crisisMcKinsey Survey: Australian consumer sentiment during the coronavirus crisis
McKinsey Survey: Australian consumer sentiment during the coronavirus crisis
 
McKinsey Survey: Australian consumer sentiment during the coronavirus crisis
McKinsey Survey: Australian consumer sentiment during the coronavirus crisisMcKinsey Survey: Australian consumer sentiment during the coronavirus crisis
McKinsey Survey: Australian consumer sentiment during the coronavirus crisis
 
McKinsey Survey: Italian consumer sentiment during the coronavirus crisis
McKinsey Survey: Italian consumer sentiment during the coronavirus crisisMcKinsey Survey: Italian consumer sentiment during the coronavirus crisis
McKinsey Survey: Italian consumer sentiment during the coronavirus crisis
 
McKinsey Survey: Italian consumer sentiment during the coronavirus crisis
McKinsey Survey: Italian consumer sentiment during the coronavirus crisisMcKinsey Survey: Italian consumer sentiment during the coronavirus crisis
McKinsey Survey: Italian consumer sentiment during the coronavirus crisis
 
McKinsey Survey: Indian consumer sentiment during the coronavirus crisis
McKinsey Survey: Indian consumer sentiment during the coronavirus crisisMcKinsey Survey: Indian consumer sentiment during the coronavirus crisis
McKinsey Survey: Indian consumer sentiment during the coronavirus crisis
 
McKinsey Survey: Indian consumer sentiment during the coronavirus crisis
McKinsey Survey: Indian consumer sentiment during the coronavirus crisisMcKinsey Survey: Indian consumer sentiment during the coronavirus crisis
McKinsey Survey: Indian consumer sentiment during the coronavirus crisis
 
McKinsey Survey: Indian consumer sentiment during the coronavirus crisis
McKinsey Survey: Indian consumer sentiment during the coronavirus crisisMcKinsey Survey: Indian consumer sentiment during the coronavirus crisis
McKinsey Survey: Indian consumer sentiment during the coronavirus crisis
 
McKinsey Survey: Japanese consumer sentiment during the coronavirus crisis
McKinsey Survey: Japanese consumer sentiment during the coronavirus crisisMcKinsey Survey: Japanese consumer sentiment during the coronavirus crisis
McKinsey Survey: Japanese consumer sentiment during the coronavirus crisis
 
McKinsey Survey: Japanese consumer sentiment during the coronavirus crisis
McKinsey Survey: Japanese consumer sentiment during the coronavirus crisisMcKinsey Survey: Japanese consumer sentiment during the coronavirus crisis
McKinsey Survey: Japanese consumer sentiment during the coronavirus crisis
 
McKinsey Survey: Indian consumer sentiment during the coronavirus crisis
McKinsey Survey: Indian consumer sentiment during the coronavirus crisisMcKinsey Survey: Indian consumer sentiment during the coronavirus crisis
McKinsey Survey: Indian consumer sentiment during the coronavirus crisis
 
McKinsey Survey: Spanish consumer sentiment during the coronavirus crisis
McKinsey Survey: Spanish consumer sentiment during the coronavirus crisisMcKinsey Survey: Spanish consumer sentiment during the coronavirus crisis
McKinsey Survey: Spanish consumer sentiment during the coronavirus crisis
 
McKinsey Survey: Chinese consumer sentiment during the coronavirus crisis
McKinsey Survey: Chinese consumer sentiment during the coronavirus crisisMcKinsey Survey: Chinese consumer sentiment during the coronavirus crisis
McKinsey Survey: Chinese consumer sentiment during the coronavirus crisis
 
McKinsey Survey: German consumer sentiment during the coronavirus crisis
McKinsey Survey: German consumer sentiment during the coronavirus crisisMcKinsey Survey: German consumer sentiment during the coronavirus crisis
McKinsey Survey: German consumer sentiment during the coronavirus crisis
 
McKinsey Survey: US consumer sentiment during the coronavirus crisis
McKinsey Survey: US consumer sentiment during the coronavirus crisisMcKinsey Survey: US consumer sentiment during the coronavirus crisis
McKinsey Survey: US consumer sentiment during the coronavirus crisis
 
McKinsey Survey: German consumer sentiment during the coronavirus crisis
McKinsey Survey: German consumer sentiment during the coronavirus crisisMcKinsey Survey: German consumer sentiment during the coronavirus crisis
McKinsey Survey: German consumer sentiment during the coronavirus crisis
 
McKinsey Survey: French consumer sentiment during the coronavirus crisis
McKinsey Survey: French consumer sentiment during the coronavirus crisisMcKinsey Survey: French consumer sentiment during the coronavirus crisis
McKinsey Survey: French consumer sentiment during the coronavirus crisis
 
McKinsey Survey: US consumer sentiment during the coronavirus crisis
McKinsey Survey: US consumer sentiment during the coronavirus crisisMcKinsey Survey: US consumer sentiment during the coronavirus crisis
McKinsey Survey: US consumer sentiment during the coronavirus crisis
 
McKinsey Survey: US consumer sentiment during the coronavirus crisis
McKinsey Survey: US consumer sentiment during the coronavirus crisisMcKinsey Survey: US consumer sentiment during the coronavirus crisis
McKinsey Survey: US consumer sentiment during the coronavirus crisis
 
McKinsey Survey: French consumer sentiment during the coronavirus crisis
McKinsey Survey: French consumer sentiment during the coronavirus crisisMcKinsey Survey: French consumer sentiment during the coronavirus crisis
McKinsey Survey: French consumer sentiment during the coronavirus crisis
 
McKinsey Survey: European consumer sentiment during the coronavirus crisis
McKinsey Survey: European consumer sentiment during the coronavirus crisisMcKinsey Survey: European consumer sentiment during the coronavirus crisis
McKinsey Survey: European consumer sentiment during the coronavirus crisis
 

Plus de McKinsey on Marketing & Sales

Plus de McKinsey on Marketing & Sales (17)

McKinsey European consumer sentiment survey: How current events are shaping S...
McKinsey European consumer sentiment survey: How current events are shaping S...McKinsey European consumer sentiment survey: How current events are shaping S...
McKinsey European consumer sentiment survey: How current events are shaping S...
 
McKinsey European consumer sentiment survey: How current events are shaping U...
McKinsey European consumer sentiment survey: How current events are shaping U...McKinsey European consumer sentiment survey: How current events are shaping U...
McKinsey European consumer sentiment survey: How current events are shaping U...
 
McKinsey European consumer sentiment survey: How current events are shaping I...
McKinsey European consumer sentiment survey: How current events are shaping I...McKinsey European consumer sentiment survey: How current events are shaping I...
McKinsey European consumer sentiment survey: How current events are shaping I...
 
McKinsey European consumer sentiment survey: How current events are shaping G...
McKinsey European consumer sentiment survey: How current events are shaping G...McKinsey European consumer sentiment survey: How current events are shaping G...
McKinsey European consumer sentiment survey: How current events are shaping G...
 
McKinsey European consumer sentiment survey: How current events are shaping F...
McKinsey European consumer sentiment survey: How current events are shaping F...McKinsey European consumer sentiment survey: How current events are shaping F...
McKinsey European consumer sentiment survey: How current events are shaping F...
 
McKinsey European consumer sentiment survey: How current events are shaping F...
McKinsey European consumer sentiment survey: How current events are shaping F...McKinsey European consumer sentiment survey: How current events are shaping F...
McKinsey European consumer sentiment survey: How current events are shaping F...
 
McKinsey European consumer sentiment survey: How current events are shaping U...
McKinsey European consumer sentiment survey: How current events are shaping U...McKinsey European consumer sentiment survey: How current events are shaping U...
McKinsey European consumer sentiment survey: How current events are shaping U...
 
McKinsey European consumer sentiment survey: How current events are shaping G...
McKinsey European consumer sentiment survey: How current events are shaping G...McKinsey European consumer sentiment survey: How current events are shaping G...
McKinsey European consumer sentiment survey: How current events are shaping G...
 
McKinsey European consumer sentiment survey: How current events in Europe are...
McKinsey European consumer sentiment survey: How current events in Europe are...McKinsey European consumer sentiment survey: How current events in Europe are...
McKinsey European consumer sentiment survey: How current events in Europe are...
 
McKinsey European consumer sentiment survey: How current events are shaping S...
McKinsey European consumer sentiment survey: How current events are shaping S...McKinsey European consumer sentiment survey: How current events are shaping S...
McKinsey European consumer sentiment survey: How current events are shaping S...
 
McKinsey European consumer sentiment survey: How current events are shaping I...
McKinsey European consumer sentiment survey: How current events are shaping I...McKinsey European consumer sentiment survey: How current events are shaping I...
McKinsey European consumer sentiment survey: How current events are shaping I...
 
McKinsey survey: European consumer sentiment survey: How current events are s...
McKinsey survey: European consumer sentiment survey: How current events are s...McKinsey survey: European consumer sentiment survey: How current events are s...
McKinsey survey: European consumer sentiment survey: How current events are s...
 
McKinsey survey: European consumer sentiment survey: How current events are s...
McKinsey survey: European consumer sentiment survey: How current events are s...McKinsey survey: European consumer sentiment survey: How current events are s...
McKinsey survey: European consumer sentiment survey: How current events are s...
 
McKinsey Survey: European consumer sentiment during the coronavirus crisis
McKinsey Survey: European consumer sentiment during the coronavirus crisisMcKinsey Survey: European consumer sentiment during the coronavirus crisis
McKinsey Survey: European consumer sentiment during the coronavirus crisis
 

Dernier

Russian Call Girls In Gurgaon ❤️8448577510 ⊹Best Escorts Service In 24/7 Delh...
Russian Call Girls In Gurgaon ❤️8448577510 ⊹Best Escorts Service In 24/7 Delh...Russian Call Girls In Gurgaon ❤️8448577510 ⊹Best Escorts Service In 24/7 Delh...
Russian Call Girls In Gurgaon ❤️8448577510 ⊹Best Escorts Service In 24/7 Delh...
lizamodels9
 
Call Girls Jp Nagar Just Call 👗 7737669865 👗 Top Class Call Girl Service Bang...
Call Girls Jp Nagar Just Call 👗 7737669865 👗 Top Class Call Girl Service Bang...Call Girls Jp Nagar Just Call 👗 7737669865 👗 Top Class Call Girl Service Bang...
Call Girls Jp Nagar Just Call 👗 7737669865 👗 Top Class Call Girl Service Bang...
amitlee9823
 
Call Girls Hebbal Just Call 👗 7737669865 👗 Top Class Call Girl Service Bangalore
Call Girls Hebbal Just Call 👗 7737669865 👗 Top Class Call Girl Service BangaloreCall Girls Hebbal Just Call 👗 7737669865 👗 Top Class Call Girl Service Bangalore
Call Girls Hebbal Just Call 👗 7737669865 👗 Top Class Call Girl Service Bangalore
amitlee9823
 
Call Now ☎️🔝 9332606886🔝 Call Girls ❤ Service In Bhilwara Female Escorts Serv...
Call Now ☎️🔝 9332606886🔝 Call Girls ❤ Service In Bhilwara Female Escorts Serv...Call Now ☎️🔝 9332606886🔝 Call Girls ❤ Service In Bhilwara Female Escorts Serv...
Call Now ☎️🔝 9332606886🔝 Call Girls ❤ Service In Bhilwara Female Escorts Serv...
Anamikakaur10
 
Call Girls Electronic City Just Call 👗 7737669865 👗 Top Class Call Girl Servi...
Call Girls Electronic City Just Call 👗 7737669865 👗 Top Class Call Girl Servi...Call Girls Electronic City Just Call 👗 7737669865 👗 Top Class Call Girl Servi...
Call Girls Electronic City Just Call 👗 7737669865 👗 Top Class Call Girl Servi...
amitlee9823
 

Dernier (20)

Dr. Admir Softic_ presentation_Green Club_ENG.pdf
Dr. Admir Softic_ presentation_Green Club_ENG.pdfDr. Admir Softic_ presentation_Green Club_ENG.pdf
Dr. Admir Softic_ presentation_Green Club_ENG.pdf
 
Russian Call Girls In Gurgaon ❤️8448577510 ⊹Best Escorts Service In 24/7 Delh...
Russian Call Girls In Gurgaon ❤️8448577510 ⊹Best Escorts Service In 24/7 Delh...Russian Call Girls In Gurgaon ❤️8448577510 ⊹Best Escorts Service In 24/7 Delh...
Russian Call Girls In Gurgaon ❤️8448577510 ⊹Best Escorts Service In 24/7 Delh...
 
Famous Olympic Siblings from the 21st Century
Famous Olympic Siblings from the 21st CenturyFamous Olympic Siblings from the 21st Century
Famous Olympic Siblings from the 21st Century
 
Call Girls Jp Nagar Just Call 👗 7737669865 👗 Top Class Call Girl Service Bang...
Call Girls Jp Nagar Just Call 👗 7737669865 👗 Top Class Call Girl Service Bang...Call Girls Jp Nagar Just Call 👗 7737669865 👗 Top Class Call Girl Service Bang...
Call Girls Jp Nagar Just Call 👗 7737669865 👗 Top Class Call Girl Service Bang...
 
Monthly Social Media Update April 2024 pptx.pptx
Monthly Social Media Update April 2024 pptx.pptxMonthly Social Media Update April 2024 pptx.pptx
Monthly Social Media Update April 2024 pptx.pptx
 
Call Girls Hebbal Just Call 👗 7737669865 👗 Top Class Call Girl Service Bangalore
Call Girls Hebbal Just Call 👗 7737669865 👗 Top Class Call Girl Service BangaloreCall Girls Hebbal Just Call 👗 7737669865 👗 Top Class Call Girl Service Bangalore
Call Girls Hebbal Just Call 👗 7737669865 👗 Top Class Call Girl Service Bangalore
 
Business Model Canvas (BMC)- A new venture concept
Business Model Canvas (BMC)-  A new venture conceptBusiness Model Canvas (BMC)-  A new venture concept
Business Model Canvas (BMC)- A new venture concept
 
Mysore Call Girls 8617370543 WhatsApp Number 24x7 Best Services
Mysore Call Girls 8617370543 WhatsApp Number 24x7 Best ServicesMysore Call Girls 8617370543 WhatsApp Number 24x7 Best Services
Mysore Call Girls 8617370543 WhatsApp Number 24x7 Best Services
 
Call Girls In Panjim North Goa 9971646499 Genuine Service
Call Girls In Panjim North Goa 9971646499 Genuine ServiceCall Girls In Panjim North Goa 9971646499 Genuine Service
Call Girls In Panjim North Goa 9971646499 Genuine Service
 
B.COM Unit – 4 ( CORPORATE SOCIAL RESPONSIBILITY ( CSR ).pptx
B.COM Unit – 4 ( CORPORATE SOCIAL RESPONSIBILITY ( CSR ).pptxB.COM Unit – 4 ( CORPORATE SOCIAL RESPONSIBILITY ( CSR ).pptx
B.COM Unit – 4 ( CORPORATE SOCIAL RESPONSIBILITY ( CSR ).pptx
 
Katrina Personal Brand Project and portfolio 1
Katrina Personal Brand Project and portfolio 1Katrina Personal Brand Project and portfolio 1
Katrina Personal Brand Project and portfolio 1
 
A DAY IN THE LIFE OF A SALESMAN / WOMAN
A DAY IN THE LIFE OF A  SALESMAN / WOMANA DAY IN THE LIFE OF A  SALESMAN / WOMAN
A DAY IN THE LIFE OF A SALESMAN / WOMAN
 
Falcon Invoice Discounting platform in india
Falcon Invoice Discounting platform in indiaFalcon Invoice Discounting platform in india
Falcon Invoice Discounting platform in india
 
Eluru Call Girls Service ☎ ️93326-06886 ❤️‍🔥 Enjoy 24/7 Escort Service
Eluru Call Girls Service ☎ ️93326-06886 ❤️‍🔥 Enjoy 24/7 Escort ServiceEluru Call Girls Service ☎ ️93326-06886 ❤️‍🔥 Enjoy 24/7 Escort Service
Eluru Call Girls Service ☎ ️93326-06886 ❤️‍🔥 Enjoy 24/7 Escort Service
 
Falcon Invoice Discounting: The best investment platform in india for investors
Falcon Invoice Discounting: The best investment platform in india for investorsFalcon Invoice Discounting: The best investment platform in india for investors
Falcon Invoice Discounting: The best investment platform in india for investors
 
Organizational Transformation Lead with Culture
Organizational Transformation Lead with CultureOrganizational Transformation Lead with Culture
Organizational Transformation Lead with Culture
 
RSA Conference Exhibitor List 2024 - Exhibitors Data
RSA Conference Exhibitor List 2024 - Exhibitors DataRSA Conference Exhibitor List 2024 - Exhibitors Data
RSA Conference Exhibitor List 2024 - Exhibitors Data
 
Call Now ☎️🔝 9332606886🔝 Call Girls ❤ Service In Bhilwara Female Escorts Serv...
Call Now ☎️🔝 9332606886🔝 Call Girls ❤ Service In Bhilwara Female Escorts Serv...Call Now ☎️🔝 9332606886🔝 Call Girls ❤ Service In Bhilwara Female Escorts Serv...
Call Now ☎️🔝 9332606886🔝 Call Girls ❤ Service In Bhilwara Female Escorts Serv...
 
MONA 98765-12871 CALL GIRLS IN LUDHIANA LUDHIANA CALL GIRL
MONA 98765-12871 CALL GIRLS IN LUDHIANA LUDHIANA CALL GIRLMONA 98765-12871 CALL GIRLS IN LUDHIANA LUDHIANA CALL GIRL
MONA 98765-12871 CALL GIRLS IN LUDHIANA LUDHIANA CALL GIRL
 
Call Girls Electronic City Just Call 👗 7737669865 👗 Top Class Call Girl Servi...
Call Girls Electronic City Just Call 👗 7737669865 👗 Top Class Call Girl Servi...Call Girls Electronic City Just Call 👗 7737669865 👗 Top Class Call Girl Servi...
Call Girls Electronic City Just Call 👗 7737669865 👗 Top Class Call Girl Servi...
 

McKinsey Survey: Japanese consumer sentiment during the coronavirus crisis

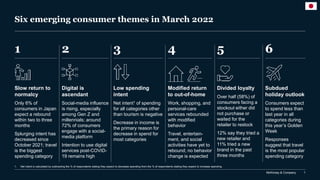
  • 1. McKinsey & Company 1 Six emerging consumer themes in March 2022 1 Slow return to normalcy Only 6% of consumers in Japan expect a rebound within two to three months Splurging intent has decreased since October 2021; travel is the biggest spending category 2 Digital is ascendant Social-media influence is rising, especially among Gen Z and millennials; around 72% of consumers engage with a social- media platform Intention to use digital services post-COVID- 19 remains high 5 Divided loyalty Over half (58%) of consumers facing a stockout either did not purchase or waited for the retailer to restock 12% say they tried a new retailer and 11% tried a new brand in the past three months 4 Modified return to out-of-home Work, shopping, and personal-care services rebounded with modified behavior Travel, entertain- ment, and social activities have yet to rebound; no behavior change is expected 3 Low spending intent Net intent1 of spending for all categories other than tourism is negative Decrease in income is the primary reason for decrease in spend for most categories 6 Subdued holiday outlook Consumers expect to spend less than last year in all categories during this year’s Golden Week Responses suggest that travel is the most popular spending category 1. Net intent is calculated by subtracting the % of respondents stating they expect to decrease spending from the % of respondents stating they expect to increase spending.
  • 2. McKinsey & Company 2 Confidence in own country’s economic recovery after COVID-19,1 % of respondents 11 15 15 21 14 29 32 20 29 34 46 56 51 63 48 47 75 68 55 38 28 27 23 23 21 5 3 29 59 12 Mixed: The economy will be impacted for 6–12 months or longer and will stagnate or show slow growth thereafter Pessimistic: COVID-19 will have lasting impact on the economy and show regression or fall into lengthy recession Optimistic: The economy will rebound within 2–3 months and grow just as strong as or stronger than before COVID-19 1. Q: What is your overall confidence level surrounding economic conditions after the coronavirus (COVID-19) crisis subsides (ie, once there is herd immunity)? Rated from 1 “very optimistic” to 6 “very pessimistic.” Bars may not sum to 100% due to rounding. Change in Optimistic vs. last wave survey, percentage points Source: McKinsey & Company COVID-19 Consumer Pulse Survey India 3/11–24 +1 Oct 2021 China 3/11–20 -12 Oct 2021 US 3/1–25 -6 Oct 2021 Japan 3/16–26 -2 Oct 2021 Indonesia 3/16–26 +15 Sept 2020 Australia 3/16–25 -10 Nov 2020 Korea 3/19–26 +15 June 2020 Germany 3/22–28 -10 Oct 2021 France 3/23–28 -9 Oct 2021 UK 3/22–29 -12 Oct 2021 Japanese consumers are the least optimistic geographic segment Slow return to normalcy | Current as of March 2022
  • 3. McKinsey & Company 3 Slow return to normalcy | Current as of March 2022 1. Q: What is your overall confidence level surrounding economic conditions after the coronavirus (COVID-19) crisis subsides (ie, once there is herd immunity)? Rated from 1 “very optimistic” to 6 “very pessimistic.” Figures may not sum to 100% because of rounding. 2. Average of weekly pulse surveys shown for March and April 2020. Optimistic: The economy will rebound within 2–3 months and grow just as strong as or stronger than before COVID-19 Mixed: The economy will be impacted for 6-12 months or longer and will stagnate or show slow growth thereafter Pessimistic: COVID-19 will have lasting impact on the economy and show regression or fall into lengthy recession Source: McKinsey & Company COVID-19 Japan Consumer Pulse Survey, 3/16–3/26/2022, n = 1,018; 10/18–10/20/2021, n = 1,014; 2/24–2/27/2021, n = 1,014; 11/9–11/15/2020, n = 1,039; 9/22–9/28/2020, n = 1,034, sampled and weighted to match Japan general population 18+ years Pessimism has seen a marked increase, while optimism has decreased slightly Confidence in own country’s economic recovery after COVID-19,1 % of respondents 41 46 42 35 31 33 21 21 29 53 49 53 60 62 60 67 65 59 6 5 5 5 7 7 12 14 12 Nov 2020 Oct 2021 Feb 2021 Apr 20202 Mar 20202 May 2020 June 2020 Sept 2020 Mar 2022
  • 4. McKinsey & Company 4 Lower-income consumers are more pessimistic than higher-income groups 1. Q: What is your overall confidence level surrounding economic conditions after the coronavirus (COVID-19) crisis subsides (ie, once there is herd immunity)? Rated from 1 “very optimistic” to 6 “very pessimistic.” Optimism by income Pessimism by income Source: McKinsey & Company COVID-19 Japan Consumer Pulse Survey, 3/16–3/26/2022, n = 1,018; 10/18–10/20/2021, n = 1,014; 2/24–2/27/2021, n = 1,014; 11/9–11/15/2020, n = 1,039; 9/22–9/28/2020, n = 1,034, sampled and weighted to match Japan general population 18+ years Confidence in own country’s economic recovery after COVID-19 by income level,1 % of respondents 5 8 10 8 15 9 8 17 18 13 35 0 30 5 20 10 15 25 40 45 50 55 Oct 2021 7 Sept 2020 5 Nov 2020 Feb 2021 14 Mar 2022 9 16 Low (<4M yen) Medium (4M–8M yen) High (>8M yen) 35 36 24 26 34 28 23 27 31 16 18 26 0 30 15 10 55 5 20 25 35 40 45 50 31 Sept 2020 17 Nov 2020 Oct 2021 20 Feb 2021 Mar 2022 Slow return to normalcy | Current as of March 2022
  • 5. McKinsey & Company 5 The older the generation is, the less pessimistic respondents are about Japanese economic recovery Slow return to normalcy | Current as of March 2022 Confidence in own country’s economic recovery after COVID-191 % of respondents 28 33 61 50 11 18 Unvaccinated Vaccinated 1. Q: What is your overall confidence level surrounding economic conditions after the coronavirus (COVID-19) crisis subsides (ie, once there is herd immunity)? Rated from 1 “very optimistic” to 6 “very pessimistic.” 2. Baby boomers includes silent generation. 36 33 30 24 52 54 60 63 13 12 10 13 Gen Z Millennials Gen X Baby boomers2 Mixed Optimistic Pessimistic Source: McKinsey & Company COVID-19 Japan Consumer Pulse Survey, 3/16–3/26/2022, n = 1,018, sampled and weighted to match Japan general population 18+ years By generation By vaccination status
  • 6. McKinsey & Company 6 Slow return to normalcy | Current as of March 2022 23 25 29 19 2 2 2 77 73 69 79 Gen Z Millennials Gen X Baby boomers3 0 21 40 2 2 77 59 Vaccinated Unvaccinated 23 2 75 Overall 1. Q: When do you expect your routines will return to normal? Figures may not sum to 100% because of rounding. 2. Q: Which best describes your vaccination status? 3. Baby boomers includes silent generation. Source: McKinsey & Company COVID-19 Japan Consumer Pulse Survey, 3/16–3/26/2022, n = 1,018, sampled and weighted to match Japan general population 18+ years After June 2022 By June 2022 Not affected/already returned By generation By vaccination status2 Expectations are similar across the generations, although baby boomers expect a slower return to pre- COVID-19 routine ~40% of unvaccinated consumers are engaging in pre- COVID-19 routines Key findings Overall, 75 percent of consumers expect pre-COVID-19 routines will return after June 2022 Expectations on routines returning to pre-COVID-19,1 % of respondents
  • 7. McKinsey & Company 7 Perceived impact of COVID-19 on consumers’ income, spending, and savings has been limited and improved slightly in March 2022 Slow return to normalcy | Current as of March 2022 Source: McKinsey & Company COVID-19 Japan Consumer Pulse Survey, 3/16–3/26/2022, n = 1,018; 10/18–10/20/2021, n = 1,014; 2/24–2/27/2021, n = 1,014; 11/9–11/15/2020, n = 1,039, sampled and weighted to match Japan general population 18+ years 1. Q: How has the coronavirus (COVID-19) crisis affected the following over the past 1 month/2 weeks? Figures may not sum to 100% because of rounding. COVID-19 impact on household finances,1 % of respondents 26 26 24 20 72 71 73 77 2 3 3 3 Past 2 weeks Past 2 weeks Past 2 weeks Past 2 weeks 27 24 23 23 65 65 68 71 8 11 9 5 Past 2 weeks Past 2 weeks Past 2 weeks Past 2 weeks 19 19 18 13 68 63 70 73 13 18 12 14 Past 2 weeks Past 2 weeks Past 2 weeks Past 2 weeks Household income Household spending Household savings Nov 2020 Feb 2021 Oct 2021 Reduce slightly/a lot Increase slightly/a lot About the same Mar 2022 Nov 2020 Feb 2021 Oct 2021 Mar 2022 Nov 2020 Feb 2021 Oct 2021 Mar 2022
  • 8. McKinsey & Company 8 Almost two-thirds of Japanese consumers say their finances have returned to ‘normal’ already Slow return to normalcy | Current as of March 2022 61 65 63 64 7 32 32 35 34 Gen X Gen Z Baby boomers3 Millennials 3 2 1 63 68 35 29 2 Vaccinated Unvaccinated 3 64 34 Overall 2 1. Q: When do you expect your personal/household finances will return to normal? Figures may not sum to 100% because of rounding. 2. Q: Which best describes your vaccination status? 3. Baby boomers includes silent generation. Source: McKinsey & Company COVID-19 Japan Consumer Pulse Survey, 3/16–3/26/2022, n = 1,018, sampled and weighted to match Japan general population 18+ years By generation By vaccination status2 Expectations are similar across generations Unvaccinated respondents are more positive than the vaccinated about when their finances will return to ‘normal’ Expectations on personal/household finances returning to ‘normal,’1 % of respondents After June 2022 Not affected/already returned By June 2022
  • 9. McKinsey & Company 9 Slow return to normalcy | Current as of March 2022 Intent to ‘splurge’ is greatest among higher-income Gen Z consumers; intent for middle-income Gen Z has risen 17 points Source: McKinsey & Company COVID-19 Japan Consumer Pulse Survey, 3/16–3/26/2022, n = 1,018; 10/18–10/20/2021, n = 1,014, sampled and weighted to match Japan general population 18+ years 24 27 73 Do not plan on splurging Oct 2021 76 Plan on splurging Mar 2022 Millennials Gen X Baby boomers2 41% −4 42% 17 Gen Z 55% 3 36% −1 23% −10 39% 7 15% −1 23% 2 38% 10 20% −8 17% −6 19% −2 Generation Respondents who plan/do not plan to ‘splurge’ or ‘treat themselves’ in 20221 % of respondents Low (<$50K/year) Middle ($50K–100K/year) High (>$100K/year) >70% <30% 50-70% 30-50% p.p. change from Oct 21 XX Respondents who plan to splurge, by household income, % 1. Q: With regard to products and services you will spend money on, do you plan to splurge/treat yourself in 2022? For example, are there categories of products or services you have spent less on over the last year and a half which you feel you will spend more on in the next 3 months? 2. Baby Boomers includes silent generation.
  • 10. McKinsey & Company 10 Tourism is the biggest category driven by baby boomers; younger generations want to splurge on fashion, entertainment, and cosmetics Slow return to normalcy | Current as of March 2022 Categories where consumers intend to treat themselves1 % of all respondents with intent to splurge 1. Q: You mentioned that you plan to splurge/treat yourself in next 3 months. Which categories do you intend to treat yourself to? Please select all that apply. 2. Baby boomers includes silent generation. 48 40 22 20 13 10 8 8 7 7 6 5 2 Electronics Sports apparel and equipment Items for your home Travel, lodging, and vacation Restaurants, dining out, bars Apparel, shoes, accessories Outdoor living Out-of-home entertainment Makeup and skin care products Household essentials Personal services Fitness Pets Millennials Gen X Gen Z Baby boomers2 43 46 32 62 43 39 40 40 31 30 17 15 25 22 19 18 24 14 15 7 7 12 11 9 12 13 10 3 10 8 6 8 7 12 6 5 Generational cut 8 11 7 2 5 14 4 2 5 9 5 3 0 5 2 1 Change from Oct 2021, percentage points Source: McKinsey & Company COVID-19 Japan Consumer Pulse Survey, 3/16–3/26/2022, n = 1,018; 10/18–10/20/2021, n = 1,014, sampled and weighted to match Japan general population 18+ years Between −3 and +3 < −3 > +3 5 8 −12 5 −9 −5 −3 −1 2 −3 −1 0 −2 Categories Difference from all respondents, percentage points
  • 11. McKinsey & Company 11 Social media has the strongest influence on Gen Z and millennials purchasing across all categories Digital is ascendant | Current as of March 2022 1. Q: Think about the purchases you have made in the following categories over the past 3 months. Were you influenced toward a certain brand by a post on social media in the following categories?. 2. Baby boomers includes silent generation. 31 30 26 26 23 23 21 15 14 13 11 11 10 10 8 8 Vitamins, supplements, and over-the-counter medicine Accessories Apparel Home decoration and furniture Jewelry Consumer electronics Sports and outdoors equipment and supplies Fitness and wellness services Skin care and makeup Groceries, food for home Footwear Kitchen and dining Pet food and supplies Personal-care products Home improvement and garden supplies Household supplies Millennials Gen X Gen Z Baby boomers2 44 28 0 39 44 11 33 37 36 18 19 52 30 21 8 59 32 24 7 35 41 26 15 58 33 13 10 54 23 12 6 47 22 9 5 Generational cut 26 21 11 9 30 18 7 8 23 22 8 6 36 15 6 5 Source: McKinsey & Company COVID-19 Japan Consumer Pulse Survey, 3/16–3/26/2022, n = 1,018, sampled and weighted to match Japan general population 18+ years Between −3 and +3 < −3 > +3 Categories Categories where respondents were influenced by social media1 % of all respondents 25 32 56 23 19 13 14 7 8 5 4 6 5 Difference from all respondents, percentage points
  • 12. McKinsey & Company 12 About 70 percent of consumers engage on a social-media platform at least once a week Frequency of engagement with social-media platforms1 % of all respondents whose purchases were influenced in last 6 months (across any product category) 1. Q: What social media platforms do you engage with, and if so, how frequently? Source: McKinsey & Company COVID-19 Japan Consumer Pulse Survey, 3/16–3/26/2022, n = 1,018, sampled and weighted to match Japan general population 18+ years 72 61 37 35 24 10 4 3 3 2 28 39 63 65 76 90 96 97 97 98 YouTube Overall Pinterest Twitter Instagram Facebook TikTok Reddit LinkedIn Snapchat Never/less than weekly Weekly or more Digital is ascendant | Current as of March 2022
  • 13. McKinsey & Company 13 Source: McKinsey & Company COVID-19 Japan Consumer Pulse Survey, 3/16–3/26/2022, n = 1,018, sampled and weighted to match Japan general population 18+ years Intent to use when the COVID-19 crisis subsides2 % of new or increased users who intend to keep doing activity User growth since COVID-19 1 1. User growth is calculated as % of respondents who replied that they are new users over % of respondents who replied that they were using the product/service pre-COVID-19 (using more, using the same, or using less) on Q: Which best describes when you have done or used each of these items? 2. Q: Compared to now, will you do or use the following more, less, or not at all, once the coronavirus (COVID-19) crisis subsides (ie, once there is herd immunity)? Possible answers: “will stop this”; ”will reduce this”; “will keep doing what I am doing now”; “will increase this.” Number indicates percent who chose “will keep doing what I am doing now” and “will increase this” among new or increased users. Consumers have made shifts in loyalty and shopping behavior and intend to maintain changes in the next phase of COVID-19 76 10 52 92 86 54 18 94 68 70 88 72 74 22 8 12 60 14 78 16 90 80 0 84 56 20 58 82 2 4 6 Personal care/grooming at home New store/restaurant app Purchased pre-owned product Drive-thru lane Buy online, pick up in store Downloaded/used deal-finding plug-ins Paid more for same-day delivery Grocery delivery Meal kit delivery Purchased directly from social media Restaurant food delivery Shopped at a new store Changed my primary store Paid more for 2-hour or 1-hour delivery Digital is ascendant | Current as of March 2022
  • 14. McKinsey & Company 14 Digital is ascendant | Current as of March 2022 Source: McKinsey & Company COVID-19 Japan Consumer Pulse Survey, 3/16–3/26/2022, n = 1,018, sampled and weighted to match Japan general population 18+ years Intent to use when the COVID-19 crisis subsides2 % of new or increased users who intend to keep doing activity User growth since COVID-19 1 1. User growth is calculated as % of respondents who replied that they are new users over % of respondents who replied that they were using the product/service pre-COVID-19 (using more, using the same or using less) on Q: Which best describes when you have done or used each of these items? 2. Q: Compared to now, will you do or use the following more, less, or not at all, once the coronavirus (COVID-19) crisis subsides (ie, once there is herd immunity)? Possible answers: “will stop this”; ”will reduce this”; “will keep doing what I am doing now”; “will increase this.” Number indicates respondents who chose “will keep doing what I am doing now” and “will increase this” among new or increased users. Intent to use digital services after the next phase of COVID-19 remains high for all service categories 81 96 51 62 92 93 95 50 64 52 97 99 98 61 85 63 100 65 3 70 74 0 67 66 77 79 68 6 69 84 71 72 73 75 82 76 78 80 83 9 86 94 87 88 89 90 91 Remote learning: myself Watching e-sports Social player/video app Playing online games Online fitness Wellness app Online streaming Videoconferencing: professional Remote learning: my children Social media Video chat: personal
  • 15. McKinsey & Company 15 5 32 6 56 3 26 4 60 29 2 3 12 11 0 9 43 4 12 2 36 46 24 45 69 3 27 13 13 3 78 42 50 2 39 17 6 5 40 58 8 30 15 4 55 44 46 5 29 50 40 0 20 21 76 3 0 8 14 64 14 6 6 46 42 10 15 35 4 12 2 54 70 55 15 22 A drive-thru line for a fast-food restaurant Curbside pickup from a restaurant Curbside delivery at a store Buy online, pick up in store Self-checkout or scan-and-go at a physical store Downloaded/used deal-finding plug-ins Downloaded/used a new store/restaurant app 21 Purchased secondhand products online Used an app/website for delivery within 2 hours Used an app/website for same-day delivery Bought or sold a cryptocurrency Bought or sold an NFT Used an augmented-reality/virtual-reality headset Changed my primary grocery store Shopped at a store I had not shopped at before for groceries Cooked regularly for myself/my family Personal care/grooming at home Tried making something myself/DIY project Purchased directly from social media Source: McKinsey & Company COVID-19 Japan Consumer Pulse Survey, 3/16–3/26/2022, n = 1,018, sampled and weighted to match Japan general population 18+ years Intent to continue2 Consumers who use alternatives to in-store shopping report using them as often or more frequently in the last three months Digital is ascendant | Current as of March 2022 88 78 81 79 74 68 93 53 83 90 50 70 95 92 97 88 88 Which best describes when you have done or used each of these items?1 % of respondents who have used in the last 3 months Just started using Using less Using more Using same 96 89 1. Q: And have you used or done any of the following in the last 3 months? If yes, Q: Which best describes when you have done or used each of these items? Possible answers: “just started using since COVID-19 started”; “I have not used in the last 3 months”; “I have used in the last 3 months at the same rate as before”; “I have used this more in the past 3 month than before”; “I have used this less in the past 3 months than before.” 2. Q: Compared to now, will you do or use the following more, less, or not at all, once the coronavirus (COVID-19) ) crisis subsides (ie, once there is herd immunity)? Possible answers: “will stop this”; ”will reduce this”; “will keep doing what I am doing now”; “will increase this.” Number indicates % of respondents who chose “will keep doing what I am doing now” and “will increase this” among new or increased users.
  • 16. McKinsey & Company 16 Digital services are being used more frequently, and there is strong intent to continue this behavior 1. Q: Have you used or done any of the following since the coronavirus (COVID-19) crisis started? If yes, Q: Which best describes when you have done or used each of these items? Possible answers: “just started using since COVID-19 started”; “using more since COVID-19 started”; “using about the same since COVID-19 started”; “using less since COVID-19 started.” 2. Q: Compared to now, will you do or use the following more, less, or not at all, once the coronavirus (COVID-19) crisis subsides (ie, once there is herd immunity)? Possible answers: “will stop this”; ”will reduce this”; “will keep doing what I am doing now”; “will increase this.” Number indicates % of respondents who chose “will keep doing what I am doing now” and “will increase this” among new or increased users. Source: McKinsey & Company COVID-19 Japan Consumer Pulse Survey, 3/16–3/26/2022, n = 1,018, sampled and weighted to match Japan general population 18+ years Digital is ascendant | Current as of March 2022 2 59 61 14 42 5 6 7 0 35 5 60 36 0 40 50 0 0 2 10 20 39 1 75 1 0 Online streaming 4 1 4 45 0 55 2 41 75 45 5 21 0 0 55 0 64 36 0 54 39 57 1 48 7 69 31 0 0 47 50 0 73 34 63 3 0 Online fitness Wellness app Meal-kit delivery Restaurant delivery Grocery delivery 3 Video chat: personal Telemedicine: physical Telemedicine: mental Watching e-sports Playing online games Remote learning: myself Remote learning: my children Social player/video app Social media Videoconferencing: professional 67 100 61 78 81 88 76 62 89 96 51 81 100 90 80 97 Intent to continue2 Which best describes when you have done or used each of these items?1 % of respondents who have used in the last three months Just started using Using less Using same Using more
  • 17. McKinsey & Company 17 With increasing out-of-home activities, the in-store channel is seeing a rise, followed closely by omnichannel Digital is ascendant | Current as of March 2022 1. Q: Which best describes how you have researched the following categories over the last 3 months? 2. Q: Which best describes how you have purchased the following categories over the last 3 months? 85 80 77 77 72 72 68 63 60 54 53 53 52 48 47 47 46 42 40 32 14 18 18 18 22 20 27 27 33 30 36 29 28 34 34 30 28 28 35 45 1 2 5 5 6 8 5 10 7 16 11 18 20 18 19 23 26 30 25 23 Tobacco products and smoking supplies Books, magazines, newspapers Food takeout/delivery Home improvement and gardening supplies Groceries/food for home Household supplies Alcoholic beverages Pet care services (eg, walkers, grooming) Personal-care products Kitchen and dining Fitness and wellness services Skin care and makeup Home decoration and furniture Apparel Accessories (eg, handbags, sunglasses) Pet food and supplies Consumer electronics Vitamins, supplements, and over-the-counter medicine Sports and outdoors equipment and supplies Toys and baby supplies Research and purchase only in stores Omnichannel Research and purchase only online Product searches1 and purchases2 by channel % of respondents who purchased and searched in these categories in the last 3 months Source: McKinsey & Company COVID-19 Japan Consumer Pulse Survey, 3/16–3/26/2022, n = 1,018, sampled and weighted to match Japan general population 18+ years
  • 18. McKinsey & Company 18 Expected spending per category over the next 2–3 months vs usual1 Net intent2 Source: McKinsey & Company COVID-19 Japan Consumer Pulse Survey, 3/16–3/26/2022, n = 1,018; 10/18–10/20/2021, n = 1,014; 2/24–2/27/2021, n = 1,014; 11/9–11/15/2020, n = 1,039; 9/22–9/28/2020, n = 1,034; 6/19–6/22/2020, n = 664, sampled and weighted to match Japan general population 18+ years Spending intent is gradually recovering but expected to be lower than usual across most categories over next several months 1. Q: Over the next 2–3 months, do you expect that you will spend more, about the same, or less money on these categories than usual? Figures may not sum to 100% because of rounding. 2. Net intent is calculated by subtracting the % of respondents stating they expect to decrease spending from the % of respondents stating they expect to increase spending. Low spending intent | Current as of March 2022 0 −40 −50 20 −30 −20 −10 10 May 2020 Feb 2021 Mar 2020 Apr 2020 June 2020 Sept 2020 Nov 2020 Oct 2021 Mar 2022 Household supplies Groceries Consumer electronics Skin care and makeup Fitness and wellness ​Personal-care products Apparel
  • 19. McKinsey & Company 19 Consumers report negative net intent to spend for all categories except tourism, which saw an increase since October 2021 Net intent >1 Net intent −15 to 0 Net intent: < −15 Source: McKinsey & Company COVID-19 Japan Consumer Pulse Survey, 3/16–3/26/2022, n = 1,018; 10/18–10/20/2021, n = 1,014, sampled and weighted to match Japan general population 18+ years 7 8 18 13 15 21 27 19 33 31 14 6 13 26 19 10 10 8 2 8 6 6 7 13 4 14 16 11 2 Alcohol Quick-service restaurant Footwear Restaurant Jewelry Accessories Toys and baby Household supplies Skin care and makeup Home and furniture Sports and outdoors Kitchen and dining Home improvement, garden 5 3 Apparel Groceries 12 11 5 Personal-care products Tobacco products 6 Food takeout and delivery 6 Increase Decrease Stay the same 10 12 10 25 18 12 10 12 14 16 15 17 21 19 21 15 5 11 15 20 23 28 100 21 21 25 16 Fitness and wellness Consumer electronics 5 Vehicles Pet food and supplies Out-of-home entertainment Vitamins and OTC medicine Entertainment at home Books/magazines/newspapers Pet care services 3 Personal-care services Gasoline Hotel/resort stays Short-term home rentals 13 5 3 Cruises 0 4 4 Adventures and tours International flights 12 Domestic flights Travel by car Net intent2 −1 −6 −20 −2 −8 3 −10 5 8 11 100 1 2 4 −4 −4 1. Q: Over the next 2–3 months, do you expect that you will spend more, about the same, or less money on these categories than usual? Figures may not sum to 100% because of rounding. 2. Net intent is calculated by subtracting the % of respondents stating they expect to decrease spending from the % of respondents stating they expect to increase spending. 3. Sample size < 30. Expected spending per category over the next 2 weeks vs usual1 % of respondents −5 −2 −14 −6 2 6 −10 −1 N/A3 −5 −2 −8 −3 −8 −6 1 2 −8 Change since Oct 2021 Change since Oct 2021 −2 −1 −5 −23 −3 −16 7 −8 7 −2 5 −2 N/A3 10 N/A3 13 N/A3 21 1 24 Net intent2 −22 1 −1 −3 −12 −6 −10 −8 −9 −10 −22 −13 −24 −3 −8 −3 1 −8 Low spending intent | Current as of March 2022
  • 20. McKinsey & Company 20 Net intent to spend is expected to decrease across most categories, but vaccinated respondents are more likely than others to spend Low spending intent | Current as of March 2022 Source: McKinsey & Company COVID-19 Japan Consumer Pulse Survey, 3/16–3/26/2022, n = 1,018, sampled and weighted to match Japan general population 18+ years 1. Net intent is calculated by subtracting the % of respondents stating they expect to decrease spending from the % of respondents stating they expect to increase spending. 2. Q: Over the next 2–3 months, do you expect that you will spend more, about the same, or less money on these categories than usual? +4 percentage points Likelihood of vaccinated vs unvaccinated people to spend For selected categories Net intent1 for expected spending per category over the next 2–3 months vs usual2 Unlikely Cautious Interested Vaccinated Groceries Food takeout and delivery Restaurant Quick-service restaurant Home decor Home and garden Personal-care items Fitness and wellness Out-of-home entertainment International flights 4 −7 −12 −4 14 −20 −6 −31 −6 0 −3 −1 −12 −18 0 0 −11 0 21 0 −16 −22 −49 −13 −49 −14 −13 −17 19 0 1 −11 −9 −9 −14 3 −2 5 −3 2 Between −3 and +3 < −3 > +3
  • 21. McKinsey & Company 21 Increase in price and shift to premiumization are the major factors across categories where spend has increased 4 6 5 4 16 7 11 35 8 3 9 12 15 22 20 16 5 15 10 33 25 33 37 18 19 20 40 18 25 27 16 33 14 7 13 37 16 15 19 30 32 32 31 62 36 43 46 46 35 33 57 79 48 33 47 32 56 40 33 40 26 11 27 15 32 18 49 29 14 Footwear Pet care services Groceries Food takeout/delivery Meal at restaurant Meal at quick-serve rest Pet food and supplies Personal-care products Household supplies Vitamins & supplements Vehicles Apparel Accessories Consumer electronics Home and decoration 0 Kitchen and dining Skin care and makeup Personal-care services Increase in income Larger quantity Increase in price Premium brands/products 1. Q: Please indicate the main reason for planning to spend more on the following categories. Reasons for increase in spend1 % of respondents who increased spend Low spending intent | Current as of March 2022 Source: McKinsey & Company COVID-19 Japan Consumer Pulse Survey, 3/16–3/26/2022, n = 1,018, sampled and weighted to match Japan general population 18+ years
  • 22. McKinsey & Company 22 Decrease in income and quantity are the major reasons across categories where spend has decreased 43 21 27 28 32 40 40 40 39 34 26 42 26 41 30 62 38 49 31 33 26 26 12 27 26 24 28 26 45 23 34 9 25 20 27 28 11 18 18 15 19 20 14 12 11 16 7 8 7 24 10 8 12 9 14 28 29 30 18 13 18 12 19 24 19 24 30 25 30 10 23 14 1 19 2 11 3 1 4 3 3 5 Meal at quick-serve rest Kitchen and dining Pet food and supplies Groceries Food takeout/delivery 1 0 Skin care and makeup Meal at restaurant Household supplies Personal-care products Pet care services Vitamins & supplements Apparel Footwear 0 Accessories Consumer electronics 0 Vehicles Home and decoration Personal-care services Switch to less expensive Decrease in income Spend more on other categories Smaller quantity Reduced price 1. Q: Please indicate the main reason for planning to spend less on the following categories. Reasons for decrease in spend1 % of respondents who decreased spend Low spending intent | Current as of March 2022 Source: McKinsey & Company COVID-19 Japan Consumer Pulse Survey, 3/16–3/26/2022, n = 1,018, sampled and weighted to match Japan general population 18+ years
  • 23. McKinsey & Company 23 Modified return to out-of-home | Current as of March 2022 Overall 14 25 Vaccinated Unvaccinated 18 Millennials Gen Z 20 18 Gen X Baby boomers3 12 Low (<4M yen) High (>8M yen) Medium (4M–8M yen) 16 16 16 1. Q: Which best describes when you will regularly return to stores, restaurants, and other out-of-home activities? Chart shows those already participating in these activities 2. Gen Z are people under 26 years old, millennials are 26–41 years old, Gen X are people 42–57 years old, baby boomers are 58 years old and above. 3. Baby boomers includes silent generation. Source: McKinsey & Company COVID-19 Japan Consumer Pulse Survey, 3/16–3/26/2022, n = 1,018; 10/18–10/20/2021, n = 1,014; 2/24–2/27/2021, n = 1,014; 11/9–11/15/2020, n = 1,039; 9/22–9/28/2020, n = 1,034; 6/19–6/22/2020, n = 664, sampled and weighted to match Japan general population 18+ years By generation2 By vaccination adoption By income ~20% of Gen X are doing out- of-home activities ~16% of households across income levels are doing out-of-home activities ~25% of people who are unvaccinated are doing out-of-home activities Consumers engaging in out-of-home activities,1 % of respondents About one-sixth of consumers say they have returned to out-of- home activities 16 24 15 29 27 19 Nov 2020 Mar 2022 Sep 2020 Oct 2021 Feb 2021 Jun 2020
  • 24. McKinsey & Company 24 Modified return to out-of-home | Current as of March 2022 Source: McKinsey & Company COVID-19 Japan Consumer Pulse Survey, 3/16–3/26/2022, n = 1,018, sampled and weighted to match Japan general population 18+ years Social Personal care Entertain- ment 80 57 59 51 60 93 62 78 55 Get together with family Attend an outdoor event Dine indoors at a restaurant or bar Go out for family entertainment Attend an indoor cultural event Go to the gym or fitness studio Visit a crowded outdoor public place Go to a hair or nail salon Get together with friends 82 99 97 84 71 53 89 36 51 58 57 Use public transportation Shop for non-necessities Work outside my home Use a ride-sharing service Shop for groceries/necessities Rent a short-term home Go to a shopping mall Travel more than 2 hours by car Travel by airplane Travel by train Stay in a hotel Work Shopping Transport/ travel −4 26 6 38 −3 61 26 2 45 43 13 42 49 40 27 42 58 14 58 34 50% and above Less than 50% Change >10 pp Change from Oct 2021, percentage points Change from Oct 2021, percentage points Consumers have increased most of their out-of-home activities since last year Out-of-home activities currently engaging1 % of respondents who reported doing this in the same or a modified way 1. Q: Which best describes how you are engaging in each of these activities? Possible answers: “Not doing this all”; “Doing this in the same way as pre-COVID-19 but less often”; “Doing this in a modified way vs pre-COVID-19”; “Doing this just as much and in the same way as I did pre-COVID-19”
  • 25. McKinsey & Company 25 1. Q: With the rise of the omicron variant of COVID-19, how, if at all, has your out-of-home behavior changed? Source: McKinsey & Company COVID-19 Japan Consumer Pulse Survey, 3/16–3/26/2022, n = 1,018, sampled and weighted to match Japan general population 18+ years 20 16 14 27 30 28 51 52 54 Low (<4M yen) 1 Medium (4M–8M yen) High (>8M yen) 2 4 Modified return to out-of-home | Current as of March 2022 8 16 30 28 27 55 36 1 Vaccinated Unvaccinated 18 28 52 Engage less Overall Engage with adjusted behavior Engage more Engage same as before omicron 2 By income By vaccination status Lower-income consumers are the likeliest income group to indicate they engage the same as or more than before omicron A third of unvaccinated consumers have not reduced or changed their out-of-home behavior, despite omicron variant Key findings Adjustments to out-of-home behavior due to prevalence of omicron variant,1 % of respondents About half of consumers reduced engagement in out-of-home activities due to the omicron variant; 28 percent engage differently
  • 26. McKinsey & Company 26 Modified return to out-of-home | Current as of March 2022 Source: McKinsey & Company COVID-19 Japan Consumer Pulse Survey, 3/16–3/26/2022, n = 1,018, sampled and weighted to match Japan general population 18+ years 1. Q: Which best describes how you are engaging in each of these activities? Possible answers: “Not doing this at all”; “Doing this in the same way as pre-COVID-19 but less often”; “Doing this in a modified way vs pre-COVID-19”; “Doing this just as much and in the same way as I did pre-COVID-19.” Work Shopping Transport/ travel Social Personal care Entertain- ment 89 Visit a crowded outdoor public place 11 9 15 Dine indoors at a restaurant or bar 91 10 85 15 Go out for family entertainment 85 Attend an indoor cultural event 10 90 Attend an outdoor event Go to the gym or fitness studio 53 90 84 48 52 16 Go to a hair or nail salon 47 Get together with family Get together with friends 48 Work outside my home 52 84 45 55 Shop for groceries/necessities Shop for non-necessities 82 21 79 Go to a shopping mall 20 80 0 58 18 42 82 Use public transportation 23 77 Use a ride-sharing service 19 81 Travel by airplane 18 Travel by train 16 Stay in a hotel 100 Rent a short-term home Travel more than 2 hours by car Doing less, doing in a modified way Doing as much as and in the same way as pre-COVID-19 Out-of-home activities engagement1 % of respondents having engaged in activity pre-COVID-19 Japanese consumers modified their out-of-home behavior for all categories except working and grocery and non-essential shopping
  • 27. McKinsey & Company 27 Main life events done in the last 12 months as a result of COVID,1 % of respondents Modified return to out-of-home | Current as of March 2022 Source: McKinsey & Company COVID-19 Japan Consumer Pulse Survey, 3/16–3/26/2022, n = 1,018; 10/18–10/20/2021, n = 1,014, sampled and weighted to match Japan general population 18+ years Change >3 pp 6 4 1 3 1 1 2 1 1 1 1 Worked more from home Renovated/remodeled my home Got a new pet at home (eg, dog, cat) Set up a specific work-from-home space Decided to change jobs Started homeschooling children Set up a gym at home Moved into a bigger home Moved into a smaller home Bought a property Sold a property Work/study change Mar 2022 Pet adoption House move Home renovation Investments/ divestments Total,2 % Change from Oct 2021, percentage points -1 -1 0 0 0 -1 0 -1 -4 -3 2 2 10 2 4 2 1. Q: Which of the following have you done in the last 12 months as a result of the COVID-19 crisis? 2. Total percentage of people who choose option(s) in the category. Fewer Japanese consumers are investing in their home environment due to COVID-19 than in October 2021
  • 28. McKinsey & Company 28 Milestones for the Japan population not yet engaging with out-of-home activities1 % of respondents awaiting each milestone before engaging 10 33 15 42 Government lifts restrictions COVID-19 no longer spreading Vaccination coverage Government lifts restrictions and other requirements 84% of people are not currently engaging in ‘normal’ out-of- home activities Vaccination coverage Government lifts restrictions and… 1. Q: Which best describes when you will regularly return to stores, restaurants, and other out-of-home activities? Chart rebased to exclude those already participating in these activities and those who do not deem any of these items important. Figures may not sum to 100% because of rounding. 13% Medical authorities deem safe 9% Stores, restaurants, and other indoor places start taking safety measures 12% I see other people returning 11% Vaccine is widely distributed 3% I have been vaccinated 1% Family member(s) vaccinated Cautious consumers cite spread of COVID-19 and government restrictions as primary reasons for not yet engaging in out-of-home activities Source: McKinsey & Company COVID-19 Japan Consumer Pulse Survey, 3/16–3/26/2022, n = 1,018, sampled and weighted to match Japan general population 18+ years Modified return to out-of-home | Current as of March 2022
  • 29. McKinsey & Company 29 26 12 11 10 7 5 New digital shopping method Different retailer/store/website Any new shopping behavior Different brand Private label/store brand New shopping method3 Divided loyalty | Current as of March 2022 Source: McKinsey & Company COVID-19 Japan Consumer Pulse Survey, 3/16–3/26/2022, n = 1,018; 10/18–10/20/2021, n = 1,014, sampled and weighted to match Japan general population 18+ years 83 −9 96 13 90 2 84 −6 High (>8M yen/year) Gen Z Millennials 33 35 37 16 88 −2 11 16 17 17 16 10 8 17 12 15 11 8 7 12 Income cut Generational cut All consumers % of respondents Change from Oct 2021, percentage points Intent to continue behavior2 Between −3 and +3 < −3 > +3 1. Q: Over the past 3 months, which of the following have you done? 74% replied “None of these.” 2. Q: Which best describes whether or not you plan to continue with these shopping changes? Possible answers: “will go back to what I did before 3 months ago”; ”will keep doing both this and what I did before 3 months ago”; ”will keep doing this and NOT go back to what I did before 3 months ago.” Intent to continue includes respondents who selected “will keep doing both this and what I did before 3 months ago” and “will keep doing this and NOT go back to what I did before 3 months ago.” 3. “New shopping method” includes curbside pickup and delivery apps. Behaviors since COVID-19 started1 % of respondents Changes in consumer behavior have been more extensive among younger and higher-income consumers Difference from all respondents, percentage points
  • 30. McKinsey & Company 30 Consumers facing a stockout of a planned purchase are most likely to not buy anything, followed by buying at different retailer Divided loyalty | Current as of March 2022 1. Q: Over the last 3 months, have you wanted to buy something and not been able to purchase it because it was out of stock or otherwise not available? 2. Q: The most recent time this happened (when you wanted to buy something and it was not available), what did you do? Source: McKinsey & Company COVID-19 Japan Consumer Pulse Survey, 3/16–3/26/2022, n = 1,018, sampled and weighted to match Japan general population 18+ years 76 24 Could not purchase at least 1 item Able to purchase all items Mar 2022 Respondents who planned to purchase something but could not, due to unavailability1 % of respondents 24 9 10 14 44 Bought the product at different retailer Bought a different product at the same retailer Bought a different brand or similar product at a different retailer Waited until product was available at the same retailer Did not buy anything All consumers who could not make a planned purchase2 % of respondents
  • 31. McKinsey & Company 31 Reason for trying a new brand since COVID-19 began1 % of respondents selecting reason in top 3 Divided loyalty | Current as of March 2022 1. Q: You mentioned you tried a new/different brand than what you normally buy. What were the main reasons that drove this decision? Select up to 3 relevant reasons. “Brand” includes different brand, new private label/store brand. Overarching reason based on % of individual respondents responding to at least 1 reason in the group. 2. Baby boomers includes silent generation. Source: McKinsey & Company COVID-19 Japan Consumer Pulse Survey, 3/16–3/26/2022, n = 1,018, sampled and weighted to match Japan general population 18+ years Supporting local businesses Better value Is available where I’m shopping (ie, in-store or online) Larger package sizes Products are in stock Better prices, promotions 21 More sustainable, better for the environment Better shipping, delivery cost Shares my values 6 The company treats its employees well 3 Cleaner, safer 37 4 2 5 3 3 3 7 19 Using recyclable packing materials Wanted to try a new brand I found Better quality Is natural/organic 5 19 Wanted to try a type of product I’ve never tried before 25 26 7 Wanted to treat myself Wanted variety/a change from my normal routine 9 Novelty Personal choice Purpose-driven Quality/organic Convenience Health/hygiene Availability 7 Value 56 14 23 42 19 3 17 Baby boomers2 Gen Z/ millennials Gen x 20 21 25 36 26 57 6 4 9 4 2 6 23 33 20 26 24 22 15 33 3 5 4 6 24 15 15 6 8 9 13 6 6 1 4 0 6 2 0 6 0 0 1 11 3 6 2 0 8 4 10 All consumers Between −3 and +3 < −3 > +3 Value was a primary reason for brand switch; novelty came next for older consumers, and convenience for younger consumers x Net % of respondents per category Difference from all respondents, percentage points 5 2 0
  • 32. McKinsey & Company 32 Out of non-daily-life categories, travel seems to be the most popular spending category for the new season Subdued holiday outlook | Current as of March 2022 1. Q: For the new season starting this spring, do you plan to spend money this year on each of the following items? 5 20 31 24 67 51 12 30 83 50 44 46 20 29 61 43 12 30 25 30 14 21 27 27 Gifts for others Clothes House-moving Furniture and home appliances Daily necessities Travel Special dinners at restaurants Luxury goods Don’t know Yes No Spending for new season starting this spring1 % of respondents who plan to spend money on each of the following items Source: McKinsey & Company COVID-19 Japan Consumer Pulse Survey, 3/16–3/26/2022, n = 1,018, sampled and weighted to match Japan general population 18+ years
  • 33. McKinsey & Company 33 Across categories, Japanese are generally willing to spend less than last year Subdued holiday outlook | Current as of March 2022 74 36 39 35 10 14 48 32 2 8 8 10 5 9 9 7 3 10 10 12 7 13 10 8 18 43 35 39 77 61 32 50 2 2 8 5 1 3 2 2 1 1 2 1 1 House-moving Luxury goods Special dinner at restaurants Furniture and home appliances Travel Daily necessities Gifts for others Clothes Won’t spend any Will spend about the same amount Will spend significantly less Will spend less Will spend more Will spend significantly more Change in spending for new season starting this spring1 % of respondents who plan to change spending vs 2021 Source: McKinsey & Company COVID-19 Japan Consumer Pulse Survey, 3/16–3/26/2022, n = 1,018, sampled and weighted to match Japan general population 18+ years 1. Q: If you compare the upcoming new season starting in this spring with the one last year, how much do you plan to change your spending level in the following categories for each of the items?
  • 34. McKinsey & Company 34 Out of non-daily-life categories, travel and special dinners at restaurants are the most popular spending categories Subdued holiday outlook | Current as of March 2022 1. Q: We would like to ask you questions about your plans for Golden Week this year. Do you plan to spend money this year on each of the following items? 4 9 19 17 40 23 6 14 83 61 55 54 36 47 69 60 13 30 27 29 24 30 25 26 Special dinners at restaurants Furniture and home appliances Gifts for others House-moving Travel Daily necessities Clothes Luxury goods Yes No Don’t know Plan to spend in Golden Week1 % of respondents who plan to spend during golden week Source: McKinsey & Company COVID-19 Japan Consumer Pulse Survey, 3/16–3/26/2022, n = 1,018, sampled and weighted to match Japan general population 18+ years
  • 35. McKinsey & Company 35 Japanese consumers are expected to spend less across all categories during this year’s Golden Week, compared with last year Subdued holiday outlook | Current as of March 2022 1. Q: If you compare the upcoming Golden Week this year with the one last year, how much do you plan to change your spending level in the following categories for each of the items? 77 55 52 45 26 36 59 51 60 2 5 5 7 6 6 5 5 5 3 6 6 7 5 8 6 6 4 17 32 30 36 62 48 28 36 26 1 1 5 4 1 2 2 2 3 1 1 1 1 1 1 2 Other special expenditure Luxury goods House-moving Travel Furniture and home appliances Special dinners at restaurants 0 Daily necessities Clothes 0 Gifts for others Won’t spend any Will spend about the same amount Will spend significantly less Will spend less Will spend more Will spend significantly more Plan to change spending from last year during Golden Week1 % of respondents who plan to change spending level Source: McKinsey & Company COVID-19 Japan Consumer Pulse Survey, 3/16–3/26/2022, n = 1,018, sampled and weighted to match Japan general population 18+ years