McKinsey Survey: Peruvian consumer sentiment during the coronavirus crisis
•
1 j'aime•2,278 vues

Peruvian consumers are most concerned about taking care of their families, public health, and the economy during the COVID-19 crisis. These exhibits are based on survey data collected in Peru from September 1–11, 2020. Check back for regular updates on Peruvian consumer sentiments, behaviors, income, spending, and expectations.

Recommandé
Recommandé
Contenu connexe
Tendances
Tendances (20)
Similaire à McKinsey Survey: Peruvian consumer sentiment during the coronavirus crisis
Similaire à McKinsey Survey: Peruvian consumer sentiment during the coronavirus crisis (17)
Plus de McKinsey on Marketing & Sales
Plus de McKinsey on Marketing & Sales (20)
Dernier
Dernier (20)
McKinsey Survey: Peruvian consumer sentiment during the coronavirus crisis
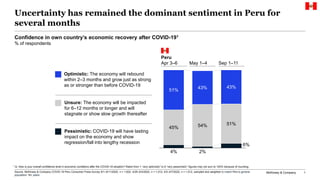
- 1. McKinsey & Company 1 Uncertainty has remained the dominant sentiment in Peru for several months 4% 2% 6% 45% 54% 51% 51% 43% 43% Confidence in own country’s economic recovery after COVID-191 % of respondents Unsure: The economy will be impacted for 6–12 months or longer and will stagnate or show slow growth thereafter Pessimistic: COVID-19 will have lasting impact on the economy and show regression/fall into lengthy recession Optimistic: The economy will rebound within 2–3 months and grow just as strong as or stronger than before COVID-19 1 Q: How is your overall confidence level in economic conditions after the COVID-19 situation? Rated from 1 “very optimistic” to 6 “very pessimistic”; figures may not sum to 100% because of rounding. Source: McKinsey & Company COVID-19 Peru Consumer Pulse Survey 9/1–9/11/2020, n = 1,002; 4/29–5/4/2020, n = 1,012; 4/3–4/7/2020, n = 1,012, sampled and weighted to match Peru’s general population 18+ years Apr 3–6 Peru May 1–4 Sep 1–11
- 2. McKinsey & Company 2 Peruvians remain attentive to their spending, though sentiment has recovered somewhat since May Overall sentiment in the general population in Peru1 % of respondents 1 Q: Please indicate how strongly you agree or disagree with each of the following statements. Please select only one response for each statement; figures may not sum to 100% because of rounding. 2 Measures difference in “strongly agree / agree” between current and last pulse survey. 28% 12% 14% 15% 9% 30% 42% 37% 34% 34% 36% 29% 19% 42% 46% 49% 51% 57% 59% 67% 78%3% 5% 4% Strongly disagree / disagree Somewhat disagree / agree Strongly agree / agree Strongly agree/ agree difference since last survey2 Source: McKinsey & Company COVID-19 Peru Consumer Pulse Survey 9/1–9/11/2020, n = 1,002; 4/29–5/4/2020, n = 1,012, sampled and weighted to match Peru’s general population 18+ years I have been personally affected by the coronavirus (COVID-19) I am very concerned about losing my job My ability to work has been reduced by coronavirus or COVID-19 My ability to make financial ends meet has been negatively impacted by coronavirus or COVID-19 My income has been negatively impacted by coronavirus or COVID-19 Uncertainty about the economy is preventing me from making purchases or investments that I would otherwise make Given the economy and my personal finances, I have to be very careful how I spend my money I am cutting back on my spending +9 -10 -11 -11 -4 -4 -4 -8
- 3. McKinsey & Company 3 Household income1,2 % of respondents Reduce slightly / reduce a lot About the same Increase slightly / increase a lot Past 2 weeks 41% 12% 6% 70% 82% 6% 23% Past 2 weeks 18% 41% Next 2 weeks 1 Q: How has the COVID-19 situation affected your (family’s) overall available income, spending, and savings in the past two weeks? Figures may not sum to 100% because of rounding. 2 Q: How do you think your overall available income, spending, and savings may change in the next two weeks? Figures may not sum to 100% because of rounding. While consumers’ personal finances have stabilized since May, most of them are still experiencing reduced income and savings Household spending1,2 % of respondents Past 2 weeks 36% 22% 43% 36% 26% 38% 25% Past 2 weeks 43% 33% Next 2 weeks May 1–4 September 1–11 May 1–4 September 1–11 Household savings1,2 % of respondents 7% Past 2 weeks 4% 16% 10% 77% 85% Past 2 weeks 18% 30% 53% Next 2 weeks May 1–4 September 1–11 Source: McKinsey & Company COVID-19 Peru Consumer Pulse Survey 9/1–9/11/2020, n = 1,002; 4/29–5/3/2020, n = 1,014, sampled and weighted to match Peru’s general population 18+ years
- 4. McKinsey & Company 4 Purchase intent remains negative across most categories, with the exception of groceries, household supplies, and personal-care products 8 40 41 37 53 46 48 79 49 60 51 22 11 10 40 60 26 11 12 19 7 16 12 11 6 8 18 20 18 11 8 Quick-service restaurant Groceries Snacks 3 Tobacco products Alcohol Food takeout & delivery Restaurant Footwear Personal-care products Apparel Jewelry Accessories Non-food child products Household supplies Skin care & makeup Furnishings & appliances Expected spending per category over the next two weeks compared to usual1 % of respondents Decrease Stay the same Increase 23 43 52 70 30 48 42 23 48 38 51 50 65 60 54 61 16 10 13 6 9 11 8 14 11 14 11 14 9 6 7 Books/magazines/newspapers Pet-care services Out-of-home entertainment Entertainment at home Consumer electronics Vehicle purchases Gasoline Fitness & wellness Travel by car Personal-care services Short-term home rentals Cruises Adventures & tours 3International flights Hotel/resort stays Domestic flights Net intent2 1 Q: Over the next two weeks, do you expect that you will spend more, about the same, or less money on these categories than usual? Figures may not sum to 100% because of rounding. 2 Net intent is calculated by subtracting the % of respondents stating they expect to decrease spending from the % of respondents stating they expect to increase spending. -7 -33 -39 -64 -21 -36 -34 -9 -37 -24 -40 -36 -57 -57 -48 -54 Net intent2 +18 -4 +9 -52 -29 -29 -18 -46 -30 -37 -76 -38 -54 -42 +8 -29 Source: McKinsey & Company COVID-19 Peru Consumer Pulse Survey 9/1–9/11/2020, n = 1,002, sampled and weighted to match Peru’s general population 18+ years
- 5. McKinsey & Company 5 Shift toward digital consumption continues to accelerate in entertainment, and in food takeout and delivery 1 Q: Over the next two weeks, where do you expect you’ll buy these categories? Tell us if you will shop in the following places more, about the same, or less in the next two weeks; please note, if you don’t buy in one of these places today and won’t in next two weeks, please select “N/A.” 2 Net intent is calculated by subtracting the % of respondents stating they expect to decrease shopping frequency from the % of respondents stating they expect to increase shopping frequency. Expected change in shopping channel per category over the next two weeks1 Axes show net intent,2 bubble size relative to share of respondents that have purchased category in last six months -40 -70 -20 -60 -25-30 -20 25-35 -50 -15 -10 -30 -10 -5 0 0 5 10 10 15 20 20 30 Groceries Jewelry Food takeout & delivery Snacks Consumer electronicsFurnishings & appliances Alcohol Household supplies (e.g., cleaning, laundry) Personal-care products (e.g., soap, shampoo) Skin care & makeup Accessories Footwear Fitness & wellness Non-food child products (e.g., diapers) Apparel Books/ magazines/ newspapers Tobacco Entertainment at home (e.g., Netflix) Household essentials Discretionary Entertainment at home In-store Online Source: McKinsey & Company COVID-19 Peru Consumer Pulse Survey 9/1–9/11/2020, n = 1,002, sampled and weighted to match Peru’s general population 18+ years
- 6. McKinsey & Company 6 Consumers expect to spend more time on work, social media and content consumption 12% 17% 14% 16% 23% 20% 26% 40% 41% 48% 38% 49% 52% 55% 54% 49% 54% 50% 38% 37% 33% 45% 39% 31% 31% 30% 28% 26% 24% 22% 22% 19% 16% Reading news online Live news Working Video content Texting, chatting, messaging Online shopping for groceries Social media Movies or shows Online shopping for non-food purchases Video games Reading for personal interest Decrease Stay the same IncreaseExpected change to time allocation over the next two weeks1 % of respondents 1 Q: Over the next two weeks, how much time do you expect to spend on these activities compared to how much time you normally spend on them? Figures may not sum to 100% because of rounding. 2 Net intent is calculated by subtracting the % of respondents stating they expect to decrease time spent from the % of respondents stating they expect to increase time spent. Net intent2 +26 +14 +16 +15 +5 +6 -3 -18 -19 -29 -22-25 Source: McKinsey & Company COVID-19 Peru Consumer Pulse Survey 9/1–9/11/2020, n = 1,002, sampled and weighted to match Peru’s general population 18+ years
- 7. McKinsey & Company 7 Have you used or done any of the following since COVID-19 started1 % of respondents 1 Q: Have you used or done any of the following since the COVID-19 situation started? If yes, Q: Which best describes when you have done or used each of these items? Possible answers: “just started using since COVID-19 started”; “using more since COVID-19 started”; “using about the same since COVID-19 started”; “using less since COVID-19 started.” Peruvians are adopting and intensifying digital habits, including online streaming, video communications, and remote learning 35% 34% 25% 31% 13% 13% 7% 23% 16% 11% 7% 18% 8% 9% 21% 22% 22% 10% 9% 7% 8% 7% 14% 4% 7% 4% Grocery delivery Restaurant delivery Wellness app Playing online games Watching e-sports Tiktok Online streaming Meal-kit delivery Video chat: personal Remote learning: my children or myself Telemedicine: physical or mental Videoconferencing: professional Online fitness Not using Just started usingUsing less / the same Using more Source: McKinsey & Company COVID-19 Peru Consumer Pulse Survey 9/1–9/11/2020, n = 1,002, sampled and weighted to match Peru’s general population 18+ years
- 8. McKinsey & Company 8 Taking care of family, safety, and health remain Peruvians’ biggest concerns 80% 78% 74% 72% 66% 65% 63% 63% 59% 54% 53% 47% 45% 41% 30% My personal health Overall public health Safety of me or my family Taking care of my family Not knowing how long it will last Health of my vulnerable relatives The Peruvian economy Contributing to spread of virus Negative impact on my job or income Not being able to get the supplies I need Negative impact on my business My mental health Not being able to make ends meet Impact on upcoming events Impact on upcoming travel plans 1 Q: What concerns you most about the COVID-19 situation? Possible answers: “not a concern”; “minimally concerned”; “somewhat concerned”; “very concerned”; “extremely concerned.” Largest concerns of the Peru’s population related to COVID-191 % of respondents who are very concerned or extremely concerned Very concerned / extremely concerned 80% of Peruvians are very/extremely concerned about taking care of their families Source: McKinsey & Company COVID-19 Peru Consumer Pulse Survey 9/1–9/11/2020, n = 1,002, sampled and weighted to match Peru’s general population 18+ years
- 9. McKinsey & Company 9 Most Peruvians expect COVID-19's personal and financial impact to persist beyond 2 more months 4–6 months 15% 24% 5% 19% 37% 0–1 month 2–3 months 7–12 months More than one year 6% 6% 18% 31% 23% 16% No impact 4–6 months 7–12 months 0–1 month More than one year 2–3 months Adjustments to routines1 % of respondents Impact on personal/household finances2 % of respondents ~95% believe it will take 2+ months before routines can return to normal, up from 92% in the last pulse survey ~88% believe their finances will be impacted for 2+ months by the COVID-19 situation, same as in the last pulse survey 1 Q: How long do you believe you need to adjust your routines, given the current COVID-19 situation, before things return back to normal in Peru (e.g., government lifts restrictions on events/travel)? Figures may not sum to 100% because of rounding. 2 Q: How long do you believe your personal/household finances will be impacted by the COVID-19 situation? Figures may not sum to 100% because of rounding. Source: McKinsey & Company COVID-19 Peru Consumer Pulse Survey 9/1–9/11/2020, n = 1,002; 4/29–5/4/2020, n = 1,012, sampled and weighted to match Peru’s general population 18+ years
- 10. McKinsey & Company 10 Disclaimer McKinsey does not provide legal, medical, or other regulated advice or guarantee results. These materials reflect general insight and best practice based on information currently available and do not contain all of the information needed to determine a future course of action. Such information has not been generated or independently verified by McKinsey and is inherently uncertain and subject to change. McKinsey has no obligation to update these materials and makes no representation or warranty and expressly disclaims any liability with respect thereto.
Notes de l'éditeur
- Removed the following: 1/ Meal kit: very low general adoption, trend mirrored those of restaurant & grocerys 2/ Fitness: Wellness App & Digital exercise machines – mirrored online personal training & fitness; in addition, had limited adoption 3/ Telemedicine – removed both physical health & mental health as total adoption low 4/ Watching online gaming – very similar to trend in "playing online gaming”