Contenu connexe
Similaire à Strategic Sourcing Charts (20)
Plus de Mekko Graphics (20)
Strategic Sourcing Charts
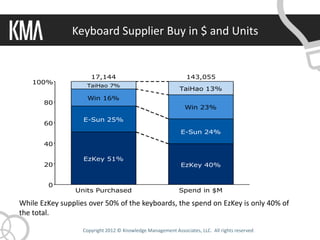
- 1. Keyboard Supplier Buy in $ and Units
17,144 143,055
100%
TaiHao 7%
TaiHao 13%
Win 16%
80
Win 23%
E-Sun 25%
60
E-Sun 24%
40
EzKey 51%
20 EzKey 40%
0
Units Purchased Spend in $M
While EzKey supplies over 50% of the keyboards, the spend on EzKey is only 40% of
the total.
Copyright 2012 © Knowledge Management Associates, LLC. All rights reserved .
- 2. Map of Supplier Sales by Product Type
Total =
$56,567M $34,722M $33,236M $18,530M $143,055M
100%
Wireless $5,657M Wireless Wireless $3,988M
$5,208M
80 Laptop $4,167M
Laptop $15,839M
Laptop Wireless
60
$17,947M $14,639M
40 Desktop
Desktop $35,072M $25,347M
20 Desktop
$11,300M Desktop
$3,891M
0
EzKey TaiHao E-Sun Win
EzKey and TaiHao focus on providing desktop keyboards. E-sun leads in providing
laptop keybaords and Win dominates the wireless segment.
Copyright 2012 © Knowledge Management Associates, LLC. All rights reserved .
- 3. Supplier Average Prices and Volume
$14.73
$11.79
$8.03
$6.47
TaiHao Win E-Sun EzKey
Volume in
1,258 2,819 4,324 8,743
M Units
The two specialty keyboard suppliers are the most expensive per unit. Switching volume
from E-Sun to the less expensive EzKey will reduce costs.
Copyright 2012 © Knowledge Management Associates, LLC. All rights reserved .
- 4. Notes
• These three charts could be used as part of a
strategic sourcing presentation.
• They can help a sourcing manager evaluate their
vendors with respect to pricing, products provided
and overall value to the firm.
• For more details see my blog post:
http://www.mekkographics.com/stratergic-sourcing-charts/
Copyright 2012 © Knowledge Management Associates, LLC. All rights reserved .