SlideShare une entreprise Scribd logo
1  sur  23
Télécharger pour lire hors ligne
BUSINESS VALUATION &
FINANCIAL ADVISORY SERVICES
VALUE FOCUS
Exploration & Production
Third Quarter 2018 // Region Focus: Bakken Shale
Q1: Eagle Ford 		
Q2: Permian Basin
Q3: Bakken Shale
Q4: Marcellus and Utica
Executive Summary 2018
www.mercercapital.com
Oil and gas prices in 2018 have been steadily increasing in the midst of strong demand and constrained supply,
and the U.S. energy sector is at the center of this focus. Forecasts from the International Energy Agency
(IEA) show that the U.S. is expected to supply almost 60% of the demand growth over the next 5 years as
conventional discoveries outside of the U.S. have hit historic lows since the early 1950s.
This quarter we take a closer look at the Bakken, where breakeven prices recently fell to around $42 per barrel.
Production activity has picked up in the region as rig counts reached heights unseen since 2015. Increased
production, lower breakeven prices, and sufficient infrastructure have led to an uptick in transaction activity
and an increase deal multiples.
Contact Us
BUSINESS VALUATION &
FINANCIAL ADVISORY SERVICES
Industry Segments
Mercer Capital serves the following industry segments:
•	 Exploration & Production
•	 Oil Field Services
•	 Midstream Operations
•	 Alternative Energy
Oil and Gas Industry Services
Mercer Capital provides business valuation and financial advisory services to
companies in the energy industry.
Services Provided
•	 Valuation of energy companies
•	 Transaction advisory for acquisitions and
divestitures
•	 Valuations for purchase accounting and
impairment testing
•	 Fairness and solvency opinions
•	 Litigation support for economic damages and
valuation and shareholder disputes
Bryce Erickson, ASA, MRICS
214.468.8400
ericksonb@mercercapital.com
Don Erickson, ASA
214.468.8400
ericksond@mercercapital.com
Taryn E. Burgess
901.322.9757
burgesst@mercercapital.com
David W. R. Harkins
901.322.9783
harkinsd@mercercapital.com
J. Michael Sousoulas, CPA
901.322.9746
sousoulasm@mercercapital.com
Learn More about Mercer Capital &
our Oil and Gas Services at
mer.cr/oilgas
Copyright © 2018 Mercer Capital Management, Inc. All rights reserved. It is illegal under Federal law to reproduce this publication or any portion of its contents without the
publisher’s permission. Media quotations with source attribution are encouraged. Reporters requesting additional information or editorial comment should contact Barbara
Walters Price at 901.685.2120. Mercer Capital’s Industry Focus is published quarterly and does not constitute legal or financial consulting advice. It is offered as an informa-
tion service to our clients and friends. Those interested in specific guidance for legal or accounting matters should seek competent professional advice. Inquiries to discuss
specific valuation matters are welcomed. To add your name to our mailing list to receive this complimentary publication, visit our web site at www.mercercapital.com.
In This Issue
E&P Industry 	
Oil and Gas Commodity Prices 1
Outlook for the Rest of 2018	 2
Region Focus: Bakken Shale	
Overview	 4
Production	 5
Valuation Implications	 8
Market Valuations 
Transaction Activity	 9
Selected Public Company Information	13
Rig Count	 17
Mercer Capital	 21
© 2018 Mercer Capital // Business Valuation  Financial Advisory Services // www.mercercapital.com 1
Mercer Capital’s Value Focus: EP Industry // Third Quarter 2018 @MercerEnergy
Oil prices started and ended the quarter in almost the same place – around $73 per barrel. However, it took
a circuitous route to get back to where it started, dropping down to $65 in mid-August and then climbing back.
West Texas has been a different story. Differentials between the standardized Cushing, Oklahoma prices and
more localized Midland prices have been climbing for much of the year and remained wide until the end of the
third quarter due in large part to capacity constraints from a lack of infrastructure in place to bring the product to
market. With production increasing without concurrent increases in the ability to transport the new production,
there has become an oversupply in the market, decreasing the price received for the region.
Natural gas prices were also volatile for the quarter, experiencing a couple of declines before peaking at $3.08
per mcf. Prices ended the quarter just above $3.00 per mcf, up from $2.92 at the end of the second quarter
and unchanged from a year ago. Natural gas prices continue to languish in comparison to the oil boom due to
capacity constraints and flaring.
$0
$1
$2
$3
$4
$5
$6
$7
$0
$20
$40
$60
$80
$100
$120
$140
9/30/13
3/31/14
9/30/14
3/31/15
9/30/15
3/31/16
9/30/16
3/31/17
9/30/17
3/31/18
9/30/18
DollarperMcf
DollarsperBarrel
WTI Brent Henry Hub
Source: Bloomberg
EP Industry
Oil and Gas
Commodity Prices
Crude Oil and Natural Gas Prices
© 2018 Mercer Capital // Business Valuation  Financial Advisory Services // www.mercercapital.com 2
Mercer Capital’s Value Focus: EP Industry // Third Quarter 2018 @MercerEnergy
Capex budgets, a harbinger of drilling plans, have continued to grow and get revised upward for many producers.
Drilling and production figures continue to climb everywhere but West Texas; however, the slowdown in West
Texas is temporary. Noting the Permian’s drilled but uncompleted well figure, the Permian’s effective inventory
is waiting to be unleashed on the market. This could be setting up strong earnings and production, though this
will only become clear as companies start reporting their results. It appears the market may be transitioning from
ascribing value on enthusiasm about potential shale production and undrilled reserves to realization of those
reserves and more real dollars to show for it.
For production to continue to increase in the U.S. though, a smooth renegotiation of NAFTA is required. In the
third quarter, a bilateral agreement with Mexico was announced with the option to add Canada, as both Congress
and Mexico previously stated they prefer. The three countries eventually came to an agreement that is largely
similar to the agreement in place, with a few distinct changes, mostly unrelated to the energy sector. This will allow
North America to continue its path to energy independence as the countries’ integrated energy markets benefit
from relatively lower import costs. However, the agreement must still be approved by each country’s legislature,
and Senate Majority Leader Mitch McConnell indicated that a vote would not be conducted until 2019, after the
November Midterm elections.
EP Industry
Outlook for the Rest of 2018
© 2018 Mercer Capital // Business Valuation  Financial Advisory Services // www.mercercapital.com 3
Mercer Capital’s Value Focus: EP Industry // Third Quarter 2018 @MercerEnergy
As a global commodity, prices will continue to be impacted by supply around the world, not just North America.
Russia and members of OPEC met in June and agreed to boost their collective output of oil production, amid
U.S. sanctions on Iran, in order to help with the global shortfall and meet increased demand. Although there
was not clear guidance on the increased output, the group has been tentatively aiming for an additional million
barrels per day. World total oil supply rose by approximately 680,000 barrels per day in July, but this was largely
contributed by the Organization for Economic Cooperation and Development, a group of non-OPEC members
that includes the U.S.
In fact, from recent figures, Russia’s increased output amounted to only 20,000 barrels a day, and Saudi crude
output actually decreased by 200,000 barrels a day. The decline in oil production in Iran and Saudi Arabia and lack-
luster production boosts from Russia are proving that any alleviation in oil prices will come later as prices continue to
rise. While the IEA agrees that the Saudis can supply over 12 million barrels a day, there is little incentive to do so as
fiscal breakeven figures for Saudi oil production provided by the IMF show nearly $88 per barrel. It appears the U.S.
will continue to shoulder the burden for supply increases.
EP Industry
Outlook for the Rest of 2018
© 2018 Mercer Capital // Business Valuation  Financial Advisory Services // www.mercercapital.com 4
Mercer Capital’s Value Focus: EP Industry // Third Quarter 2018 @MercerEnergy
Bakken Shale
Overview
The economics of oil and gas production vary by region. Mercer Capital focuses on trends in the Eagle Ford,
Permian, Bakken, and Marcellus and Utica plays. The cost of producing oil and gas depends on the geological
makeup of the reserve, depth of reserve, and cost to transport the raw crude to market. We can observe different
costs in different regions depending on these factors. This quarter we take a closer look at the Bakken Shale.
Companies that have maintained a presence in the Bakken since the downturn in oil prices are beginning to reap the
rewards of their patience. Rising oil prices have begat increases in production, and efficiencies gained in recent years
have led to higher margins and increased production. While the Permian Basin has received much of the attention
recently, the Bakken certainly appears to be back in business.
Continental Resources, Hess Corporation, and Whiting Petroleum Corporation are among the biggest players in the
region. Whiting has rebounded with its stock price up 141% in the past twelve months, and their related royalty trust,
Whiting USA Trust II, has also shown improved performance. Speaking of the decline in oil prices, Continental’s CEO
Harold Hamm said recently, “We would never have gained the efficiencies that we have today without going through
that.” This can be further illustrated by looking at breakeven prices in the Bakken, which have dropped from about $77
in September 2014 to below $39 per barrel during the third quarter of 2018, lower than those seen in Texas.
Greg Hill, President and COO of Hess, recently emphasized the importance of the Bakken in their portfolio, saying
about 43% of Hess’ capex budget would be devoted to the region over the next three years, targeting $1 billion
annually. He added that production constraints seen now in the Permian are very similar to those seen in the Bakken
a few years ago.
Bakken
Formation
North Dakota
© 2018 Mercer Capital // Business Valuation  Financial Advisory Services // www.mercercapital.com 5
Mercer Capital’s Value Focus: EP Industry // Third Quarter 2018 @MercerEnergy
Daily Production of Crude Oil
0
5,000
10,000
15,000
20,000
25,000
30,000
35,000
Sep-13
M
ar-14
Sep-14
M
ar-15
Sep-15
M
ar-16
Sep-16
M
ar-17
Sep-17
M
ar-18
Sep-18
ThousandCubicFeetperDay
Bakken Eagle Ford Permian Appalachia
Source: EIA
Bakken Shale
Production
0
500
1,000
1,500
2,000
2,500
3,000
3,500
4,000
Sep-13
M
ar-14
Sep-14
M
ar-15
Sep-15
M
ar-16
Sep-16
M
ar-17
Sep-17
M
ar-18
Sep-18
ThousandBarrelsperDay
Bakken Eagle Ford Permian Appalachia
Source: EIASource: EIA
Daily Production of Natural Gas
© 2018 Mercer Capital // Business Valuation  Financial Advisory Services // www.mercercapital.com 6
Mercer Capital’s Value Focus: EP Industry // Third Quarter 2018 @MercerEnergy
Bakken Shale
Production
According to Baker Hughes, rig counts in North America increased 0.7% in the third quarter, but increased 12.0% over the
last twelve months. The Permian Basin led the way with an increase of 26.2% in the past year, leading them to have 46.2%
of total rigs. Rig counts peaked in the Bakken in May 2018, reaching heights unseen since 2015, but the Bakken continues
to trail the Eagle Ford, Permian, and Appalachia regions. While rig counts aren’t ballooning in Bakken, this may be because
operators like Continental are focusing on completing wells that have already been drilled, a cheaper alternative to drilling
new ones.
Although oil production in the Bakken increased 17.4% in the past year, it lagged the other four regions covered as the
Permian set the pace with a 33.1% increase. Natural gas production in the Bakken increased 24.7% in that same time,
again trailing the Permian’s growth of 31.3%. Given that the Bakken only produces a little over a third as much crude oil
and a fifth of the natural gas, it will be interesting to see if the Permian can maintain its torrid pace or if capacity constraints
allow others to close the gap.
The U.S. has long trailed other countries in terms of energy production. With the leaps and bounds made in production,
the question for industry executives and investors alike is “now what?” Increased production has led to the need for better
infrastructure, a problem currently besetting the Permian Basin in particular. Extreme pricing differentials have occurred
and plenty of natural gas coming off as a byproduct of oil production is being flared as a result.
© 2018 Mercer Capital // Business Valuation  Financial Advisory Services // www.mercercapital.com 7
Mercer Capital’s Value Focus: EP Industry // Third Quarter 2018 @MercerEnergy
About 388 million cubic feet per day of natural gas was flared in June in North Dakota. Kinder Morgan, one of the largest
energy infrastructure companies has proposed a $30 million natural gas pipeline that would alleviate 130 million
cubic feet per day, with the project slated to begin construction mid-2019 and be finished by year-end, pending regulatory
approval. Pipelines have been cast by industry executives as a safer alternative to rail transportation, though critics view
this as a straw man argument. With the introduction of the Dakota Access pipeline (DAPL) in mid-2017, about half of the
regions production (470,000 barrels per day of crude oil) will travel by this pipeline. Despite the DAPL and other pipelines
like the one proposed by Kinder Morgan, rail travel will still figure heavily into the equation as refiners on the East and West
coast have low pipeline connectivity, and much of the oil from other regions ends up with one of the numerous refiners in
the Gulf of Mexico.
The Minneapolis Fed recently outlined five other projects aimed at increasing gas processing capacity, including a
$100 million expansion of a natural gas processing plant near Killdeer, North Dakota. While companies seek high
levels of production to take advantage of higher oil prices, these infrastructure constraints have a negative impact.
Continental’s CEO Harold Hamm emphasized this point saying, “Instead of just producing oil, we’re going to make
sure we produce shareholder return.”
Bakken Shale
Production
© 2018 Mercer Capital // Business Valuation  Financial Advisory Services // www.mercercapital.com 8
Mercer Capital’s Value Focus: EP Industry // Third Quarter 2018 @MercerEnergy
Price per Flowing Barrel
Bakken Shale
Valuation Implications
Before the crash in oil prices, the Bakken was booming with the highest EV/production multiples, also known as price per
flowing barrel. The Permian took center stage in 2017, but the Bakken is closing that gap.
According to Bloomberg Intelligence, breakeven prices in the Bakken finished the quarter at just under $42 per barrel.1
It trails only the Delaware Basin at $40 per barrel and compares favorably to the Midland Basin as well as both East
and West Eagle Ford. The breakeven price in the Bakken increased 9.6% in the third quarter, though is only up 3.6%
since September 2017. The West Eagle Ford saw the largest quarterly increase in breakeven price of 11.3%, while the
Delaware Basin’s breakeven price actually declined 8.1% for the quarter.
$0
$30,000
$60,000
$90,000
$120,000
$150,000
$180,000
2013 2014 2015 2016 2017 Q3 2018
Bakken Eagle Ford Permian Appalachia
Source: Bloomberg
1	
Calculations based on monthly crude oil and gas production and EIA drilling report by region.
© 2018 Mercer Capital // Business Valuation  Financial Advisory Services // www.mercercapital.com 9
Mercer Capital’s Value Focus: EP Industry // Third Quarter 2018 @MercerEnergy
Over the past year, followers of the oil and gas industry have taken note of the multitude of transactions occurring
in the Permian Basin with large deal values and hefty multiples. However, the price differential between WTI and
other benchmarks has grown over the last few months, and some attention has moved from the Permian to other
domestic shale plays. The activity in other regions such as the Bakken was at one point slow when compared to the
Permian, causing the recent increase in production and the swapping of acreage to fly under the radar while many
were focused on Texas.
Transaction activity in the Bakken in 2017 marked the departure of a number of companies that were active in
the play, such as Halcon Resources. At the end of 2017 and into 2018, the exodus from the Bakken to the Permian
continued. Recently, the Bakken is being viewed as another viable option to the Permian Basin, which has seen a
growing price differential due to insufficient infrastructure. This, and rising oil prices, has resulted in an increase in
production in the region, leading to more transaction activity and inflows of capital.
Overall, the average deal size has decreased from twelve months ago when companies sold off large bundles of
assets to clean up their balance sheets and survive in the low oil price environment. While deals today may be smaller
in size, they are more strategic in nature.
Bakken Shale
Market Valuations 
Transaction Activity
© 2018 Mercer Capital // Business Valuation  Financial Advisory Services // www.mercercapital.com 10
Mercer Capital’s Value Focus: EP Industry // Third Quarter 2018 @MercerEnergy
Transactions in the Bakken
Announced
Date Buyer Seller
Deal Value
($MM) $ / Acre $ / Boepd
8/22/18 US Energy Corp. APEG Energy LP $18 $11,125 $44,500
7/31/18 Northern Oil and Gas, Inc. W Energy Partners $100 $9,434 $14,815
7/19/18 Panhandle Oil and Gas Inc. Not Disclosed $9 $1,992 $169,811
7/18/18 Northern Oil and Gas, Inc. Pivotal Petroleum Partners, LP $152 nm $37,073
7/12/18 Petroshale Inc. Not Disclosed $55 $27,764 $100,000
6/25/18 Whiting Petroleum Corp. Oasis Petroleum Inc. $283 $4,354 $64,318
6/19/18 Not Disclosed Crescent Point Energy Corp. $280 nm $58,333
4/30/18 Comstock Resources Inc. Arkoma Drilling LP $620 nm $44,444
4/27/18 Northern Oil and Gas, Inc. Salt Creek Oil LLC $50 $37,908 $36,232
4/11/18 Vitesse Energy Llc, Vitesse Oil Llc Not Disclosed $190 $8,261 $45,238
4/4/18 Petro-Hunt LLC SM Energy Company $292 $2,342 $41,025
11/20/17 Not Disclosed Earthstone Energy Inc. $27 $4,576 $26,445
10/23/17 Valorem Energy LLC Linn Energy, Inc $285 $14,250 $35,625
9/20/17 Not Disclosed Halcon Resources Corp $104 nm $45,435
Median $128 $8,847 $44,472
Average $176 $12,201 $54,521
Source: Shale Experts
* Does not include every transaction in the Permian Basin for the last twelve months ended 9/30/2018
© 2018 Mercer Capital // Business Valuation  Financial Advisory Services // www.mercercapital.com 11
Mercer Capital’s Value Focus: EP Industry // Third Quarter 2018 @MercerEnergy
Whiting Acquires 65,000 Acres from Oasis
One of the largest deals in the region over the last twelve months was Whiting Petroleum Corp.’s purchase of 65,000
acres from Oasis Petroleum Inc. in June for $283 million. A Seeking Alpha contributor noted that this transaction
is a “case of one company believing that it can achieve better results in an area that the other company considered
lower quality acreage.” This is observed in Oasis’ acceptance of a lower than average transaction price per acre, and
Whiting’s willingness to pay an above average price per flowing barrel.
US Energy Acquires 1,600 Acres from APEG
One of the smaller deals was US Energy Corp.’s acquisition of 1,600 acres from APEG Energy LP (a related party)
for $18 million. US Energy and APEG Energy II, LP announced a strategic partnership in October 2017 in a delever-
aging transaction. APEG Energy II is one of Angelus Capital’s (a private equity firm headquartered in Austin, Texas)
funds focused on acquiring domestic oil and gas assets. Since then, US Energy has focused on cleaning up its
balance sheet to focus on producing oil assets. Recently, US Energy has been working to add assets that will imme-
diately increase production in the Williston Basin and South Texas.
US Energy expects their most recent transaction “will create additional opportunities for development and acreage
swaps that would permit the company to continue consolidating its leasehold position in the area.” US Energy paid
$44,500 per flowing barrel, which is in line with average production multiples paid in the region but is somewhat lower
than those observed last year. Deal values last year may have been based on the expectation that production would
increase in the future, inflating current multiples. Now that production has picked back up in the Bakken, deal multiples
appear to have normalized somewhat.
Bakken Shale
Market Valuations 
Transaction Activity
© 2018 Mercer Capital // Business Valuation  Financial Advisory Services // www.mercercapital.com 12
Mercer Capital’s Value Focus: EP Industry // Third Quarter 2018 @MercerEnergy
Strategic Deals Between Regional Operators
While there has been activity in the Permian dating back to the 1920s, production has increased significantly in recent
years due revolutions in shale. Somewhat ironically, the Bakken has been economical for shale oil longer than the
Permian, meaning that many of its sweetest spots have already been drilled. However, this means operators in the
Bakken have a competitive edge due to their significant experience in the region since the early 2000s. As Senior
Beck, a senior director at Statas Advisors explained, “The Bakken’s maturity and production characteristics could lead
to a growth in consolidation over the next few years.”
Acquisitions of Property by Non-Operators
Additionally, the prominence of activity of non-operators in the Bakken has increased. Private equity funds like
Angelus Capital, single-family offices, and other providers of capital that see an opportunity in the Bakken are buying
acreage and partnering with the best operators in order to realize superior returns on investment.
Combining these trends, Northern Oil and Gas Inc. is a non-operator who aims to be the Bakken’s “natural consol-
idator.” In July it completed its largest acquisition yet of 10,600 net acres for $100 million cash plus approximately
$190 million of Northern Oil stock. Northern Oil is relying upon the superior abilities of longtime regional operators and
the trend towards consolidation. However, it is also an example of a non-operator who has become more prominent
in the last year.
The Bakken may have gone unnoticed for a couple years after the downturn in oil prices in 2014, but it may be rising
back to prominence as increases in efficiency and cost reductions impress investors.
Bakken Shale
Market Valuations 
Transaction Activity
© 2018 Mercer Capital // Business Valuation  Financial Advisory Services // www.mercercapital.com 13
Mercer Capital’s Value Focus: EP Industry // Third Quarter 2018 @MercerEnergy
as of 9/12/2018
Company Name Ticker
9/12/2018
Enterprise Value
YOY % Change
in EV
EBITDAX
Margin
EV/
EBITDAX
Daily
Production
(mboe/d)
Price per Flowing
Barrel*
Global Integrated
Exxon Mobil Corp XOM $396,058 3.84% 14.4% 10.5x 3,767 $105,148
Royal Dutch Shell PLC RDS/A $337,066 30.47% 14.3% 6.8x na na
Chevron Corp CVX $253,884 0.57% 19.1% 9.3x 2,861 $88,747
Occidental Petroleum Corp OXY $66,870 23.66% 45.7% 10.2x 676 $98,973
BP PLC BP $183,228 15.43% 11.1% 6.1x 3,618 $50,643
Group Median 15.43% 14.4% 9.3x 3,239 $93,860
Global EP
Marathon Oil Corp MRO $21,391 47.54% 60.0% 6.5x 415 $51,570
Hess Corp HES $24,968 29.51% -32.7% -12.9x 260 $96,087
ConocoPhillips COP $94,944 39.44% 39.5% 7.5x 1,234 $76,965
Anadarko Petroleum Corp APC $48,196 33.67% 52.1% 8.0x 681 $70,722
Noble Energy Inc NBL $21,209 9.68% 77.0% 6.2x 343 $61,836
Apache Corp APA $25,982 10.03% 68.3% 5.8x 473 $54,877
Murphy Oil Corp MUR $7,428 22.79% 63.4% 5.2x 168 $44,225
Group Median 29.51% 60.0% 6.2x 415 $61,836
Source: Bloomberg L.P.
•	 Price per Flowing Barrel is EV/ daily production ($/boe/d)
•	 Companies included in the Guideline Group were selected from a broader guideline group, detailed here. The selected companies’ market caps exceed $1 billion and revenues exceed $500 million.
•	 Statoil (Norway’s government owned oil company) changed its name to Equinor signaling its emergence as a broad energy company, not one just focused on oil. We have removed Statoil from our guideline group as its expansion into the broader
energy market makes it less comparable to traditional EP companies.
Mercer Capital tracks the performance of Exploration and Production companies across different mineral reserves in order to understand how the current pricing envi-
ronment affects operators in each region. We created an index of seven groups to better understand performance trends across reserves and the industry. The current
pricing multiples of each company in the index are summarized below.
Appendix A
Selected Public Company Information
© 2018 Mercer Capital // Business Valuation  Financial Advisory Services // www.mercercapital.com 14
Mercer Capital’s Value Focus: EP Industry // Third Quarter 2018 @MercerEnergy
as of 9/12/2018
Company Name Ticker
9/12/2018
Enterprise Value
YOY % Change
in EV
EBITDAX
Margin
EV/
EBITDAX
Daily
Production
(mboe/d)
Price per Flowing
Barrel*
North American EP
Ultra Petroleum Corp UPL $2,420 -24.73% 63.6% 4.3x 123 $19,653
Encana Corp ECA $15,636 18.35% 34.9% 10.4x 379 $41,288
Devon Energy Corp DVN $30,785 4.26% 19.5% 11.9x 537 $57,291
Enerplus Corp ERF $3,139 30.04% 55.3% 6.9x 94 $33,448
QEP Resources Inc QEP $5,086 38.12% 32.3% 9.3x 148 $34,469
WPX Energy Inc WPX $9,818 44.39% 41.9% 15.9x 133 $73,933
EQT Corp EQT $25,311 50.47% 7.1% 88.3x 682 $37,119
Chesapeake Energy Corp CHK $15,165 0.02% 24.8% 6.3x 528 $28,696
Newfield Exploration Co NFX $7,494 7.07% 59.9% 5.9x 194 $38,651
Group Median 18.35% 34.9% 9.3x 194 $37,119
Bakken
Continental Resources Inc/OK CLR $28,922 48.13% 73.1% 9.7x 296 $97,716
Whiting Petroleum Corp WLL $7,134 46.71% -9.5% -42.7x 131 $54,630
Oasis Petroleum Inc OAS $6,847 66.22% 31.5% 14.1x 86 $79,453
Crescent Point Energy Corp CPG $6,444 -7.28% 61.0% 4.3x 173 $37,284
Group Median 47.42% 46.2% 7.0x 152 $67,042
Source: Bloomberg L.P.
•	 Price per Flowing Barrel is EV/ daily production ($/boe/d)
•	 Companies included in the Guideline Group were selected from a broader guideline group, detailed here. The selected companies’ market caps exceed $1 billion and revenues exceed $500 million.
•	 Statoil (Norway’s government owned oil company) changed its name to Equinor signaling its emergence as a broad energy company, not one just focused on oil. We have removed Statoil from our guideline group as its expansion into the broader
energy market makes it less comparable to traditional EP companies.
Appendix A
Selected Public Company Information
© 2018 Mercer Capital // Business Valuation  Financial Advisory Services // www.mercercapital.com 15
Mercer Capital’s Value Focus: EP Industry // Third Quarter 2018 @MercerEnergy
as of 9/12/2018
Company Name Ticker
9/12/2018
Enterprise Value
YOY % Change
in EV
EBITDAX
Margin
EV/
EBITDAX
Daily
Production
(mboe/d)
Price per Flowing
Barrel*
Marcellus  Utica
Range Resources Corp RRC $8,058 -2.85% 23.3% 12.6x 372 $21,688
Cabot Oil  Gas Corp COG $10,514 -20.24% 27.7% 22.0x 360 $29,192
Antero Resources Corp AR $11,761 -3.55% 29.4% 10.4x 460 $25,543
Gulfport Energy Corp GPOR $3,826 -6.15% 60.3% 4.8x 227 $16,880
Southwestern Energy Co SWN $6,506 -15.17% 38.0% 5.1x 453 $14,360
Group Median -6.15% 29.4% 10.4x 372 $21,688
Permian Basin
Concho Resources Inc CXO $30,395 57.71% 91.2% 10.8x 280 $108,600
Parsley Energy Inc PE $10,840 25.41% 72.4% 11.1x 114 $95,013
Diamondback Energy Inc FANG $14,119 34.77% 77.7% 11.1x 121 $116,822
Halcon Resources Corp HK $1,296 -36.17% 221.0% 2.4x 16 $82,806
Laredo Petroleum Inc LPI $2,856 -33.81% 48.5% 5.6x 70 $40,959
Pioneer Natural Resources Co PXD $30,067 32.83% 28.9% 13.2x 319 $94,294
Cimarex Energy Co XEC $9,580 -9.79% 61.6% 7.3x 215 $44,610
Energen Corp EGN $8,296 44.49% 64.0% 10.2x 100 $83,086
Group Median 29.12% 68.2% 10.5x 117 $88,690
Source: Bloomberg L.P.
•	 Price per Flowing Barrel is EV/ daily production ($/boe/d)
•	 Companies included in the Guideline Group were selected from a broader guideline group, detailed here. The selected companies’ market caps exceed $1 billion and revenues exceed $500 million.
•	 Statoil (Norway’s government owned oil company) changed its name to Equinor signaling its emergence as a broad energy company, not one just focused on oil. We have removed Statoil from our guideline group as its expansion into the broader
energy market makes it less comparable to traditional EP companies.
Appendix A
Selected Public Company Information
© 2018 Mercer Capital // Business Valuation  Financial Advisory Services // www.mercercapital.com 16
Mercer Capital’s Value Focus: EP Industry // Third Quarter 2018 @MercerEnergy
as of 9/12/2018
Company Name Ticker
9/12/2018
Enterprise Value
YOY % Change
in EV
EBITDAX
Margin
EV/
EBITDAX
Daily
Production
(mboe/d)
Price per Flowing
Barrel*
Eagle Ford
Carrizo Oil  Gas Inc CRZO $3,967 56.93% 68.6% 6.5x 63 $63,443
SM Energy Co SM $5,813 45.98% 65.6% 6.2x 126 $46,265
EOG Resources Inc EOG $73,158 29.66% 43.1% 11.8x 735 $99,557
Group Median 45.98% 65.6% 6.5x 126 $63,443
Overall Median 23.66% 45.7% 7.5x 288 $54,753
Source: Bloomberg L.P.
•	 Price per Flowing Barrel is EV/ daily production ($/boe/d)
•	 Companies included in the Guideline Group were selected from a broader guideline group, detailed here. The selected companies’ market caps exceed $1 billion and revenues exceed $500 million.
•	 Statoil (Norway’s government owned oil company) changed its name to Equinor signaling its emergence as a broad energy company, not one just focused on oil. We have removed Statoil from our guideline group as its expansion into the broader
energy market makes it less comparable to traditional EP companies.
Appendix A
Selected Public Company Information
© 2018 Mercer Capital // Business Valuation  Financial Advisory Services // www.mercercapital.com 17
Mercer Capital’s Value Focus: EP Industry // Third Quarter 2018 @MercerEnergy
Appendix B
Rig Count
Rig Count by Region
0
300
600
900
1,200
1,500
1,800
2,100
Sep-13
M
ar-14
Sep-14
M
ar-15
Sep-15
M
ar-16
Sep-16
M
ar-17
Sep-17
M
ar-18
Sep-18
Bakken Eagle Ford Permian Appalachia Other
Source: Baker Hughes
Baker Hughes collects and publishes information regarding active drilling rigs in the United States and internationally.
The number of active rigs is a key indicator of demand for oilfield services  equipment. Factors influencing rig counts
include energy prices, investment climate, technological changes, regulatory activity, weather, and seasonality.
The number of active rigs in the United States as of September 28, 2018, stood at 1,052, a 12.0% increase from
September 29, 2017. The increase reflects a pickup in drilling activity from the increase of oil prices to over $70/ bbl,
enabling companies to increase drilling activities.2
Activity increased in the Bakken with the number of active rigs
increasing by 6.0% to 53 rigs in September 2018.
2	
Data provided by Baker Hughes.
© 2018 Mercer Capital // Business Valuation  Financial Advisory Services // www.mercercapital.com 18
Mercer Capital’s Value Focus: EP Industry // Third Quarter 2018 @MercerEnergy
U.S. Rig Count by Oil vs. Natural Gas
0
500
1000
1500
2000
2500
Sep-13
M
ar-14
Sep-14
M
ar-15
Sep-15
M
ar-16
Sep-16
M
ar-17
Sep-17
M
ar-18
Sep-18
Oil Gas
Source: Baker Hughes
Appendix B
Rig Count
U.S. Rig Count by Trajectory
0
500
1000
1500
2000
2500
Sep-13
M
ar-14
Sep-14
M
ar-15
Sep-15
M
ar-16
Sep-16
M
ar-17
Sep-17
M
ar-18
Sep-18
Directional Horizontal Vertical
Source: Baker Hughes
© 2018 Mercer Capital // Business Valuation  Financial Advisory Services // www.mercercapital.com 19
Mercer Capital’s Value Focus: EP Industry // Third Quarter 2018 @MercerEnergy
Eagle Ford Rig Count by Oil vs. Natural Gas
Bakken Rig Count by Oil vs. Natural Gas
Permian Rig Count by Oil vs. Natural Gas
Marcellus  Utica Rig Count by Oil vs. Natural Gas
0
50
100
150
200
250
Sep-13
M
ar-14
Sep-14
M
ar-15
Sep-15
M
ar-16
Sep-16
M
ar-17
Sep-17
M
ar-18
Sep-18
Oil Gas
Source: Baker Hughes
0
50
100
150
200
250
Sep-13
M
ar-14
Sep-14
M
ar-15
Sep-15
M
ar-16
Sep-16
M
ar-17
Sep-17
M
ar-18
Sep-18
Oil Gas
Source: Baker Hughes
0
100
200
300
400
500
600
Sep-13
M
ar-14
Sep-14
M
ar-15
Sep-15
M
ar-16
Sep-16
M
ar-17
Sep-17
M
ar-18
Sep-18
Oil Gas
Source: Baker Hughes
0
20
40
60
80
100
120
140
Sep-13
M
ar-14
Sep-14
M
ar-15
Sep-15
M
ar-16
Sep-16
M
ar-17
Sep-17
M
ar-18
Sep-18
Oil Gas
Source: Baker Hughes
Appendix B
Rig Count // Oil vs. Natural Gas
© 2018 Mercer Capital // Business Valuation  Financial Advisory Services // www.mercercapital.com 20
Mercer Capital’s Value Focus: EP Industry // Third Quarter 2018 @MercerEnergy
Eagle Ford Rig Count by Trajectory
Bakken Rig Count by Trajectory
Permian Rig Count by Trajectory
Marcellus  Utica Rig Count by Trajectory
0
50
100
150
200
250
Sep-13
M
ar-14
Sep-14
M
ar-15
Sep-15
M
ar-16
Sep-16
M
ar-17
Sep-17
M
ar-18
Sep-18
Directional Horizontal Vertical
Source: Baker Hughes
0
50
100
150
200
250
Sep-13
M
ar-14
Sep-14
M
ar-15
Sep-15
M
ar-16
Sep-16
M
ar-17
Sep-17
M
ar-18
Sep-18
Directional Horizontal Vertical
Source: Baker Hughes
0
100
200
300
400
500
600
Sep-13
M
ar-14
Sep-14
M
ar-15
Sep-15
M
ar-16
Sep-16
M
ar-17
Sep-17
M
ar-18
Sep-18
Directional Horizontal Vertical
Source: Baker Hughes
0
20
40
60
80
100
120
140
Sep-13
M
ar-14
Sep-14
M
ar-15
Sep-15
M
ar-16
Sep-16
M
ar-17
Sep-17
M
ar-18
Sep-18
Directional Horizontal Vertical
Source: Baker Hughes
Appendix B
Rig Count // Trajectory
Mercer Capital
Memphis | Dallas | Nashville
www.mercercapital.com

Contenu connexe

Tendances

Mercer Capital's Value Focus: Refining | Year-End 2018
Mercer Capital's Value Focus: Refining | Year-End 2018Mercer Capital's Value Focus: Refining | Year-End 2018
Mercer Capital's Value Focus: Refining | Year-End 2018Mercer Capital
 
Mercer Capital's Value Focus: Exploration and Production | Q2 2018 | Segment:...
Mercer Capital's Value Focus: Exploration and Production | Q2 2018 | Segment:...Mercer Capital's Value Focus: Exploration and Production | Q2 2018 | Segment:...
Mercer Capital's Value Focus: Exploration and Production | Q2 2018 | Segment:...Mercer Capital
 
Mercer Capital's Value Focus: Exploration and Production | Q3 2016
Mercer Capital's Value Focus: Exploration and Production | Q3 2016Mercer Capital's Value Focus: Exploration and Production | Q3 2016
Mercer Capital's Value Focus: Exploration and Production | Q3 2016Mercer Capital
 
Quarterly analyst themes of oil and gas earnings
Quarterly analyst themes of oil and gas earningsQuarterly analyst themes of oil and gas earnings
Quarterly analyst themes of oil and gas earningsEY
 
Mercer Capital's Value Focus: Energy Industry | Q1 2021 | Region Focus: Eagle...
Mercer Capital's Value Focus: Energy Industry | Q1 2021 | Region Focus: Eagle...Mercer Capital's Value Focus: Energy Industry | Q1 2021 | Region Focus: Eagle...
Mercer Capital's Value Focus: Energy Industry | Q1 2021 | Region Focus: Eagle...Mercer Capital
 
Deloitte: Oil & Gas Mergers and Acquisitions Report – Mid-year 2016
Deloitte: Oil & Gas Mergers and Acquisitions Report – Mid-year 2016Deloitte: Oil & Gas Mergers and Acquisitions Report – Mid-year 2016
Deloitte: Oil & Gas Mergers and Acquisitions Report – Mid-year 2016Marcellus Drilling News
 
Mercer Capital's Value Focus: Energy Industry | Q4 2017 | Segment: Explorati...
Mercer Capital's Value Focus: Energy Industry | Q4 2017 | Segment:  Explorati...Mercer Capital's Value Focus: Energy Industry | Q4 2017 | Segment:  Explorati...
Mercer Capital's Value Focus: Energy Industry | Q4 2017 | Segment: Explorati...Mercer Capital
 
EY Price Point: global oil and gas market outlook
EY Price Point: global oil and gas market outlookEY Price Point: global oil and gas market outlook
EY Price Point: global oil and gas market outlookEY
 
Mercer Capital's Value Focus: Exploration and Production | Q4 2016
Mercer Capital's Value Focus: Exploration and Production | Q4 2016Mercer Capital's Value Focus: Exploration and Production | Q4 2016
Mercer Capital's Value Focus: Exploration and Production | Q4 2016Mercer Capital
 
EY Price Point: global oil and gas market outlook (Q4, October 2020)
EY Price Point: global oil and gas market outlook (Q4, October 2020)EY Price Point: global oil and gas market outlook (Q4, October 2020)
EY Price Point: global oil and gas market outlook (Q4, October 2020)EY
 
Mercer Capital's Value Focus: Exploration & Production | Q3 2017 | Region Foc...
Mercer Capital's Value Focus: Exploration & Production | Q3 2017 | Region Foc...Mercer Capital's Value Focus: Exploration & Production | Q3 2017 | Region Foc...
Mercer Capital's Value Focus: Exploration & Production | Q3 2017 | Region Foc...Mercer Capital
 
Mercer Capital's Value Focus: Exploration and Production | Q1 2016
Mercer Capital's Value Focus: Exploration and Production | Q1 2016Mercer Capital's Value Focus: Exploration and Production | Q1 2016
Mercer Capital's Value Focus: Exploration and Production | Q1 2016Mercer Capital
 
EY Price Point: global oil and gas market outlook, Q2 April 2021
EY Price Point: global oil and gas market outlook, Q2 April 2021EY Price Point: global oil and gas market outlook, Q2 April 2021
EY Price Point: global oil and gas market outlook, Q2 April 2021EY
 
Q2 – Analyst Themes of Quarterly Oil & Gas Earnings
Q2 – Analyst Themes of Quarterly Oil & Gas EarningsQ2 – Analyst Themes of Quarterly Oil & Gas Earnings
Q2 – Analyst Themes of Quarterly Oil & Gas EarningsEY
 
EY Price Point: global oil and gas market outlook, Q319
EY Price Point: global oil and gas market outlook, Q319EY Price Point: global oil and gas market outlook, Q319
EY Price Point: global oil and gas market outlook, Q319EY
 
Mercer Capital's Value Focus: Refining | 2Q16
Mercer Capital's Value Focus: Refining | 2Q16 Mercer Capital's Value Focus: Refining | 2Q16
Mercer Capital's Value Focus: Refining | 2Q16 Mercer Capital
 
EY Price Point: Global oil and gas market outlook Q4 2018
EY Price Point: Global oil and gas market outlook Q4 2018EY Price Point: Global oil and gas market outlook Q4 2018
EY Price Point: Global oil and gas market outlook Q4 2018EY
 
EY Price Point: global oil and gas market outlook
EY Price Point: global oil and gas market outlookEY Price Point: global oil and gas market outlook
EY Price Point: global oil and gas market outlookEY
 
EY Price Point: global oil and gas market outlook
EY Price Point: global oil and gas market outlookEY Price Point: global oil and gas market outlook
EY Price Point: global oil and gas market outlookEY
 

Tendances (20)

Mercer Capital's Value Focus: Refining | Year-End 2018
Mercer Capital's Value Focus: Refining | Year-End 2018Mercer Capital's Value Focus: Refining | Year-End 2018
Mercer Capital's Value Focus: Refining | Year-End 2018
 
Mercer Capital's Value Focus: Exploration and Production | Q2 2018 | Segment:...
Mercer Capital's Value Focus: Exploration and Production | Q2 2018 | Segment:...Mercer Capital's Value Focus: Exploration and Production | Q2 2018 | Segment:...
Mercer Capital's Value Focus: Exploration and Production | Q2 2018 | Segment:...
 
Mercer Capital's Value Focus: Exploration and Production | Q3 2016
Mercer Capital's Value Focus: Exploration and Production | Q3 2016Mercer Capital's Value Focus: Exploration and Production | Q3 2016
Mercer Capital's Value Focus: Exploration and Production | Q3 2016
 
Quarterly analyst themes of oil and gas earnings
Quarterly analyst themes of oil and gas earningsQuarterly analyst themes of oil and gas earnings
Quarterly analyst themes of oil and gas earnings
 
Mercer Capital's Value Focus: Energy Industry | Q1 2021 | Region Focus: Eagle...
Mercer Capital's Value Focus: Energy Industry | Q1 2021 | Region Focus: Eagle...Mercer Capital's Value Focus: Energy Industry | Q1 2021 | Region Focus: Eagle...
Mercer Capital's Value Focus: Energy Industry | Q1 2021 | Region Focus: Eagle...
 
Deloitte: Oil & Gas Mergers and Acquisitions Report – Mid-year 2016
Deloitte: Oil & Gas Mergers and Acquisitions Report – Mid-year 2016Deloitte: Oil & Gas Mergers and Acquisitions Report – Mid-year 2016
Deloitte: Oil & Gas Mergers and Acquisitions Report – Mid-year 2016
 
Mercer Capital's Value Focus: Energy Industry | Q4 2017 | Segment: Explorati...
Mercer Capital's Value Focus: Energy Industry | Q4 2017 | Segment:  Explorati...Mercer Capital's Value Focus: Energy Industry | Q4 2017 | Segment:  Explorati...
Mercer Capital's Value Focus: Energy Industry | Q4 2017 | Segment: Explorati...
 
Spotlight energy
Spotlight energySpotlight energy
Spotlight energy
 
EY Price Point: global oil and gas market outlook
EY Price Point: global oil and gas market outlookEY Price Point: global oil and gas market outlook
EY Price Point: global oil and gas market outlook
 
Mercer Capital's Value Focus: Exploration and Production | Q4 2016
Mercer Capital's Value Focus: Exploration and Production | Q4 2016Mercer Capital's Value Focus: Exploration and Production | Q4 2016
Mercer Capital's Value Focus: Exploration and Production | Q4 2016
 
EY Price Point: global oil and gas market outlook (Q4, October 2020)
EY Price Point: global oil and gas market outlook (Q4, October 2020)EY Price Point: global oil and gas market outlook (Q4, October 2020)
EY Price Point: global oil and gas market outlook (Q4, October 2020)
 
Mercer Capital's Value Focus: Exploration & Production | Q3 2017 | Region Foc...
Mercer Capital's Value Focus: Exploration & Production | Q3 2017 | Region Foc...Mercer Capital's Value Focus: Exploration & Production | Q3 2017 | Region Foc...
Mercer Capital's Value Focus: Exploration & Production | Q3 2017 | Region Foc...
 
Mercer Capital's Value Focus: Exploration and Production | Q1 2016
Mercer Capital's Value Focus: Exploration and Production | Q1 2016Mercer Capital's Value Focus: Exploration and Production | Q1 2016
Mercer Capital's Value Focus: Exploration and Production | Q1 2016
 
EY Price Point: global oil and gas market outlook, Q2 April 2021
EY Price Point: global oil and gas market outlook, Q2 April 2021EY Price Point: global oil and gas market outlook, Q2 April 2021
EY Price Point: global oil and gas market outlook, Q2 April 2021
 
Q2 – Analyst Themes of Quarterly Oil & Gas Earnings
Q2 – Analyst Themes of Quarterly Oil & Gas EarningsQ2 – Analyst Themes of Quarterly Oil & Gas Earnings
Q2 – Analyst Themes of Quarterly Oil & Gas Earnings
 
EY Price Point: global oil and gas market outlook, Q319
EY Price Point: global oil and gas market outlook, Q319EY Price Point: global oil and gas market outlook, Q319
EY Price Point: global oil and gas market outlook, Q319
 
Mercer Capital's Value Focus: Refining | 2Q16
Mercer Capital's Value Focus: Refining | 2Q16 Mercer Capital's Value Focus: Refining | 2Q16
Mercer Capital's Value Focus: Refining | 2Q16
 
EY Price Point: Global oil and gas market outlook Q4 2018
EY Price Point: Global oil and gas market outlook Q4 2018EY Price Point: Global oil and gas market outlook Q4 2018
EY Price Point: Global oil and gas market outlook Q4 2018
 
EY Price Point: global oil and gas market outlook
EY Price Point: global oil and gas market outlookEY Price Point: global oil and gas market outlook
EY Price Point: global oil and gas market outlook
 
EY Price Point: global oil and gas market outlook
EY Price Point: global oil and gas market outlookEY Price Point: global oil and gas market outlook
EY Price Point: global oil and gas market outlook
 

Similaire à Mercer Capital's Value Focus: Exploration and Production | Q3 2018 | Segment: Bakken Shale

Mercer Capital's Value Focus: Energy Industry | Q1 2018 | Segment: Explorati...
Mercer Capital's Value Focus: Energy Industry | Q1 2018 | Segment:  Explorati...Mercer Capital's Value Focus: Energy Industry | Q1 2018 | Segment:  Explorati...
Mercer Capital's Value Focus: Energy Industry | Q1 2018 | Segment: Explorati...Mercer Capital
 
Mercer Capital's Value Focus: Energy Industry | Q3 2020 | Region Focus : Bakken
Mercer Capital's Value Focus: Energy Industry | Q3 2020 | Region Focus : BakkenMercer Capital's Value Focus: Energy Industry | Q3 2020 | Region Focus : Bakken
Mercer Capital's Value Focus: Energy Industry | Q3 2020 | Region Focus : BakkenMercer Capital
 
Mercer Capital's Value Focus: Exploration and Production | Fourth Quarter 202...
Mercer Capital's Value Focus: Exploration and Production | Fourth Quarter 202...Mercer Capital's Value Focus: Exploration and Production | Fourth Quarter 202...
Mercer Capital's Value Focus: Exploration and Production | Fourth Quarter 202...Mercer Capital
 
Mercer Capital's Value Focus: Energy Industry | Q3 2019 | Region Focus: Bakken
Mercer Capital's Value Focus: Energy Industry | Q3 2019 | Region Focus: BakkenMercer Capital's Value Focus: Energy Industry | Q3 2019 | Region Focus: Bakken
Mercer Capital's Value Focus: Energy Industry | Q3 2019 | Region Focus: BakkenMercer Capital
 
Mercer Capital's Value Focus: Energy Industry | Q2 2022 | Segment: Permian
Mercer Capital's Value Focus: Energy Industry | Q2 2022 | Segment:  PermianMercer Capital's Value Focus: Energy Industry | Q2 2022 | Segment:  Permian
Mercer Capital's Value Focus: Energy Industry | Q2 2022 | Segment: PermianMercer Capital
 
Mercer Capital's Value Focus: Energy Industry | Q4 2021 | Segment: Appalachia...
Mercer Capital's Value Focus: Energy Industry | Q4 2021 | Segment: Appalachia...Mercer Capital's Value Focus: Energy Industry | Q4 2021 | Segment: Appalachia...
Mercer Capital's Value Focus: Energy Industry | Q4 2021 | Segment: Appalachia...Mercer Capital
 
Mercer Capital's Value Focus: Energy Industry | Q1 2022 | Region Focus: Eagle...
Mercer Capital's Value Focus: Energy Industry | Q1 2022 | Region Focus: Eagle...Mercer Capital's Value Focus: Energy Industry | Q1 2022 | Region Focus: Eagle...
Mercer Capital's Value Focus: Energy Industry | Q1 2022 | Region Focus: Eagle...Mercer Capital
 
Houston economy at_a_glance_vol24
Houston economy at_a_glance_vol24Houston economy at_a_glance_vol24
Houston economy at_a_glance_vol24Mandar Trivedi
 
Mercer Capital's Value Focus: Energy Industry | Q2 2021 | Segment: Explorati...
Mercer Capital's Value Focus: Energy Industry | Q2 2021 | Segment:  Explorati...Mercer Capital's Value Focus: Energy Industry | Q2 2021 | Segment:  Explorati...
Mercer Capital's Value Focus: Energy Industry | Q2 2021 | Segment: Explorati...Mercer Capital
 
Oil and Natural Gas - Canada - february 2018
Oil and Natural Gas -   Canada - february 2018Oil and Natural Gas -   Canada - february 2018
Oil and Natural Gas - Canada - february 2018paul young cpa, cga
 
Mercer Capital's Value Focus: Energy Industry | Q4 2020 | Region Focus: Appal...
Mercer Capital's Value Focus: Energy Industry | Q4 2020 | Region Focus: Appal...Mercer Capital's Value Focus: Energy Industry | Q4 2020 | Region Focus: Appal...
Mercer Capital's Value Focus: Energy Industry | Q4 2020 | Region Focus: Appal...Mercer Capital
 
Deloitte: Oil and Gas Reality Check 2014
Deloitte: Oil and Gas Reality Check 2014Deloitte: Oil and Gas Reality Check 2014
Deloitte: Oil and Gas Reality Check 2014Marcellus Drilling News
 
Oil Buyer's Guide 2013 Review
Oil Buyer's Guide 2013 ReviewOil Buyer's Guide 2013 Review
Oil Buyer's Guide 2013 ReviewBloomberg Briefs
 
Analysis of negative crude oil prices(22.04.2020)
Analysis of negative crude oil prices(22.04.2020)Analysis of negative crude oil prices(22.04.2020)
Analysis of negative crude oil prices(22.04.2020)AnhadKamal
 
NewBase 16 October 2023 Energy News issue - 1665 by Khaled Al Awadi_compres...
NewBase  16 October 2023  Energy News issue - 1665 by Khaled Al Awadi_compres...NewBase  16 October 2023  Energy News issue - 1665 by Khaled Al Awadi_compres...
NewBase 16 October 2023 Energy News issue - 1665 by Khaled Al Awadi_compres...Khaled Al Awadi
 
Don’t Blame The Speculators Alone
Don’t Blame The Speculators AloneDon’t Blame The Speculators Alone
Don’t Blame The Speculators AloneSonica Dalmia
 
New base energy news 14 may 2020 issue no. 1338 senior editor eng. khal...
New base energy news  14  may  2020   issue no. 1338  senior editor eng. khal...New base energy news  14  may  2020   issue no. 1338  senior editor eng. khal...
New base energy news 14 may 2020 issue no. 1338 senior editor eng. khal...Khaled Al Awadi
 

Similaire à Mercer Capital's Value Focus: Exploration and Production | Q3 2018 | Segment: Bakken Shale (20)

Mercer Capital's Value Focus: Energy Industry | Q1 2018 | Segment: Explorati...
Mercer Capital's Value Focus: Energy Industry | Q1 2018 | Segment:  Explorati...Mercer Capital's Value Focus: Energy Industry | Q1 2018 | Segment:  Explorati...
Mercer Capital's Value Focus: Energy Industry | Q1 2018 | Segment: Explorati...
 
Mercer Capital's Value Focus: Energy Industry | Q3 2020 | Region Focus : Bakken
Mercer Capital's Value Focus: Energy Industry | Q3 2020 | Region Focus : BakkenMercer Capital's Value Focus: Energy Industry | Q3 2020 | Region Focus : Bakken
Mercer Capital's Value Focus: Energy Industry | Q3 2020 | Region Focus : Bakken
 
Mercer Capital's Value Focus: Exploration and Production | Fourth Quarter 202...
Mercer Capital's Value Focus: Exploration and Production | Fourth Quarter 202...Mercer Capital's Value Focus: Exploration and Production | Fourth Quarter 202...
Mercer Capital's Value Focus: Exploration and Production | Fourth Quarter 202...
 
Mercer Capital's Value Focus: Energy Industry | Q3 2019 | Region Focus: Bakken
Mercer Capital's Value Focus: Energy Industry | Q3 2019 | Region Focus: BakkenMercer Capital's Value Focus: Energy Industry | Q3 2019 | Region Focus: Bakken
Mercer Capital's Value Focus: Energy Industry | Q3 2019 | Region Focus: Bakken
 
Mercer Capital's Value Focus: Energy Industry | Q2 2022 | Segment: Permian
Mercer Capital's Value Focus: Energy Industry | Q2 2022 | Segment:  PermianMercer Capital's Value Focus: Energy Industry | Q2 2022 | Segment:  Permian
Mercer Capital's Value Focus: Energy Industry | Q2 2022 | Segment: Permian
 
Mercer Capital's Value Focus: Energy Industry | Q4 2021 | Segment: Appalachia...
Mercer Capital's Value Focus: Energy Industry | Q4 2021 | Segment: Appalachia...Mercer Capital's Value Focus: Energy Industry | Q4 2021 | Segment: Appalachia...
Mercer Capital's Value Focus: Energy Industry | Q4 2021 | Segment: Appalachia...
 
Mercer Capital's Value Focus: Energy Industry | Q1 2022 | Region Focus: Eagle...
Mercer Capital's Value Focus: Energy Industry | Q1 2022 | Region Focus: Eagle...Mercer Capital's Value Focus: Energy Industry | Q1 2022 | Region Focus: Eagle...
Mercer Capital's Value Focus: Energy Industry | Q1 2022 | Region Focus: Eagle...
 
Houston economy at_a_glance_vol24
Houston economy at_a_glance_vol24Houston economy at_a_glance_vol24
Houston economy at_a_glance_vol24
 
Mercer Capital's Value Focus: Energy Industry | Q2 2021 | Segment: Explorati...
Mercer Capital's Value Focus: Energy Industry | Q2 2021 | Segment:  Explorati...Mercer Capital's Value Focus: Energy Industry | Q2 2021 | Segment:  Explorati...
Mercer Capital's Value Focus: Energy Industry | Q2 2021 | Segment: Explorati...
 
Oil and Natural Gas - Canada - february 2018
Oil and Natural Gas -   Canada - february 2018Oil and Natural Gas -   Canada - february 2018
Oil and Natural Gas - Canada - february 2018
 
Mercer Capital's Value Focus: Energy Industry | Q4 2020 | Region Focus: Appal...
Mercer Capital's Value Focus: Energy Industry | Q4 2020 | Region Focus: Appal...Mercer Capital's Value Focus: Energy Industry | Q4 2020 | Region Focus: Appal...
Mercer Capital's Value Focus: Energy Industry | Q4 2020 | Region Focus: Appal...
 
Deloitte: Oil and Gas Reality Check 2014
Deloitte: Oil and Gas Reality Check 2014Deloitte: Oil and Gas Reality Check 2014
Deloitte: Oil and Gas Reality Check 2014
 
EY Price Point
EY Price PointEY Price Point
EY Price Point
 
Oil Buyer's Guide 2013 Review
Oil Buyer's Guide 2013 ReviewOil Buyer's Guide 2013 Review
Oil Buyer's Guide 2013 Review
 
Analysis of negative crude oil prices(22.04.2020)
Analysis of negative crude oil prices(22.04.2020)Analysis of negative crude oil prices(22.04.2020)
Analysis of negative crude oil prices(22.04.2020)
 
NewBase 16 October 2023 Energy News issue - 1665 by Khaled Al Awadi_compres...
NewBase  16 October 2023  Energy News issue - 1665 by Khaled Al Awadi_compres...NewBase  16 October 2023  Energy News issue - 1665 by Khaled Al Awadi_compres...
NewBase 16 October 2023 Energy News issue - 1665 by Khaled Al Awadi_compres...
 
Don’t Blame The Speculators Alone
Don’t Blame The Speculators AloneDon’t Blame The Speculators Alone
Don’t Blame The Speculators Alone
 
Energy market - May 2018
Energy market  -  May 2018Energy market  -  May 2018
Energy market - May 2018
 
New base energy news 14 may 2020 issue no. 1338 senior editor eng. khal...
New base energy news  14  may  2020   issue no. 1338  senior editor eng. khal...New base energy news  14  may  2020   issue no. 1338  senior editor eng. khal...
New base energy news 14 may 2020 issue no. 1338 senior editor eng. khal...
 
crude oil price 2019
crude oil price 2019crude oil price 2019
crude oil price 2019
 

Plus de Mercer Capital

Mercer Capital's Bank Watch | September 2023 | The Interest Rate Environment ...
Mercer Capital's Bank Watch | September 2023 | The Interest Rate Environment ...Mercer Capital's Bank Watch | September 2023 | The Interest Rate Environment ...
Mercer Capital's Bank Watch | September 2023 | The Interest Rate Environment ...Mercer Capital
 
Mercer Capital's Investment Management Industry Newsletter | Q2 2023 | Focus:...
Mercer Capital's Investment Management Industry Newsletter | Q2 2023 | Focus:...Mercer Capital's Investment Management Industry Newsletter | Q2 2023 | Focus:...
Mercer Capital's Investment Management Industry Newsletter | Q2 2023 | Focus:...Mercer Capital
 
Mercer Capital's Bank Watch | July 2023 | Bank Impairment Testing
Mercer Capital's Bank Watch | July 2023 | Bank Impairment TestingMercer Capital's Bank Watch | July 2023 | Bank Impairment Testing
Mercer Capital's Bank Watch | July 2023 | Bank Impairment TestingMercer Capital
 
Mercer Capital's Value Focus: Transportation & Logistics | Q1 2023 |
Mercer Capital's Value Focus: Transportation & Logistics  | Q1 2023 |Mercer Capital's Value Focus: Transportation & Logistics  | Q1 2023 |
Mercer Capital's Value Focus: Transportation & Logistics | Q1 2023 |Mercer Capital
 
Mercer Capital's Value Matters™ | Issue No. 1, 2023
Mercer Capital's Value Matters™ | Issue No. 1, 2023  Mercer Capital's Value Matters™ | Issue No. 1, 2023
Mercer Capital's Value Matters™ | Issue No. 1, 2023 Mercer Capital
 
Mercer Capital - Corporate Finance in 30 Minutes Whitepaper.pdf
Mercer Capital - Corporate Finance in 30 Minutes Whitepaper.pdfMercer Capital - Corporate Finance in 30 Minutes Whitepaper.pdf
Mercer Capital - Corporate Finance in 30 Minutes Whitepaper.pdfMercer Capital
 
Mercer Capital's Bank Watch | March 2023 | “I’m Not Broke. I’m Just Not Liquid.”
Mercer Capital's Bank Watch | March 2023 | “I’m Not Broke. I’m Just Not Liquid.”Mercer Capital's Bank Watch | March 2023 | “I’m Not Broke. I’m Just Not Liquid.”
Mercer Capital's Bank Watch | March 2023 | “I’m Not Broke. I’m Just Not Liquid.”Mercer Capital
 
Mercer Capital's Middle Market Transaction Update | Spring 2023
Mercer Capital's Middle Market Transaction Update | Spring 2023Mercer Capital's Middle Market Transaction Update | Spring 2023
Mercer Capital's Middle Market Transaction Update | Spring 2023Mercer Capital
 
Mercer Capital's Bank Watch | February 2023 | Themes from Bank Director’s 202...
Mercer Capital's Bank Watch | February 2023 | Themes from Bank Director’s 202...Mercer Capital's Bank Watch | February 2023 | Themes from Bank Director’s 202...
Mercer Capital's Bank Watch | February 2023 | Themes from Bank Director’s 202...Mercer Capital
 
Mercer Capital's Investment Management Industry Newsletter | Q4 2023 | Focus:...
Mercer Capital's Investment Management Industry Newsletter | Q4 2023 | Focus:...Mercer Capital's Investment Management Industry Newsletter | Q4 2023 | Focus:...
Mercer Capital's Investment Management Industry Newsletter | Q4 2023 | Focus:...Mercer Capital
 
Mercer Capital's Middle Market Transaction Update | Winter 2022
Mercer Capital's Middle Market Transaction Update | Winter 2022Mercer Capital's Middle Market Transaction Update | Winter 2022
Mercer Capital's Middle Market Transaction Update | Winter 2022Mercer Capital
 
Mercer Capital's Bank Watch | December 2022 | Bank M&A 2022 - Turbulence
Mercer Capital's Bank Watch | December 2022 | Bank M&A 2022 - TurbulenceMercer Capital's Bank Watch | December 2022 | Bank M&A 2022 - Turbulence
Mercer Capital's Bank Watch | December 2022 | Bank M&A 2022 - TurbulenceMercer Capital
 
Mercer Capital's Value Matters™ | Issue No. 3, 2022|
Mercer Capital's Value Matters™ | Issue No. 3, 2022|Mercer Capital's Value Matters™ | Issue No. 3, 2022|
Mercer Capital's Value Matters™ | Issue No. 3, 2022|Mercer Capital
 
Mercer Capital's Value Focus: Transportation & Logistics | Q3 2022
Mercer Capital's Value Focus: Transportation & Logistics  | Q3 2022 Mercer Capital's Value Focus: Transportation & Logistics  | Q3 2022
Mercer Capital's Value Focus: Transportation & Logistics | Q3 2022 Mercer Capital
 
Mercer Capital's Bank Watch | November 2022 | Community Bank Loan Portfolios ...
Mercer Capital's Bank Watch | November 2022 | Community Bank Loan Portfolios ...Mercer Capital's Bank Watch | November 2022 | Community Bank Loan Portfolios ...
Mercer Capital's Bank Watch | November 2022 | Community Bank Loan Portfolios ...Mercer Capital
 
Mercer Capital's Investment Management Industry Newsletter | Q3 2022 | Focus:...
Mercer Capital's Investment Management Industry Newsletter | Q3 2022 | Focus:...Mercer Capital's Investment Management Industry Newsletter | Q3 2022 | Focus:...
Mercer Capital's Investment Management Industry Newsletter | Q3 2022 | Focus:...Mercer Capital
 
Mercer Capital's Investment Management Industry Newsletter | Q2 2022 | Segmen...
Mercer Capital's Investment Management Industry Newsletter | Q2 2022 | Segmen...Mercer Capital's Investment Management Industry Newsletter | Q2 2022 | Segmen...
Mercer Capital's Investment Management Industry Newsletter | Q2 2022 | Segmen...Mercer Capital
 
Mercer Capital's Bank Watch | October 2022 | How Are Tech-Forward Banks Perfo...
Mercer Capital's Bank Watch | October 2022 | How Are Tech-Forward Banks Perfo...Mercer Capital's Bank Watch | October 2022 | How Are Tech-Forward Banks Perfo...
Mercer Capital's Bank Watch | October 2022 | How Are Tech-Forward Banks Perfo...Mercer Capital
 
Mercer Capital's Value Focus: Transportation & Logistics | Q2 2022 | Feature...
Mercer Capital's Value Focus: Transportation & Logistics  | Q2 2022 | Feature...Mercer Capital's Value Focus: Transportation & Logistics  | Q2 2022 | Feature...
Mercer Capital's Value Focus: Transportation & Logistics | Q2 2022 | Feature...Mercer Capital
 
Mercer Capital's Value Focus:Medtech and Device| Q3 2022
Mercer Capital's Value Focus:Medtech and Device| Q3 2022Mercer Capital's Value Focus:Medtech and Device| Q3 2022
Mercer Capital's Value Focus:Medtech and Device| Q3 2022Mercer Capital
 

Plus de Mercer Capital (20)

Mercer Capital's Bank Watch | September 2023 | The Interest Rate Environment ...
Mercer Capital's Bank Watch | September 2023 | The Interest Rate Environment ...Mercer Capital's Bank Watch | September 2023 | The Interest Rate Environment ...
Mercer Capital's Bank Watch | September 2023 | The Interest Rate Environment ...
 
Mercer Capital's Investment Management Industry Newsletter | Q2 2023 | Focus:...
Mercer Capital's Investment Management Industry Newsletter | Q2 2023 | Focus:...Mercer Capital's Investment Management Industry Newsletter | Q2 2023 | Focus:...
Mercer Capital's Investment Management Industry Newsletter | Q2 2023 | Focus:...
 
Mercer Capital's Bank Watch | July 2023 | Bank Impairment Testing
Mercer Capital's Bank Watch | July 2023 | Bank Impairment TestingMercer Capital's Bank Watch | July 2023 | Bank Impairment Testing
Mercer Capital's Bank Watch | July 2023 | Bank Impairment Testing
 
Mercer Capital's Value Focus: Transportation & Logistics | Q1 2023 |
Mercer Capital's Value Focus: Transportation & Logistics  | Q1 2023 |Mercer Capital's Value Focus: Transportation & Logistics  | Q1 2023 |
Mercer Capital's Value Focus: Transportation & Logistics | Q1 2023 |
 
Mercer Capital's Value Matters™ | Issue No. 1, 2023
Mercer Capital's Value Matters™ | Issue No. 1, 2023  Mercer Capital's Value Matters™ | Issue No. 1, 2023
Mercer Capital's Value Matters™ | Issue No. 1, 2023
 
Mercer Capital - Corporate Finance in 30 Minutes Whitepaper.pdf
Mercer Capital - Corporate Finance in 30 Minutes Whitepaper.pdfMercer Capital - Corporate Finance in 30 Minutes Whitepaper.pdf
Mercer Capital - Corporate Finance in 30 Minutes Whitepaper.pdf
 
Mercer Capital's Bank Watch | March 2023 | “I’m Not Broke. I’m Just Not Liquid.”
Mercer Capital's Bank Watch | March 2023 | “I’m Not Broke. I’m Just Not Liquid.”Mercer Capital's Bank Watch | March 2023 | “I’m Not Broke. I’m Just Not Liquid.”
Mercer Capital's Bank Watch | March 2023 | “I’m Not Broke. I’m Just Not Liquid.”
 
Mercer Capital's Middle Market Transaction Update | Spring 2023
Mercer Capital's Middle Market Transaction Update | Spring 2023Mercer Capital's Middle Market Transaction Update | Spring 2023
Mercer Capital's Middle Market Transaction Update | Spring 2023
 
Mercer Capital's Bank Watch | February 2023 | Themes from Bank Director’s 202...
Mercer Capital's Bank Watch | February 2023 | Themes from Bank Director’s 202...Mercer Capital's Bank Watch | February 2023 | Themes from Bank Director’s 202...
Mercer Capital's Bank Watch | February 2023 | Themes from Bank Director’s 202...
 
Mercer Capital's Investment Management Industry Newsletter | Q4 2023 | Focus:...
Mercer Capital's Investment Management Industry Newsletter | Q4 2023 | Focus:...Mercer Capital's Investment Management Industry Newsletter | Q4 2023 | Focus:...
Mercer Capital's Investment Management Industry Newsletter | Q4 2023 | Focus:...
 
Mercer Capital's Middle Market Transaction Update | Winter 2022
Mercer Capital's Middle Market Transaction Update | Winter 2022Mercer Capital's Middle Market Transaction Update | Winter 2022
Mercer Capital's Middle Market Transaction Update | Winter 2022
 
Mercer Capital's Bank Watch | December 2022 | Bank M&A 2022 - Turbulence
Mercer Capital's Bank Watch | December 2022 | Bank M&A 2022 - TurbulenceMercer Capital's Bank Watch | December 2022 | Bank M&A 2022 - Turbulence
Mercer Capital's Bank Watch | December 2022 | Bank M&A 2022 - Turbulence
 
Mercer Capital's Value Matters™ | Issue No. 3, 2022|
Mercer Capital's Value Matters™ | Issue No. 3, 2022|Mercer Capital's Value Matters™ | Issue No. 3, 2022|
Mercer Capital's Value Matters™ | Issue No. 3, 2022|
 
Mercer Capital's Value Focus: Transportation & Logistics | Q3 2022
Mercer Capital's Value Focus: Transportation & Logistics  | Q3 2022 Mercer Capital's Value Focus: Transportation & Logistics  | Q3 2022
Mercer Capital's Value Focus: Transportation & Logistics | Q3 2022
 
Mercer Capital's Bank Watch | November 2022 | Community Bank Loan Portfolios ...
Mercer Capital's Bank Watch | November 2022 | Community Bank Loan Portfolios ...Mercer Capital's Bank Watch | November 2022 | Community Bank Loan Portfolios ...
Mercer Capital's Bank Watch | November 2022 | Community Bank Loan Portfolios ...
 
Mercer Capital's Investment Management Industry Newsletter | Q3 2022 | Focus:...
Mercer Capital's Investment Management Industry Newsletter | Q3 2022 | Focus:...Mercer Capital's Investment Management Industry Newsletter | Q3 2022 | Focus:...
Mercer Capital's Investment Management Industry Newsletter | Q3 2022 | Focus:...
 
Mercer Capital's Investment Management Industry Newsletter | Q2 2022 | Segmen...
Mercer Capital's Investment Management Industry Newsletter | Q2 2022 | Segmen...Mercer Capital's Investment Management Industry Newsletter | Q2 2022 | Segmen...
Mercer Capital's Investment Management Industry Newsletter | Q2 2022 | Segmen...
 
Mercer Capital's Bank Watch | October 2022 | How Are Tech-Forward Banks Perfo...
Mercer Capital's Bank Watch | October 2022 | How Are Tech-Forward Banks Perfo...Mercer Capital's Bank Watch | October 2022 | How Are Tech-Forward Banks Perfo...
Mercer Capital's Bank Watch | October 2022 | How Are Tech-Forward Banks Perfo...
 
Mercer Capital's Value Focus: Transportation & Logistics | Q2 2022 | Feature...
Mercer Capital's Value Focus: Transportation & Logistics  | Q2 2022 | Feature...Mercer Capital's Value Focus: Transportation & Logistics  | Q2 2022 | Feature...
Mercer Capital's Value Focus: Transportation & Logistics | Q2 2022 | Feature...
 
Mercer Capital's Value Focus:Medtech and Device| Q3 2022
Mercer Capital's Value Focus:Medtech and Device| Q3 2022Mercer Capital's Value Focus:Medtech and Device| Q3 2022
Mercer Capital's Value Focus:Medtech and Device| Q3 2022
 

Dernier

(办理学位证)加拿大萨省大学毕业证成绩单原版一比一
(办理学位证)加拿大萨省大学毕业证成绩单原版一比一(办理学位证)加拿大萨省大学毕业证成绩单原版一比一
(办理学位证)加拿大萨省大学毕业证成绩单原版一比一S SDS
 
Current Economic situation of Pakistan .pptx
Current Economic situation of Pakistan .pptxCurrent Economic situation of Pakistan .pptx
Current Economic situation of Pakistan .pptxuzma244191
 
Call Girls Near Me WhatsApp:+91-9833363713
Call Girls Near Me WhatsApp:+91-9833363713Call Girls Near Me WhatsApp:+91-9833363713
Call Girls Near Me WhatsApp:+91-9833363713Sonam Pathan
 
Authentic No 1 Amil Baba In Pakistan Authentic No 1 Amil Baba In Karachi No 1...
Authentic No 1 Amil Baba In Pakistan Authentic No 1 Amil Baba In Karachi No 1...Authentic No 1 Amil Baba In Pakistan Authentic No 1 Amil Baba In Karachi No 1...
Authentic No 1 Amil Baba In Pakistan Authentic No 1 Amil Baba In Karachi No 1...First NO1 World Amil baba in Faisalabad
 
Stock Market Brief Deck for "this does not happen often".pdf
Stock Market Brief Deck for "this does not happen often".pdfStock Market Brief Deck for "this does not happen often".pdf
Stock Market Brief Deck for "this does not happen often".pdfMichael Silva
 
(办理学位证)美国加州州立大学东湾分校毕业证成绩单原版一比一
(办理学位证)美国加州州立大学东湾分校毕业证成绩单原版一比一(办理学位证)美国加州州立大学东湾分校毕业证成绩单原版一比一
(办理学位证)美国加州州立大学东湾分校毕业证成绩单原版一比一S SDS
 
government_intervention_in_business_ownership[1].pdf
government_intervention_in_business_ownership[1].pdfgovernment_intervention_in_business_ownership[1].pdf
government_intervention_in_business_ownership[1].pdfshaunmashale756
 
The AES Investment Code - the go-to counsel for the most well-informed, wise...
The AES Investment Code -  the go-to counsel for the most well-informed, wise...The AES Investment Code -  the go-to counsel for the most well-informed, wise...
The AES Investment Code - the go-to counsel for the most well-informed, wise...AES International
 
Classical Theory of Macroeconomics by Adam Smith
Classical Theory of Macroeconomics by Adam SmithClassical Theory of Macroeconomics by Adam Smith
Classical Theory of Macroeconomics by Adam SmithAdamYassin2
 
NO1 WorldWide online istikhara for love marriage vashikaran specialist love p...
NO1 WorldWide online istikhara for love marriage vashikaran specialist love p...NO1 WorldWide online istikhara for love marriage vashikaran specialist love p...
NO1 WorldWide online istikhara for love marriage vashikaran specialist love p...Amil Baba Dawood bangali
 
(办理原版一样)QUT毕业证昆士兰科技大学毕业证学位证留信学历认证成绩单补办
(办理原版一样)QUT毕业证昆士兰科技大学毕业证学位证留信学历认证成绩单补办(办理原版一样)QUT毕业证昆士兰科技大学毕业证学位证留信学历认证成绩单补办
(办理原版一样)QUT毕业证昆士兰科技大学毕业证学位证留信学历认证成绩单补办fqiuho152
 
Managing Finances in a Small Business (yes).pdf
Managing Finances  in a Small Business (yes).pdfManaging Finances  in a Small Business (yes).pdf
Managing Finances in a Small Business (yes).pdfmar yame
 
call girls in Nand Nagri (DELHI) 🔝 >༒9953330565🔝 genuine Escort Service 🔝✔️✔️
call girls in  Nand Nagri (DELHI) 🔝 >༒9953330565🔝 genuine Escort Service 🔝✔️✔️call girls in  Nand Nagri (DELHI) 🔝 >༒9953330565🔝 genuine Escort Service 🔝✔️✔️
call girls in Nand Nagri (DELHI) 🔝 >༒9953330565🔝 genuine Escort Service 🔝✔️✔️9953056974 Low Rate Call Girls In Saket, Delhi NCR
 
Economic Risk Factor Update: April 2024 [SlideShare]
Economic Risk Factor Update: April 2024 [SlideShare]Economic Risk Factor Update: April 2024 [SlideShare]
Economic Risk Factor Update: April 2024 [SlideShare]Commonwealth
 
NO1 Certified Ilam kala Jadu Specialist Expert In Bahawalpur, Sargodha, Sialk...
NO1 Certified Ilam kala Jadu Specialist Expert In Bahawalpur, Sargodha, Sialk...NO1 Certified Ilam kala Jadu Specialist Expert In Bahawalpur, Sargodha, Sialk...
NO1 Certified Ilam kala Jadu Specialist Expert In Bahawalpur, Sargodha, Sialk...Amil Baba Dawood bangali
 
Governor Olli Rehn: Dialling back monetary restraint
Governor Olli Rehn: Dialling back monetary restraintGovernor Olli Rehn: Dialling back monetary restraint
Governor Olli Rehn: Dialling back monetary restraintSuomen Pankki
 
letter-from-the-chair-to-the-fca-relating-to-british-steel-pensions-scheme-15...
letter-from-the-chair-to-the-fca-relating-to-british-steel-pensions-scheme-15...letter-from-the-chair-to-the-fca-relating-to-british-steel-pensions-scheme-15...
letter-from-the-chair-to-the-fca-relating-to-british-steel-pensions-scheme-15...Henry Tapper
 
212MTAMount Durham University Bachelor's Diploma in Technology
212MTAMount Durham University Bachelor's Diploma in Technology212MTAMount Durham University Bachelor's Diploma in Technology
212MTAMount Durham University Bachelor's Diploma in Technologyz xss
 

Dernier (20)

🔝+919953056974 🔝young Delhi Escort service Pusa Road
🔝+919953056974 🔝young Delhi Escort service Pusa Road🔝+919953056974 🔝young Delhi Escort service Pusa Road
🔝+919953056974 🔝young Delhi Escort service Pusa Road
 
(办理学位证)加拿大萨省大学毕业证成绩单原版一比一
(办理学位证)加拿大萨省大学毕业证成绩单原版一比一(办理学位证)加拿大萨省大学毕业证成绩单原版一比一
(办理学位证)加拿大萨省大学毕业证成绩单原版一比一
 
Current Economic situation of Pakistan .pptx
Current Economic situation of Pakistan .pptxCurrent Economic situation of Pakistan .pptx
Current Economic situation of Pakistan .pptx
 
Call Girls Near Me WhatsApp:+91-9833363713
Call Girls Near Me WhatsApp:+91-9833363713Call Girls Near Me WhatsApp:+91-9833363713
Call Girls Near Me WhatsApp:+91-9833363713
 
Authentic No 1 Amil Baba In Pakistan Authentic No 1 Amil Baba In Karachi No 1...
Authentic No 1 Amil Baba In Pakistan Authentic No 1 Amil Baba In Karachi No 1...Authentic No 1 Amil Baba In Pakistan Authentic No 1 Amil Baba In Karachi No 1...
Authentic No 1 Amil Baba In Pakistan Authentic No 1 Amil Baba In Karachi No 1...
 
Stock Market Brief Deck for "this does not happen often".pdf
Stock Market Brief Deck for "this does not happen often".pdfStock Market Brief Deck for "this does not happen often".pdf
Stock Market Brief Deck for "this does not happen often".pdf
 
(办理学位证)美国加州州立大学东湾分校毕业证成绩单原版一比一
(办理学位证)美国加州州立大学东湾分校毕业证成绩单原版一比一(办理学位证)美国加州州立大学东湾分校毕业证成绩单原版一比一
(办理学位证)美国加州州立大学东湾分校毕业证成绩单原版一比一
 
government_intervention_in_business_ownership[1].pdf
government_intervention_in_business_ownership[1].pdfgovernment_intervention_in_business_ownership[1].pdf
government_intervention_in_business_ownership[1].pdf
 
The AES Investment Code - the go-to counsel for the most well-informed, wise...
The AES Investment Code -  the go-to counsel for the most well-informed, wise...The AES Investment Code -  the go-to counsel for the most well-informed, wise...
The AES Investment Code - the go-to counsel for the most well-informed, wise...
 
Classical Theory of Macroeconomics by Adam Smith
Classical Theory of Macroeconomics by Adam SmithClassical Theory of Macroeconomics by Adam Smith
Classical Theory of Macroeconomics by Adam Smith
 
Q1 2024 Newsletter | Financial Synergies Wealth Advisors
Q1 2024 Newsletter | Financial Synergies Wealth AdvisorsQ1 2024 Newsletter | Financial Synergies Wealth Advisors
Q1 2024 Newsletter | Financial Synergies Wealth Advisors
 
NO1 WorldWide online istikhara for love marriage vashikaran specialist love p...
NO1 WorldWide online istikhara for love marriage vashikaran specialist love p...NO1 WorldWide online istikhara for love marriage vashikaran specialist love p...
NO1 WorldWide online istikhara for love marriage vashikaran specialist love p...
 
(办理原版一样)QUT毕业证昆士兰科技大学毕业证学位证留信学历认证成绩单补办
(办理原版一样)QUT毕业证昆士兰科技大学毕业证学位证留信学历认证成绩单补办(办理原版一样)QUT毕业证昆士兰科技大学毕业证学位证留信学历认证成绩单补办
(办理原版一样)QUT毕业证昆士兰科技大学毕业证学位证留信学历认证成绩单补办
 
Managing Finances in a Small Business (yes).pdf
Managing Finances  in a Small Business (yes).pdfManaging Finances  in a Small Business (yes).pdf
Managing Finances in a Small Business (yes).pdf
 
call girls in Nand Nagri (DELHI) 🔝 >༒9953330565🔝 genuine Escort Service 🔝✔️✔️
call girls in  Nand Nagri (DELHI) 🔝 >༒9953330565🔝 genuine Escort Service 🔝✔️✔️call girls in  Nand Nagri (DELHI) 🔝 >༒9953330565🔝 genuine Escort Service 🔝✔️✔️
call girls in Nand Nagri (DELHI) 🔝 >༒9953330565🔝 genuine Escort Service 🔝✔️✔️
 
Economic Risk Factor Update: April 2024 [SlideShare]
Economic Risk Factor Update: April 2024 [SlideShare]Economic Risk Factor Update: April 2024 [SlideShare]
Economic Risk Factor Update: April 2024 [SlideShare]
 
NO1 Certified Ilam kala Jadu Specialist Expert In Bahawalpur, Sargodha, Sialk...
NO1 Certified Ilam kala Jadu Specialist Expert In Bahawalpur, Sargodha, Sialk...NO1 Certified Ilam kala Jadu Specialist Expert In Bahawalpur, Sargodha, Sialk...
NO1 Certified Ilam kala Jadu Specialist Expert In Bahawalpur, Sargodha, Sialk...
 
Governor Olli Rehn: Dialling back monetary restraint
Governor Olli Rehn: Dialling back monetary restraintGovernor Olli Rehn: Dialling back monetary restraint
Governor Olli Rehn: Dialling back monetary restraint
 
letter-from-the-chair-to-the-fca-relating-to-british-steel-pensions-scheme-15...
letter-from-the-chair-to-the-fca-relating-to-british-steel-pensions-scheme-15...letter-from-the-chair-to-the-fca-relating-to-british-steel-pensions-scheme-15...
letter-from-the-chair-to-the-fca-relating-to-british-steel-pensions-scheme-15...
 
212MTAMount Durham University Bachelor's Diploma in Technology
212MTAMount Durham University Bachelor's Diploma in Technology212MTAMount Durham University Bachelor's Diploma in Technology
212MTAMount Durham University Bachelor's Diploma in Technology
 

Mercer Capital's Value Focus: Exploration and Production | Q3 2018 | Segment: Bakken Shale

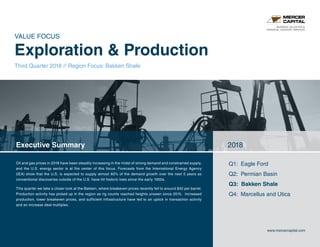
  • 1. BUSINESS VALUATION & FINANCIAL ADVISORY SERVICES VALUE FOCUS Exploration & Production Third Quarter 2018 // Region Focus: Bakken Shale Q1: Eagle Ford Q2: Permian Basin Q3: Bakken Shale Q4: Marcellus and Utica Executive Summary 2018 www.mercercapital.com Oil and gas prices in 2018 have been steadily increasing in the midst of strong demand and constrained supply, and the U.S. energy sector is at the center of this focus. Forecasts from the International Energy Agency (IEA) show that the U.S. is expected to supply almost 60% of the demand growth over the next 5 years as conventional discoveries outside of the U.S. have hit historic lows since the early 1950s. This quarter we take a closer look at the Bakken, where breakeven prices recently fell to around $42 per barrel. Production activity has picked up in the region as rig counts reached heights unseen since 2015. Increased production, lower breakeven prices, and sufficient infrastructure have led to an uptick in transaction activity and an increase deal multiples.
  • 2. Contact Us BUSINESS VALUATION & FINANCIAL ADVISORY SERVICES Industry Segments Mercer Capital serves the following industry segments: • Exploration & Production • Oil Field Services • Midstream Operations • Alternative Energy Oil and Gas Industry Services Mercer Capital provides business valuation and financial advisory services to companies in the energy industry. Services Provided • Valuation of energy companies • Transaction advisory for acquisitions and divestitures • Valuations for purchase accounting and impairment testing • Fairness and solvency opinions • Litigation support for economic damages and valuation and shareholder disputes Bryce Erickson, ASA, MRICS 214.468.8400 ericksonb@mercercapital.com Don Erickson, ASA 214.468.8400 ericksond@mercercapital.com Taryn E. Burgess 901.322.9757 burgesst@mercercapital.com David W. R. Harkins 901.322.9783 harkinsd@mercercapital.com J. Michael Sousoulas, CPA 901.322.9746 sousoulasm@mercercapital.com Learn More about Mercer Capital & our Oil and Gas Services at mer.cr/oilgas Copyright © 2018 Mercer Capital Management, Inc. All rights reserved. It is illegal under Federal law to reproduce this publication or any portion of its contents without the publisher’s permission. Media quotations with source attribution are encouraged. Reporters requesting additional information or editorial comment should contact Barbara Walters Price at 901.685.2120. Mercer Capital’s Industry Focus is published quarterly and does not constitute legal or financial consulting advice. It is offered as an informa- tion service to our clients and friends. Those interested in specific guidance for legal or accounting matters should seek competent professional advice. Inquiries to discuss specific valuation matters are welcomed. To add your name to our mailing list to receive this complimentary publication, visit our web site at www.mercercapital.com. In This Issue E&P Industry Oil and Gas Commodity Prices 1 Outlook for the Rest of 2018 2 Region Focus: Bakken Shale Overview 4 Production 5 Valuation Implications 8 Market Valuations Transaction Activity 9 Selected Public Company Information 13 Rig Count 17 Mercer Capital 21
  • 3. © 2018 Mercer Capital // Business Valuation Financial Advisory Services // www.mercercapital.com 1 Mercer Capital’s Value Focus: EP Industry // Third Quarter 2018 @MercerEnergy Oil prices started and ended the quarter in almost the same place – around $73 per barrel. However, it took a circuitous route to get back to where it started, dropping down to $65 in mid-August and then climbing back. West Texas has been a different story. Differentials between the standardized Cushing, Oklahoma prices and more localized Midland prices have been climbing for much of the year and remained wide until the end of the third quarter due in large part to capacity constraints from a lack of infrastructure in place to bring the product to market. With production increasing without concurrent increases in the ability to transport the new production, there has become an oversupply in the market, decreasing the price received for the region. Natural gas prices were also volatile for the quarter, experiencing a couple of declines before peaking at $3.08 per mcf. Prices ended the quarter just above $3.00 per mcf, up from $2.92 at the end of the second quarter and unchanged from a year ago. Natural gas prices continue to languish in comparison to the oil boom due to capacity constraints and flaring. $0 $1 $2 $3 $4 $5 $6 $7 $0 $20 $40 $60 $80 $100 $120 $140 9/30/13 3/31/14 9/30/14 3/31/15 9/30/15 3/31/16 9/30/16 3/31/17 9/30/17 3/31/18 9/30/18 DollarperMcf DollarsperBarrel WTI Brent Henry Hub Source: Bloomberg EP Industry Oil and Gas Commodity Prices Crude Oil and Natural Gas Prices
  • 4. © 2018 Mercer Capital // Business Valuation Financial Advisory Services // www.mercercapital.com 2 Mercer Capital’s Value Focus: EP Industry // Third Quarter 2018 @MercerEnergy Capex budgets, a harbinger of drilling plans, have continued to grow and get revised upward for many producers. Drilling and production figures continue to climb everywhere but West Texas; however, the slowdown in West Texas is temporary. Noting the Permian’s drilled but uncompleted well figure, the Permian’s effective inventory is waiting to be unleashed on the market. This could be setting up strong earnings and production, though this will only become clear as companies start reporting their results. It appears the market may be transitioning from ascribing value on enthusiasm about potential shale production and undrilled reserves to realization of those reserves and more real dollars to show for it. For production to continue to increase in the U.S. though, a smooth renegotiation of NAFTA is required. In the third quarter, a bilateral agreement with Mexico was announced with the option to add Canada, as both Congress and Mexico previously stated they prefer. The three countries eventually came to an agreement that is largely similar to the agreement in place, with a few distinct changes, mostly unrelated to the energy sector. This will allow North America to continue its path to energy independence as the countries’ integrated energy markets benefit from relatively lower import costs. However, the agreement must still be approved by each country’s legislature, and Senate Majority Leader Mitch McConnell indicated that a vote would not be conducted until 2019, after the November Midterm elections. EP Industry Outlook for the Rest of 2018
  • 5. © 2018 Mercer Capital // Business Valuation Financial Advisory Services // www.mercercapital.com 3 Mercer Capital’s Value Focus: EP Industry // Third Quarter 2018 @MercerEnergy As a global commodity, prices will continue to be impacted by supply around the world, not just North America. Russia and members of OPEC met in June and agreed to boost their collective output of oil production, amid U.S. sanctions on Iran, in order to help with the global shortfall and meet increased demand. Although there was not clear guidance on the increased output, the group has been tentatively aiming for an additional million barrels per day. World total oil supply rose by approximately 680,000 barrels per day in July, but this was largely contributed by the Organization for Economic Cooperation and Development, a group of non-OPEC members that includes the U.S. In fact, from recent figures, Russia’s increased output amounted to only 20,000 barrels a day, and Saudi crude output actually decreased by 200,000 barrels a day. The decline in oil production in Iran and Saudi Arabia and lack- luster production boosts from Russia are proving that any alleviation in oil prices will come later as prices continue to rise. While the IEA agrees that the Saudis can supply over 12 million barrels a day, there is little incentive to do so as fiscal breakeven figures for Saudi oil production provided by the IMF show nearly $88 per barrel. It appears the U.S. will continue to shoulder the burden for supply increases. EP Industry Outlook for the Rest of 2018
  • 6. © 2018 Mercer Capital // Business Valuation Financial Advisory Services // www.mercercapital.com 4 Mercer Capital’s Value Focus: EP Industry // Third Quarter 2018 @MercerEnergy Bakken Shale Overview The economics of oil and gas production vary by region. Mercer Capital focuses on trends in the Eagle Ford, Permian, Bakken, and Marcellus and Utica plays. The cost of producing oil and gas depends on the geological makeup of the reserve, depth of reserve, and cost to transport the raw crude to market. We can observe different costs in different regions depending on these factors. This quarter we take a closer look at the Bakken Shale. Companies that have maintained a presence in the Bakken since the downturn in oil prices are beginning to reap the rewards of their patience. Rising oil prices have begat increases in production, and efficiencies gained in recent years have led to higher margins and increased production. While the Permian Basin has received much of the attention recently, the Bakken certainly appears to be back in business. Continental Resources, Hess Corporation, and Whiting Petroleum Corporation are among the biggest players in the region. Whiting has rebounded with its stock price up 141% in the past twelve months, and their related royalty trust, Whiting USA Trust II, has also shown improved performance. Speaking of the decline in oil prices, Continental’s CEO Harold Hamm said recently, “We would never have gained the efficiencies that we have today without going through that.” This can be further illustrated by looking at breakeven prices in the Bakken, which have dropped from about $77 in September 2014 to below $39 per barrel during the third quarter of 2018, lower than those seen in Texas. Greg Hill, President and COO of Hess, recently emphasized the importance of the Bakken in their portfolio, saying about 43% of Hess’ capex budget would be devoted to the region over the next three years, targeting $1 billion annually. He added that production constraints seen now in the Permian are very similar to those seen in the Bakken a few years ago. Bakken Formation North Dakota
  • 7. © 2018 Mercer Capital // Business Valuation Financial Advisory Services // www.mercercapital.com 5 Mercer Capital’s Value Focus: EP Industry // Third Quarter 2018 @MercerEnergy Daily Production of Crude Oil 0 5,000 10,000 15,000 20,000 25,000 30,000 35,000 Sep-13 M ar-14 Sep-14 M ar-15 Sep-15 M ar-16 Sep-16 M ar-17 Sep-17 M ar-18 Sep-18 ThousandCubicFeetperDay Bakken Eagle Ford Permian Appalachia Source: EIA Bakken Shale Production 0 500 1,000 1,500 2,000 2,500 3,000 3,500 4,000 Sep-13 M ar-14 Sep-14 M ar-15 Sep-15 M ar-16 Sep-16 M ar-17 Sep-17 M ar-18 Sep-18 ThousandBarrelsperDay Bakken Eagle Ford Permian Appalachia Source: EIASource: EIA Daily Production of Natural Gas
  • 8. © 2018 Mercer Capital // Business Valuation Financial Advisory Services // www.mercercapital.com 6 Mercer Capital’s Value Focus: EP Industry // Third Quarter 2018 @MercerEnergy Bakken Shale Production According to Baker Hughes, rig counts in North America increased 0.7% in the third quarter, but increased 12.0% over the last twelve months. The Permian Basin led the way with an increase of 26.2% in the past year, leading them to have 46.2% of total rigs. Rig counts peaked in the Bakken in May 2018, reaching heights unseen since 2015, but the Bakken continues to trail the Eagle Ford, Permian, and Appalachia regions. While rig counts aren’t ballooning in Bakken, this may be because operators like Continental are focusing on completing wells that have already been drilled, a cheaper alternative to drilling new ones. Although oil production in the Bakken increased 17.4% in the past year, it lagged the other four regions covered as the Permian set the pace with a 33.1% increase. Natural gas production in the Bakken increased 24.7% in that same time, again trailing the Permian’s growth of 31.3%. Given that the Bakken only produces a little over a third as much crude oil and a fifth of the natural gas, it will be interesting to see if the Permian can maintain its torrid pace or if capacity constraints allow others to close the gap. The U.S. has long trailed other countries in terms of energy production. With the leaps and bounds made in production, the question for industry executives and investors alike is “now what?” Increased production has led to the need for better infrastructure, a problem currently besetting the Permian Basin in particular. Extreme pricing differentials have occurred and plenty of natural gas coming off as a byproduct of oil production is being flared as a result.
  • 9. © 2018 Mercer Capital // Business Valuation Financial Advisory Services // www.mercercapital.com 7 Mercer Capital’s Value Focus: EP Industry // Third Quarter 2018 @MercerEnergy About 388 million cubic feet per day of natural gas was flared in June in North Dakota. Kinder Morgan, one of the largest energy infrastructure companies has proposed a $30 million natural gas pipeline that would alleviate 130 million cubic feet per day, with the project slated to begin construction mid-2019 and be finished by year-end, pending regulatory approval. Pipelines have been cast by industry executives as a safer alternative to rail transportation, though critics view this as a straw man argument. With the introduction of the Dakota Access pipeline (DAPL) in mid-2017, about half of the regions production (470,000 barrels per day of crude oil) will travel by this pipeline. Despite the DAPL and other pipelines like the one proposed by Kinder Morgan, rail travel will still figure heavily into the equation as refiners on the East and West coast have low pipeline connectivity, and much of the oil from other regions ends up with one of the numerous refiners in the Gulf of Mexico. The Minneapolis Fed recently outlined five other projects aimed at increasing gas processing capacity, including a $100 million expansion of a natural gas processing plant near Killdeer, North Dakota. While companies seek high levels of production to take advantage of higher oil prices, these infrastructure constraints have a negative impact. Continental’s CEO Harold Hamm emphasized this point saying, “Instead of just producing oil, we’re going to make sure we produce shareholder return.” Bakken Shale Production
  • 10. © 2018 Mercer Capital // Business Valuation Financial Advisory Services // www.mercercapital.com 8 Mercer Capital’s Value Focus: EP Industry // Third Quarter 2018 @MercerEnergy Price per Flowing Barrel Bakken Shale Valuation Implications Before the crash in oil prices, the Bakken was booming with the highest EV/production multiples, also known as price per flowing barrel. The Permian took center stage in 2017, but the Bakken is closing that gap. According to Bloomberg Intelligence, breakeven prices in the Bakken finished the quarter at just under $42 per barrel.1 It trails only the Delaware Basin at $40 per barrel and compares favorably to the Midland Basin as well as both East and West Eagle Ford. The breakeven price in the Bakken increased 9.6% in the third quarter, though is only up 3.6% since September 2017. The West Eagle Ford saw the largest quarterly increase in breakeven price of 11.3%, while the Delaware Basin’s breakeven price actually declined 8.1% for the quarter. $0 $30,000 $60,000 $90,000 $120,000 $150,000 $180,000 2013 2014 2015 2016 2017 Q3 2018 Bakken Eagle Ford Permian Appalachia Source: Bloomberg 1 Calculations based on monthly crude oil and gas production and EIA drilling report by region.
  • 11. © 2018 Mercer Capital // Business Valuation Financial Advisory Services // www.mercercapital.com 9 Mercer Capital’s Value Focus: EP Industry // Third Quarter 2018 @MercerEnergy Over the past year, followers of the oil and gas industry have taken note of the multitude of transactions occurring in the Permian Basin with large deal values and hefty multiples. However, the price differential between WTI and other benchmarks has grown over the last few months, and some attention has moved from the Permian to other domestic shale plays. The activity in other regions such as the Bakken was at one point slow when compared to the Permian, causing the recent increase in production and the swapping of acreage to fly under the radar while many were focused on Texas. Transaction activity in the Bakken in 2017 marked the departure of a number of companies that were active in the play, such as Halcon Resources. At the end of 2017 and into 2018, the exodus from the Bakken to the Permian continued. Recently, the Bakken is being viewed as another viable option to the Permian Basin, which has seen a growing price differential due to insufficient infrastructure. This, and rising oil prices, has resulted in an increase in production in the region, leading to more transaction activity and inflows of capital. Overall, the average deal size has decreased from twelve months ago when companies sold off large bundles of assets to clean up their balance sheets and survive in the low oil price environment. While deals today may be smaller in size, they are more strategic in nature. Bakken Shale Market Valuations Transaction Activity
  • 12. © 2018 Mercer Capital // Business Valuation Financial Advisory Services // www.mercercapital.com 10 Mercer Capital’s Value Focus: EP Industry // Third Quarter 2018 @MercerEnergy Transactions in the Bakken Announced Date Buyer Seller Deal Value ($MM) $ / Acre $ / Boepd 8/22/18 US Energy Corp. APEG Energy LP $18 $11,125 $44,500 7/31/18 Northern Oil and Gas, Inc. W Energy Partners $100 $9,434 $14,815 7/19/18 Panhandle Oil and Gas Inc. Not Disclosed $9 $1,992 $169,811 7/18/18 Northern Oil and Gas, Inc. Pivotal Petroleum Partners, LP $152 nm $37,073 7/12/18 Petroshale Inc. Not Disclosed $55 $27,764 $100,000 6/25/18 Whiting Petroleum Corp. Oasis Petroleum Inc. $283 $4,354 $64,318 6/19/18 Not Disclosed Crescent Point Energy Corp. $280 nm $58,333 4/30/18 Comstock Resources Inc. Arkoma Drilling LP $620 nm $44,444 4/27/18 Northern Oil and Gas, Inc. Salt Creek Oil LLC $50 $37,908 $36,232 4/11/18 Vitesse Energy Llc, Vitesse Oil Llc Not Disclosed $190 $8,261 $45,238 4/4/18 Petro-Hunt LLC SM Energy Company $292 $2,342 $41,025 11/20/17 Not Disclosed Earthstone Energy Inc. $27 $4,576 $26,445 10/23/17 Valorem Energy LLC Linn Energy, Inc $285 $14,250 $35,625 9/20/17 Not Disclosed Halcon Resources Corp $104 nm $45,435 Median $128 $8,847 $44,472 Average $176 $12,201 $54,521 Source: Shale Experts * Does not include every transaction in the Permian Basin for the last twelve months ended 9/30/2018
  • 13. © 2018 Mercer Capital // Business Valuation Financial Advisory Services // www.mercercapital.com 11 Mercer Capital’s Value Focus: EP Industry // Third Quarter 2018 @MercerEnergy Whiting Acquires 65,000 Acres from Oasis One of the largest deals in the region over the last twelve months was Whiting Petroleum Corp.’s purchase of 65,000 acres from Oasis Petroleum Inc. in June for $283 million. A Seeking Alpha contributor noted that this transaction is a “case of one company believing that it can achieve better results in an area that the other company considered lower quality acreage.” This is observed in Oasis’ acceptance of a lower than average transaction price per acre, and Whiting’s willingness to pay an above average price per flowing barrel. US Energy Acquires 1,600 Acres from APEG One of the smaller deals was US Energy Corp.’s acquisition of 1,600 acres from APEG Energy LP (a related party) for $18 million. US Energy and APEG Energy II, LP announced a strategic partnership in October 2017 in a delever- aging transaction. APEG Energy II is one of Angelus Capital’s (a private equity firm headquartered in Austin, Texas) funds focused on acquiring domestic oil and gas assets. Since then, US Energy has focused on cleaning up its balance sheet to focus on producing oil assets. Recently, US Energy has been working to add assets that will imme- diately increase production in the Williston Basin and South Texas. US Energy expects their most recent transaction “will create additional opportunities for development and acreage swaps that would permit the company to continue consolidating its leasehold position in the area.” US Energy paid $44,500 per flowing barrel, which is in line with average production multiples paid in the region but is somewhat lower than those observed last year. Deal values last year may have been based on the expectation that production would increase in the future, inflating current multiples. Now that production has picked back up in the Bakken, deal multiples appear to have normalized somewhat. Bakken Shale Market Valuations Transaction Activity
  • 14. © 2018 Mercer Capital // Business Valuation Financial Advisory Services // www.mercercapital.com 12 Mercer Capital’s Value Focus: EP Industry // Third Quarter 2018 @MercerEnergy Strategic Deals Between Regional Operators While there has been activity in the Permian dating back to the 1920s, production has increased significantly in recent years due revolutions in shale. Somewhat ironically, the Bakken has been economical for shale oil longer than the Permian, meaning that many of its sweetest spots have already been drilled. However, this means operators in the Bakken have a competitive edge due to their significant experience in the region since the early 2000s. As Senior Beck, a senior director at Statas Advisors explained, “The Bakken’s maturity and production characteristics could lead to a growth in consolidation over the next few years.” Acquisitions of Property by Non-Operators Additionally, the prominence of activity of non-operators in the Bakken has increased. Private equity funds like Angelus Capital, single-family offices, and other providers of capital that see an opportunity in the Bakken are buying acreage and partnering with the best operators in order to realize superior returns on investment. Combining these trends, Northern Oil and Gas Inc. is a non-operator who aims to be the Bakken’s “natural consol- idator.” In July it completed its largest acquisition yet of 10,600 net acres for $100 million cash plus approximately $190 million of Northern Oil stock. Northern Oil is relying upon the superior abilities of longtime regional operators and the trend towards consolidation. However, it is also an example of a non-operator who has become more prominent in the last year. The Bakken may have gone unnoticed for a couple years after the downturn in oil prices in 2014, but it may be rising back to prominence as increases in efficiency and cost reductions impress investors. Bakken Shale Market Valuations Transaction Activity
  • 15. © 2018 Mercer Capital // Business Valuation Financial Advisory Services // www.mercercapital.com 13 Mercer Capital’s Value Focus: EP Industry // Third Quarter 2018 @MercerEnergy as of 9/12/2018 Company Name Ticker 9/12/2018 Enterprise Value YOY % Change in EV EBITDAX Margin EV/ EBITDAX Daily Production (mboe/d) Price per Flowing Barrel* Global Integrated Exxon Mobil Corp XOM $396,058 3.84% 14.4% 10.5x 3,767 $105,148 Royal Dutch Shell PLC RDS/A $337,066 30.47% 14.3% 6.8x na na Chevron Corp CVX $253,884 0.57% 19.1% 9.3x 2,861 $88,747 Occidental Petroleum Corp OXY $66,870 23.66% 45.7% 10.2x 676 $98,973 BP PLC BP $183,228 15.43% 11.1% 6.1x 3,618 $50,643 Group Median 15.43% 14.4% 9.3x 3,239 $93,860 Global EP Marathon Oil Corp MRO $21,391 47.54% 60.0% 6.5x 415 $51,570 Hess Corp HES $24,968 29.51% -32.7% -12.9x 260 $96,087 ConocoPhillips COP $94,944 39.44% 39.5% 7.5x 1,234 $76,965 Anadarko Petroleum Corp APC $48,196 33.67% 52.1% 8.0x 681 $70,722 Noble Energy Inc NBL $21,209 9.68% 77.0% 6.2x 343 $61,836 Apache Corp APA $25,982 10.03% 68.3% 5.8x 473 $54,877 Murphy Oil Corp MUR $7,428 22.79% 63.4% 5.2x 168 $44,225 Group Median 29.51% 60.0% 6.2x 415 $61,836 Source: Bloomberg L.P. • Price per Flowing Barrel is EV/ daily production ($/boe/d) • Companies included in the Guideline Group were selected from a broader guideline group, detailed here. The selected companies’ market caps exceed $1 billion and revenues exceed $500 million. • Statoil (Norway’s government owned oil company) changed its name to Equinor signaling its emergence as a broad energy company, not one just focused on oil. We have removed Statoil from our guideline group as its expansion into the broader energy market makes it less comparable to traditional EP companies. Mercer Capital tracks the performance of Exploration and Production companies across different mineral reserves in order to understand how the current pricing envi- ronment affects operators in each region. We created an index of seven groups to better understand performance trends across reserves and the industry. The current pricing multiples of each company in the index are summarized below. Appendix A Selected Public Company Information
  • 16. © 2018 Mercer Capital // Business Valuation Financial Advisory Services // www.mercercapital.com 14 Mercer Capital’s Value Focus: EP Industry // Third Quarter 2018 @MercerEnergy as of 9/12/2018 Company Name Ticker 9/12/2018 Enterprise Value YOY % Change in EV EBITDAX Margin EV/ EBITDAX Daily Production (mboe/d) Price per Flowing Barrel* North American EP Ultra Petroleum Corp UPL $2,420 -24.73% 63.6% 4.3x 123 $19,653 Encana Corp ECA $15,636 18.35% 34.9% 10.4x 379 $41,288 Devon Energy Corp DVN $30,785 4.26% 19.5% 11.9x 537 $57,291 Enerplus Corp ERF $3,139 30.04% 55.3% 6.9x 94 $33,448 QEP Resources Inc QEP $5,086 38.12% 32.3% 9.3x 148 $34,469 WPX Energy Inc WPX $9,818 44.39% 41.9% 15.9x 133 $73,933 EQT Corp EQT $25,311 50.47% 7.1% 88.3x 682 $37,119 Chesapeake Energy Corp CHK $15,165 0.02% 24.8% 6.3x 528 $28,696 Newfield Exploration Co NFX $7,494 7.07% 59.9% 5.9x 194 $38,651 Group Median 18.35% 34.9% 9.3x 194 $37,119 Bakken Continental Resources Inc/OK CLR $28,922 48.13% 73.1% 9.7x 296 $97,716 Whiting Petroleum Corp WLL $7,134 46.71% -9.5% -42.7x 131 $54,630 Oasis Petroleum Inc OAS $6,847 66.22% 31.5% 14.1x 86 $79,453 Crescent Point Energy Corp CPG $6,444 -7.28% 61.0% 4.3x 173 $37,284 Group Median 47.42% 46.2% 7.0x 152 $67,042 Source: Bloomberg L.P. • Price per Flowing Barrel is EV/ daily production ($/boe/d) • Companies included in the Guideline Group were selected from a broader guideline group, detailed here. The selected companies’ market caps exceed $1 billion and revenues exceed $500 million. • Statoil (Norway’s government owned oil company) changed its name to Equinor signaling its emergence as a broad energy company, not one just focused on oil. We have removed Statoil from our guideline group as its expansion into the broader energy market makes it less comparable to traditional EP companies. Appendix A Selected Public Company Information
  • 17. © 2018 Mercer Capital // Business Valuation Financial Advisory Services // www.mercercapital.com 15 Mercer Capital’s Value Focus: EP Industry // Third Quarter 2018 @MercerEnergy as of 9/12/2018 Company Name Ticker 9/12/2018 Enterprise Value YOY % Change in EV EBITDAX Margin EV/ EBITDAX Daily Production (mboe/d) Price per Flowing Barrel* Marcellus Utica Range Resources Corp RRC $8,058 -2.85% 23.3% 12.6x 372 $21,688 Cabot Oil Gas Corp COG $10,514 -20.24% 27.7% 22.0x 360 $29,192 Antero Resources Corp AR $11,761 -3.55% 29.4% 10.4x 460 $25,543 Gulfport Energy Corp GPOR $3,826 -6.15% 60.3% 4.8x 227 $16,880 Southwestern Energy Co SWN $6,506 -15.17% 38.0% 5.1x 453 $14,360 Group Median -6.15% 29.4% 10.4x 372 $21,688 Permian Basin Concho Resources Inc CXO $30,395 57.71% 91.2% 10.8x 280 $108,600 Parsley Energy Inc PE $10,840 25.41% 72.4% 11.1x 114 $95,013 Diamondback Energy Inc FANG $14,119 34.77% 77.7% 11.1x 121 $116,822 Halcon Resources Corp HK $1,296 -36.17% 221.0% 2.4x 16 $82,806 Laredo Petroleum Inc LPI $2,856 -33.81% 48.5% 5.6x 70 $40,959 Pioneer Natural Resources Co PXD $30,067 32.83% 28.9% 13.2x 319 $94,294 Cimarex Energy Co XEC $9,580 -9.79% 61.6% 7.3x 215 $44,610 Energen Corp EGN $8,296 44.49% 64.0% 10.2x 100 $83,086 Group Median 29.12% 68.2% 10.5x 117 $88,690 Source: Bloomberg L.P. • Price per Flowing Barrel is EV/ daily production ($/boe/d) • Companies included in the Guideline Group were selected from a broader guideline group, detailed here. The selected companies’ market caps exceed $1 billion and revenues exceed $500 million. • Statoil (Norway’s government owned oil company) changed its name to Equinor signaling its emergence as a broad energy company, not one just focused on oil. We have removed Statoil from our guideline group as its expansion into the broader energy market makes it less comparable to traditional EP companies. Appendix A Selected Public Company Information
  • 18. © 2018 Mercer Capital // Business Valuation Financial Advisory Services // www.mercercapital.com 16 Mercer Capital’s Value Focus: EP Industry // Third Quarter 2018 @MercerEnergy as of 9/12/2018 Company Name Ticker 9/12/2018 Enterprise Value YOY % Change in EV EBITDAX Margin EV/ EBITDAX Daily Production (mboe/d) Price per Flowing Barrel* Eagle Ford Carrizo Oil Gas Inc CRZO $3,967 56.93% 68.6% 6.5x 63 $63,443 SM Energy Co SM $5,813 45.98% 65.6% 6.2x 126 $46,265 EOG Resources Inc EOG $73,158 29.66% 43.1% 11.8x 735 $99,557 Group Median 45.98% 65.6% 6.5x 126 $63,443 Overall Median 23.66% 45.7% 7.5x 288 $54,753 Source: Bloomberg L.P. • Price per Flowing Barrel is EV/ daily production ($/boe/d) • Companies included in the Guideline Group were selected from a broader guideline group, detailed here. The selected companies’ market caps exceed $1 billion and revenues exceed $500 million. • Statoil (Norway’s government owned oil company) changed its name to Equinor signaling its emergence as a broad energy company, not one just focused on oil. We have removed Statoil from our guideline group as its expansion into the broader energy market makes it less comparable to traditional EP companies. Appendix A Selected Public Company Information
  • 19. © 2018 Mercer Capital // Business Valuation Financial Advisory Services // www.mercercapital.com 17 Mercer Capital’s Value Focus: EP Industry // Third Quarter 2018 @MercerEnergy Appendix B Rig Count Rig Count by Region 0 300 600 900 1,200 1,500 1,800 2,100 Sep-13 M ar-14 Sep-14 M ar-15 Sep-15 M ar-16 Sep-16 M ar-17 Sep-17 M ar-18 Sep-18 Bakken Eagle Ford Permian Appalachia Other Source: Baker Hughes Baker Hughes collects and publishes information regarding active drilling rigs in the United States and internationally. The number of active rigs is a key indicator of demand for oilfield services equipment. Factors influencing rig counts include energy prices, investment climate, technological changes, regulatory activity, weather, and seasonality. The number of active rigs in the United States as of September 28, 2018, stood at 1,052, a 12.0% increase from September 29, 2017. The increase reflects a pickup in drilling activity from the increase of oil prices to over $70/ bbl, enabling companies to increase drilling activities.2 Activity increased in the Bakken with the number of active rigs increasing by 6.0% to 53 rigs in September 2018. 2 Data provided by Baker Hughes.
  • 20. © 2018 Mercer Capital // Business Valuation Financial Advisory Services // www.mercercapital.com 18 Mercer Capital’s Value Focus: EP Industry // Third Quarter 2018 @MercerEnergy U.S. Rig Count by Oil vs. Natural Gas 0 500 1000 1500 2000 2500 Sep-13 M ar-14 Sep-14 M ar-15 Sep-15 M ar-16 Sep-16 M ar-17 Sep-17 M ar-18 Sep-18 Oil Gas Source: Baker Hughes Appendix B Rig Count U.S. Rig Count by Trajectory 0 500 1000 1500 2000 2500 Sep-13 M ar-14 Sep-14 M ar-15 Sep-15 M ar-16 Sep-16 M ar-17 Sep-17 M ar-18 Sep-18 Directional Horizontal Vertical Source: Baker Hughes
  • 21. © 2018 Mercer Capital // Business Valuation Financial Advisory Services // www.mercercapital.com 19 Mercer Capital’s Value Focus: EP Industry // Third Quarter 2018 @MercerEnergy Eagle Ford Rig Count by Oil vs. Natural Gas Bakken Rig Count by Oil vs. Natural Gas Permian Rig Count by Oil vs. Natural Gas Marcellus Utica Rig Count by Oil vs. Natural Gas 0 50 100 150 200 250 Sep-13 M ar-14 Sep-14 M ar-15 Sep-15 M ar-16 Sep-16 M ar-17 Sep-17 M ar-18 Sep-18 Oil Gas Source: Baker Hughes 0 50 100 150 200 250 Sep-13 M ar-14 Sep-14 M ar-15 Sep-15 M ar-16 Sep-16 M ar-17 Sep-17 M ar-18 Sep-18 Oil Gas Source: Baker Hughes 0 100 200 300 400 500 600 Sep-13 M ar-14 Sep-14 M ar-15 Sep-15 M ar-16 Sep-16 M ar-17 Sep-17 M ar-18 Sep-18 Oil Gas Source: Baker Hughes 0 20 40 60 80 100 120 140 Sep-13 M ar-14 Sep-14 M ar-15 Sep-15 M ar-16 Sep-16 M ar-17 Sep-17 M ar-18 Sep-18 Oil Gas Source: Baker Hughes Appendix B Rig Count // Oil vs. Natural Gas
  • 22. © 2018 Mercer Capital // Business Valuation Financial Advisory Services // www.mercercapital.com 20 Mercer Capital’s Value Focus: EP Industry // Third Quarter 2018 @MercerEnergy Eagle Ford Rig Count by Trajectory Bakken Rig Count by Trajectory Permian Rig Count by Trajectory Marcellus Utica Rig Count by Trajectory 0 50 100 150 200 250 Sep-13 M ar-14 Sep-14 M ar-15 Sep-15 M ar-16 Sep-16 M ar-17 Sep-17 M ar-18 Sep-18 Directional Horizontal Vertical Source: Baker Hughes 0 50 100 150 200 250 Sep-13 M ar-14 Sep-14 M ar-15 Sep-15 M ar-16 Sep-16 M ar-17 Sep-17 M ar-18 Sep-18 Directional Horizontal Vertical Source: Baker Hughes 0 100 200 300 400 500 600 Sep-13 M ar-14 Sep-14 M ar-15 Sep-15 M ar-16 Sep-16 M ar-17 Sep-17 M ar-18 Sep-18 Directional Horizontal Vertical Source: Baker Hughes 0 20 40 60 80 100 120 140 Sep-13 M ar-14 Sep-14 M ar-15 Sep-15 M ar-16 Sep-16 M ar-17 Sep-17 M ar-18 Sep-18 Directional Horizontal Vertical Source: Baker Hughes Appendix B Rig Count // Trajectory
  • 23. Mercer Capital Memphis | Dallas | Nashville www.mercercapital.com