
Recommandé
Recommandé
Contenu connexe
Tendances
Tendances (20)
Similaire à Open DataFest III - 3.14.16 - Day One Afternoon Sessions
Similaire à Open DataFest III - 3.14.16 - Day One Afternoon Sessions (20)
Dernier
Dernier (20)
Open DataFest III - 3.14.16 - Day One Afternoon Sessions
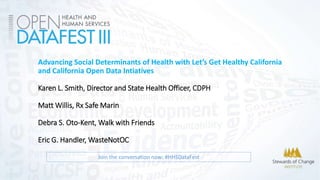
- 1. Join the conversation now: #HHSDataFest Advancing Social Determinants of Health with Let’s Get Healthy California and California Open Data Intiatives Karen L. Smith, Director and State Health Officer, CDPH Matt Willis, Rx Safe Marin Debra S. Oto-Kent, Walk with Friends Eric G. Handler, WasteNotOC
- 3. Rank state/territory Overall 1 Japan 82.73 2 Switzerland 81.81 3 Hong Kong 81.61 4 Australia 81.44 5 Italy 81.37 6 Iceland 81.28 7 France (metropol.) 80.95 8 Sweden 80.88 9 Israel 80.69 10 Singapore 80.60 11 Canada 80.54 12 Spain 80.48 13 Norway 80.45 14 Austria 80.24 15 Netherlands 80.20 16 New Zealand 80.13 17 Martinique ( France) 80.07 18 Macau 80.03 19 South Korea 80.00 20 Germany 79.85 Rank state/territory Overall 21 Belgium 79.77 22 Ireland 79.68 23 United Kingdom 79.53 24 Greece 79.52 25 Channel Islands ( UK) 79.51 26= Luxembourg 79.39 26= Guadeloupe ( France) 79.39 28 Finland 79.34 29= Cyprus 78.94 29= U.S. Virgin Islands ( US) 78.94 31 Costa Rica 78.87 32 Malta 78.80 33 Puerto Rico ( US) 78.70 34 Chile 78.65 35= Portugal 78.59 35= Slovenia 78.59 37 Cuba 78.50 38 Denmark 78.25 39 Taiwan 78.19 40 United States 77.97 41 Qatar 77.88 What do we know? Overall health isn’t determined by how much we spend.
- 4. Life expectancy in California by race/ethnicity 2006-2008 What do we know? Health is not distributed evenly in US.
- 6. “Behavioral risk factors” People’s behavior is shaped by the real life choices and opportunities available to them where they live, work, learn, and play.
- 7. Choices?
- 11. “It is necessary that properties shall continue to be occupied by the same social and racial groups”- Federal Housing Administration Underwriting Manual 1938 in recommending racially restrictive covenants.
- 12. Social Determinates of Health Conditions in the social, physical, and economic environment in which people are born, live, work, and age. They consist of policies, programs and institutions and other aspects of the social structure, including the government and private sectors, as well as community factors.” Healthy People 2020: An Opportunity to Address Societal Determinants of Health in the U.S., Objectives for 2020, July 11, 2010
- 13. “Health equity is achieving the highest level of health for all people.” Everyone should have the opportunity to make the choices that allow them to live a long, healthy life, regardless of their income, education or ethnic background. Sources: Virginia Department of Public Health RWJF: Vulnerable Populations Portfolio
- 14. Measuring health
- 15. Indicators of Health • Mortality rates • Diseases • Disability • Medical care • DALYs • QALY • Risk behaviors • Poverty rates • Educational attainment • Incarceration rates • Environmental toxins • Built environment • Food insecurity • etc
- 16. Infant Mortality Data Source birth certificate
- 17. New tools • Open data • Geocoding • Mapping
- 18. Recipients as of Oct 2006.
- 24. High school grads: 90% Unemployment: 4% Poverty: 7% Home ownership: 64% Non-White: 49%
- 25. High school grads: 81% Unemployment: 6% Poverty: 10% Home ownership: 52% Non-White: 59%
- 26. High school grads: 65% Unemployment: 12% Poverty: 25% Home ownership: 38% Non-White: 89%
- 28. Life Expectancy— Oakland Flats and Hills (2000-2003)
- 29. Alameda County 50 55 60 65 70 75 80 85 90 95 100 0% 10% 20% 30% 40% 50% 60% Poverty Rate LifeExpectancy(Years) San Francisco County 50 55 60 65 70 75 80 85 90 95 100 0% 10% 20% 30% 40% 50% 60% Poverty Rate LifeExpectancy(Years) Contra Costa County 50 55 60 65 70 75 80 85 90 95 100 0% 10% 20% 30% 40% 50% 60% Poverty Rate LifeExpectancy(Years) Tract Poverty vs. Life Expectancy
- 31. Let’s get Healthy California
- 32. The Guiding Questions What will it look like if California is the healthiest State in the Nation?
- 33. Better Care for Individuals Better Health for Populations Lower Costs National Strategy for Quality (2011), National Prevention Strategy (2011), California County Health Rankings, Commonwealth Fund on Local Health System Performance Reviewed National and State Reports Informed Development of Priorities, Goals and Targets Health Equity Focus Foundation to the Process
- 34. Indicators • 39 Indicators • 10 Year targets Report Issued December 2012
- 35. Data Innovation & Communication Website - Public reporting - Interaction & collaborative engagement - Promising interventions - Moving the needle - Stakeholder participation LGHC: Three Core Components - Data structure & visualization - Data stories & analysis
- 36. Let’s Get Healthy California Website
- 39. Let’s Get Healthy California Innovation Conference
- 41. Innovations Finalists • Rx Safe Marin Matt Willis, MD, MPH, Public Health Officer, Marin County • Walk with Friends Debra S. Oto-Kent, MPH, Founder, Executive Director, Health Education Council • WasteNotOC Eric G. Handler MD, MPH, Health Officer, Deputy Agency Director, Health Care Agency 2016 Innovations Conference
- 42. RxSafe Marin: Using Data to Mobilize a Community Coalition Matt Willis, MD MPH Public Health Officer Marin County
- 43. What can we do as a community to prevent prescription drug misuse and abuse and save lives?
- 45. Community Based Prevention Action Team Data Collection and Monitoring Action Team Law Enforcement Action Team Intervention, Treatment and Recovery Action Team Steering Committee: Data, Messaging, Policy Representatives from: Marin County Office of Education, Marin County Prescription Drug Abuse Task Force, Healthy Marin Partnerships Backbone Support: HHS Prescribers and Pharmacists Action Team
- 46. Strategic Goal for Data Action Team • Problem: An Epidemic Without a Surveillance System • Vision: Marin County will have county-wide relevant data on prescription drug misuse and abuse • Develop a report card with 5-10 key data elements to track prospectively • Engage community in selection of indicators of greatest relevance
- 47. 1. Consulted with federal, state, and other local jurisdictions 2. Contacted local agencies to determine available county-specific data 3. Compiled data and presented potential indicators • “Why this matters” • Results • Data source 4. Stakeholders voted on which indicators to include in the report card Steps for Choosing Report Card Indicators
- 48. Resources
- 49. Example of Potential Indicator: Opioid-Related Emergency Department Visits Why this matters: The Centers for Disease Control and Prevention (CDC) reports that drug misuse and abuse causes almost three million emergency department (ED) visits annually. More than half of these are related to pharmaceuticals. Compared to deaths, non fatal ED visits are a more frequent and more sensitive indicator of community burden of opioid related harm. Results: Indicator 2006 2007 2008 2009 2010 2011 2012 2013 Non-Fatal Opioid- Related Emergency Department Visits 198 222 289 300 295 344 471 352 Data Source: Office of Statewide Health Planning & Development (OSHPD). Emergency Department Data. Prepared by California Department of Public Health, Safe and Active Communities Branch
- 50. State Data Sources • Emergency Department visits • Hospitalizations Office of Statewide Health Planning and Development (OSHPD) • Controlled substance Prescription California Department of Justice/ Controlled Substance Utilization Review and Evaluation System (CURES) • Drug poisoningsVital Statistics • Treatment admissions California Outcomes Measurement System (CalOMS) Treatment Agency Type
- 51. Local Data Sources • Drug possessionsOffice of the District Attorney (DA) • Safely disposed Prescription Medications Environmental Health Services (EHS)/ Drug Enforcement Agency (DEA) • Naloxone doses administered Emergency Medical Services (EMS) Agency Type
- 53. Beyond the PDF: Livestories
- 54. • The Public as Data Consumers • Infographics • Social Math • Website • Social Media
- 56. “There is nothing new about poverty. What is new is that we now have the techniques and the resources to get rid of poverty. The real question is whether we have the will.” -Martin Luther King Jr.
- 58. • 12.7% of households are food insecure • There are 349,690 people living with food insecurity • 1 in 5 children face food insecurity Source: (Feeding America. Map the Meal Gap 2013.) Food Insecurity Statistics Orange County
- 59. Child Poverty Rates in California Counties County or County Group Child Poverty Rate (%) County or County Group Child Poverty Rate (%) Merced 40.6 Colusa, Glenn, Tehama, Trinity 21.7 Fresno 36.4 Shasta 21.7 Tulare 36.3 Yolo 21.3 Lake, Mendocino 35.2 Solano 20.8 Kern 35 San Diego 19.6 Imperial 32.7 San Luis Obispo 19.2 Stanislaus 32.4 Santa Barbara 19 Madera 30.7 Orange 18.4 Del Norte, Lassen, Modoc, Siskiyou, 29 Ventura 16.8 Kings 28.7 Sonoma 16.1 Butte 26,4 Alameda 15.8 Los Angeles 26.3 Contra Costa 15.6 Sutter, Yubs 26 San Francisco 15.4 San Joaquin 25.2 Santa Cruz 14.3 Sacramento 25.2 El Dorado 14.2 Humboldt 24.7 Nevada, Plumas, Sierra 12.7 San Bernardino 24.6 Santa Clara 12.2 Alpine, Amador, Calaveras, Inyo, Mariposa, Mono, Tuolumne 22.6 Marin 10.5 Riverside 22.1 Placer 9.7 Monterey, San Benito 22 San Mateo 8.6 Napa 21.9
- 60. Food Recovery Educate restaurants and grocery stores on the Good Samaritan Act to increase food donations. Food Distribution Connect those in need with pantries that provide wholesome food. Identify those in need Start asking the questions if individuals are facing food insecurity. 3-Pronged Approach
- 61. Targeting the cities of Anaheim and Orange 253 tons (390,000 meals) of newly recovered food Updated 10/31/15
- 62. Screening Tool to Determine Level of Food Insecurity • “Within the past 12 months we worried whether our food would run out before we got money to buy more” Often True Sometimes True Never True • “Within the past 12 months the food we bought just didn’t last and we didn’t have money to get more.” Often True Sometimes True Never True Development and Validity of a 2-Item Screen to Identify Families at Risk: Pediatrics 2010;126;e26
- 63. Interactive Google Pantry Map of Orange County
- 64. Join the conversation now: #HHSDataFest Interactive Activity: Enhancing Incentives for State and Local Government to Use Data More Effectively Facilitator: Shell Culp, Chief Innovation Officer, Stewards of Change Institute
- 65. Creating Person Centered Services and Coordinating the San Diego Region Achieving Community Health John Ohanian, President & CEO, 2-1-1 San Diego/Imperial
- 73. The Complex Community that We Live in… • 4,261 square miles (larger than 21 U.S. States; same size as Connecticut) • 5th largest U.S. County, 2nd largest in CA • 18 municipalities; 36 unincorporated towns • 18 tribal nations • 42 school districts • 2013 Estimates - 3.1 million population • 48% White • 32% Latino • 11% Asian/PI • 4.7% African American • 0.5% American Indian • Region is very diverse • Over 100 languages • Large military presence • Largest refugee resettlement site in CA • Busiest international border crossing in the world (San Ysidro/MX)
- 75. BEHAVIORS DISEASES PERCENT Leadto Resultin Morethan No Physical Activity Poor Diet Tobacco Use Cancer Heart Disease & Stroke Type 2 Diabetes Lung Disease of Deaths in San Diego
- 76. Areas of Influence Definition Top 10 Indicators Enjoying good health and expecting to live a full life • Life Expectancy • Quality of Life Learning throughout the lifespan • Education Having enough resources for a quality life • Unemployment Rate • Income Living in a clean and safe neighborhood • Security • Physical Environment • Built Environment Helping each other to live well • Vulnerable Population • Community Involvement N G R E S U L T S 7 6
- 77. The County of San Diego’s ConnectWellSD will enrich the lives of individuals and families through collaboration. ConnectWellSD is implementing a person-centered service approach and a new technology system to link enterprise-wide customer data and service information.
- 78. It all begins with one person, one family Housing/Shelter TransportationHealthcare Food Assistance Financial Assistance
- 79. Connecting San Diego Healthcare Lab Companies Health Plans Home Health Nursing Homes EMS Public Health Agencies Behavioral Health Providers Schools Patients and Caregivers Community Health Centers Pharmacies Physician Practices Hospitals
- 80. Connecting Service Providers Public Benefits Housing Health Benefits Military / Veteran Services Meals Community Services Utility Assistance Financial Literacy Programs Crisis Services Disaster Coordination Aging Services Childcare Transportation
- 81. Regional Information Exchange Cross-Sector – Vertical insights across social, health and government sectors Community-wide Holistic Easily Accessible High volume Community Backbone Efficient
- 82. Regional Information Exchange virtually integrates with its participants to enable the automation of secure, private, flow of information between regional service and healthcare providers to: Greatly Enhance Care Coordination Reduce the Cost to provide services Improve the Quality of care Achieve Improved Population Health Regional Information Exchange Partnership
- 83. Without restrictions from copyright, patents or other mechanisms Freely available for everyone to use Movement towards Open Data Interoperability denotes the ability of diverse systems and organizations to work together (inter-operate). In this case, it is the ability to interoperate - or intermix - different datasets. Open Data
- 85. Challenges and Roadmap to Success Trust and Relationships Interoperability Privacy and Consent Training and Re-training
- 86. What do you think? Achieving Community Health John Ohanian, President & CEO, 2-1-1 San Diego/Imperial