MAY 2017 - MARKET STATS
•
0 j'aime•1,338 vues

May 2017 Market Stats according to Toronto Real Estate Board

Recommandé
Recommandé
Contenu connexe
Tendances
Tendances (16)
Similaire à MAY 2017 - MARKET STATS
Similaire à MAY 2017 - MARKET STATS (19)
Plus de Michelle Makos
Plus de Michelle Makos (17)
Dernier
Dernier (20)
MAY 2017 - MARKET STATS
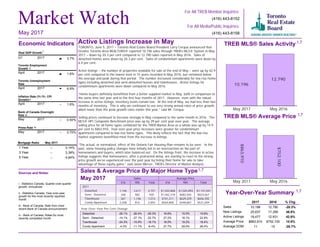
- 1. Toronto Employment Growth April 2017 1.6% Month May 2017 1 Year 3 Year 5 Year 3.14% 3.39% 4.64% May 2017 1 Year 3 Year 5 Year -- -- -- Market Watch For All TREB Member Inquiries: (416) 443-8158 For All Media/Public Inquiries: (416) 443-8152 Active Listings Increase in May TORONTO, June 5, 2017 – Toronto Real Estate Board President Larry Cerqua announced that Greater Toronto Area REALTORS® reported 10,196 sales through TREB’s MLS® System in May 2017 – down by 20.3 per cent compared to 12,790 sales reported in May 2016. Sales of detached homes were down by 26.3 per cent. Sales of condominium apartments were down by 6.4 per cent. Active listings – the number of properties available for sale at the end of May – were up by 42.9 per cent compared to the lowest level in 15 years recorded in May 2016, but remained below the average and peak during that period. The number increased considerably for low-rise home types including detached and semi-detached houses and townhouses. Active listings for condominium apartments were down compared to May 2016. “Home buyers definitely benefitted from a better supplied market in May, both in comparison to the same time last year and to the first four months of 2017. However, even with the robust increase in active listings, inventory levels remain low. At the end of May, we had less than two months of inventory. This is why we continued to see very strong annual rates of price growth, albeit lower than the peak growth rates earlier this year,” said Mr. Cerqua. Selling prices continued to increase strongly in May compared to the same month in 2016. The MLS® HPI Composite Benchmark price was up by 29 per cent year-over-year. The average selling price for all home types combined for the TREB Market Area as a whole was up by 14.9 per cent to $863,910. Year-over-year price increases were greater for condominium apartments compared to low-rise home types. This likely reflects the fact that the low-rise market segments benefitted most from the increase in listings. “The actual, or normalized, effect of the Ontario Fair Housing Plan remains to be seen. In the past, some housing policy changes have initially led to an overreaction on the part of homeowners and buyers, which later balanced out. On the listings front, the increase in active listings suggests that homeowners, after a protracted delay, are starting to react to the strong price growth we’ve experienced over the past year by listing their home for sale to take advantage of these equity gains,” said Jason Mercer, TREB’s Director of Market Analysis. TREB MLS® Sales Activity 10,196 12,790 May 2017 May 2016 TREB MLS® Average Price $863,910 $752,100 May 2017 May 2016 Year-Over-Year Summary 2017 2016 % Chg. Sales New Listings Active Listings Average Price Average DOM 10,196 12,790 -20.3% 25,837 17,356 48.9% 18,477 12,931 42.9% $863,910 $752,100 14.9% 11 15 -26.7% Sources and Notes: i - Statistics Canada, Quarter-over-quarter growth, annualized ii - Statistics Canada, Year-over-year growth for the most recently reported month iii - Bank of Canada, Rate from most recent Bank of Canada announcement iv - Bank of Canada, Rates for most recently completed month Real GDP Growth Q1 2017 3.7% Toronto Unemployment Rate April 2017 6.9% Inflation Rate (Yr./Yr. CPI Growth) April 2017 -- 1.6% Bank of Canada Overnight Rate May 2017 -- 0.50% Prime Rate May 2017 -- 2.70% Economic Indicators Metrics Sales Average Price 416 905 Total 416 905 Total 2017 Detached Semi - Detached Townhouse Condo Apartment 1,146 3,611 4,757 $1,503,868 $1,025,893 $1,141,041 348 582 930 $1,062,318 $682,565 $824,667 367 1,146 1,513 $741,211 $629,229 $656,392 2,038 816 2,854 $564,808 $448,867 $531,659 Sales & Average Price By Major Home Type May 2017 May 2017 i ii ii iii iv Detached Semi - Detached Townhouse Condo Apartment 16.6% 15.0% 15.6% 27.2% 16.1% 22.9% 18.0% 19.2% 18.4% 27.7% 29.0% 28.4% Detached Semi - Detached Townhouse Condo Apartment -26.1% -26.4% -26.3% -14.1% -27.1% -22.7% -24.3% -15.9% -18.1% -4.3% -11.1% -6.4% 1,7 1,7 1,7 1,7 Year-Over-Year Per Cent Change Mortgage Rates
- 2. Toronto Real Estate Board Market Watch, May 2017 SALES BY PRICE RANGE AND HOUSE TYPE MAY 2017 2 Price Range Detached Semi-Detached Att/Row/Twnhouse Condo Townhouse Condo Apt Link Co-op Apt Det Condo Co-ownership Apt Total $0 to $99,999 $100,000 to $199,999 $200,000 to $299,999 $300,000 to $399,999 $400,000 to $499,999 $500,000 to $599,999 $600,000 to $699,999 $700,000 to $799,999 $800,000 to $899,999 $900,000 to $999,999 $1,000,000 to $1,249,999 $1,250,000 to $1,499,999 $1,500,000 to $1,749,999 $1,750,000 to $1,999,999 $2,000,000+ 0 0 0 0 0 0 0 0 0 0 3 0 1 3 17 0 1 0 0 25 14 0 0 24 119 0 3 0 2 162 57 19 10 61 710 1 2 0 6 866 171 52 76 185 874 19 0 0 0 1,377 310 100 154 178 467 25 1 1 0 1,236 432 199 214 135 253 13 1 2 0 1,249 592 202 122 51 142 9 1 1 0 1,120 641 129 78 32 110 15 1 1 0 1,007 494 68 61 15 44 8 1 1 0 692 717 78 53 16 51 17 0 0 0 932 488 41 18 5 25 5 2 0 0 584 285 15 10 2 17 0 1 1 0 331 167 10 1 3 6 1 0 0 0 188 386 17 4 1 19 0 0 0 0 427 Price Range Detached Semi-Detached Att/Row/Twnhouse Condo Townhouse Condo Apt Link Co-op Apt Det Condo Co-ownership Apt Total $0 to $99,999 $100,000 to $199,999 $200,000 to $299,999 $300,000 to $399,999 $400,000 to $499,999 $500,000 to $599,999 $600,000 to $699,999 $700,000 to $799,999 $800,000 to $899,999 $900,000 to $999,999 $1,000,000 to $1,249,999 $1,250,000 to $1,499,999 $1,500,000 to $1,749,999 $1,750,000 to $1,999,999 $2,000,000+ 0 0 0 0 17 0 0 0 0 17 6 0 1 17 158 0 6 0 2 190 53 2 1 128 914 1 16 0 8 1,123 193 65 34 314 3,579 3 8 0 14 4,210 632 186 251 717 3,517 61 3 6 1 5,374 1,314 385 609 711 1,986 124 5 10 3 5,147 1,919 841 989 631 1,204 97 1 9 1 5,692 2,527 868 611 279 668 56 3 8 0 5,020 2,760 612 415 134 393 89 2 3 0 4,408 2,243 360 307 72 184 82 1 3 0 3,252 3,434 366 297 74 215 92 2 1 0 4,481 2,521 167 112 36 115 29 3 1 0 2,984 1,641 59 30 19 53 0 1 1 0 1,804 944 27 8 7 30 1 0 0 0 1,017 2,067 68 9 7 69 0 1 0 0 2,221 SALES BY PRICE RANGE AND HOUSE TYPE YEAR-TO-DATE, 2017 Total Sales Share of Total Sales Average Price 4,757 930 802 711 2,854 113 14 7 8 10,196 46.7% 9.1% 7.9% 7.0% 28.0% 1.1% 0.1% 0.1% 0.1% 100.0% $1,141,041 $824,667 $727,729 $575,925 $531,659 $752,928 $681,728 $828,419 $332,375 $863,910 Total Sales Share of Total Sales Average Price 22,254 4,006 3,674 3,146 13,102 635 52 42 29 46,940 47.4% 8.5% 7.8% 6.7% 27.9% 1.4% 0.1% 0.1% 0.1% 100.0% $1,180,422 $828,730 $751,864 $585,376 $510,641 $780,560 $515,853 $695,870 $345,586 $882,937 1,7 1,7
- 3. Toronto Real Estate Board Market Watch, May 2017 Number of Sales Dollar Volume Average Price Median Price New Listings SNLR (Trend) Active Listings Mos. Inv. (Trend) Avg. SP / LP Avg. DOM TREB Total Halton Region Burlington Halton Hills Milton Oakville Peel Region Brampton Caledon Mississauga City of Toronto Toronto West Toronto Central Toronto East York Region Aurora E. Gwillimbury Georgina King Markham Newmarket Richmond Hill Vaughan Whitchurch-Stouffville Durham Region Ajax Brock Clarington Oshawa Pickering Scugog Uxbridge Whitby Dufferin County Orangeville Simcoe County Adjala-Tosorontio Bradford West GwillimburyEssa Innisfil New Tecumseth 10,196 $8,808,430,424 863,910 $710,000 25,837 67.4% 18,477 1.1 104% 11 1,020 $968,547,540 949,556 $800,000 2,316 70.5% 1,714 1.0 101% 13 291 $255,681,480 878,631 $780,000 574 74.8% 407 1.0 102% 13 136 $103,556,324 761,444 $702,549 199 79.8% 124 1.0 104% 12 245 $189,200,503 772,247 $730,000 644 69.4% 383 0.8 103% 10 348 $420,109,233 1,207,210 $997,450 899 66.7% 800 1.2 100% 15 2,108 $1,618,623,934 767,848 $700,000 5,504 67.0% 3,795 1.0 103% 11 918 $673,435,655 733,590 $682,250 2,592 64.8% 1,781 0.9 103% 11 119 $130,537,076 1,096,950 $987,450 320 62.9% 278 1.6 102% 13 1,071 $814,651,203 760,645 $685,000 2,592 69.8% 1,736 1.0 104% 10 3,926 $3,532,330,617 899,728 $675,000 8,451 69.2% 5,829 1.1 106% 11 1,067 $834,388,642 781,995 $689,000 2,171 69.7% 1,524 1.2 106% 12 1,958 $2,002,524,702 1,022,740 $630,000 4,037 69.4% 2,889 1.2 105% 12 901 $695,417,273 771,828 $742,000 2,243 68.2% 1,416 0.9 108% 10 1,479 $1,602,714,330 1,083,647 $941,400 5,336 60.8% 4,371 1.2 103% 12 118 $130,511,364 1,106,029 $935,000 367 61.0% 281 1.0 102% 13 41 $37,884,050 924,001 $900,000 188 59.0% 179 1.5 103% 12 92 $68,490,438 744,461 $601,000 365 62.5% 372 1.3 99% 17 45 $72,428,032 1,609,512 $1,500,000 141 56.0% 144 2.4 101% 26 388 $425,298,926 1,096,131 $989,000 1,324 62.3% 1,024 1.1 104% 11 128 $111,122,187 868,142 $840,000 539 61.0% 452 1.0 103% 11 226 $255,778,714 1,131,764 $1,060,000 957 60.0% 773 1.2 104% 11 383 $429,447,931 1,121,274 $982,000 1,210 59.9% 921 1.2 102% 12 58 $71,752,688 1,237,115 $1,029,000 245 60.0% 225 1.3 101% 15 1,309 $854,728,823 652,963 $615,000 3,271 71.4% 1,941 0.7 106% 10 193 $140,131,000 726,067 $700,000 520 70.9% 311 0.7 106% 10 24 $12,543,700 522,654 $462,500 51 74.3% 62 2.0 101% 19 248 $150,490,290 606,816 $562,500 553 73.0% 307 0.7 107% 9 347 $182,790,672 526,774 $500,000 950 70.5% 555 0.6 107% 9 150 $113,667,265 757,782 $722,500 369 71.4% 230 0.8 105% 11 31 $20,127,800 649,284 $640,000 76 71.9% 67 1.3 102% 12 40 $34,001,412 850,035 $774,700 95 73.4% 85 1.5 102% 12 276 $200,976,684 728,176 $697,500 657 71.0% 324 0.6 106% 8 86 $45,241,139 526,060 $522,500 135 83.9% 81 0.6 102% 11 86 $45,241,139 526,060 $522,500 135 83.9% 81 0.6 102% 11 268 $186,244,041 694,940 $583,500 824 68.4% 746 1.2 100% 13 25 $18,212,900 728,516 $685,000 44 73.0% 48 1.9 100% 14 57 $50,440,600 884,923 $737,000 223 64.5% 202 1.1 100% 13 43 $22,287,176 518,306 $476,500 92 72.8% 91 1.3 99% 19 59 $42,951,765 727,996 $570,000 267 61.6% 254 1.5 100% 12 84 $52,351,600 623,233 $557,500 198 78.2% 151 1.0 101% 11 SUMMARY OF EXISTING HOME TRANSACTIONS ALL HOME TYPES, MAY 2017 ALL TREB AREAS 3 1 1 1 2 5498 3
- 4. Toronto Real Estate Board Market Watch, May 2017 SUMMARY OF EXISTING HOME TRANSACTIONS ALL HOME TYPES, MAY 2017 CITY OF TORONTO MUNICIPAL BREAKDOWN 4 Number of Sales Dollar Volume Average Price Median Price New Listings SNLR (Trend) Active Listings Mos. Inv. (Trend) Avg. SP / LP Avg. DOM TREB Total City of Toronto Total Toronto West Toronto W01 Toronto W02 Toronto W03 Toronto W04 Toronto W05 Toronto W06 Toronto W07 Toronto W08 Toronto W09 Toronto W10 Toronto Central Toronto C01 Toronto C02 Toronto C03 Toronto C04 Toronto C06 Toronto C07 Toronto C08 Toronto C09 Toronto C10 Toronto C11 Toronto C12 Toronto C13 Toronto C14 Toronto C15 Toronto East Toronto E01 Toronto E02 Toronto E03 Toronto E04 Toronto E05 Toronto E06 Toronto E07 Toronto E08 Toronto E09 Toronto E10 Toronto E11 10,196 $8,808,430,424 $863,910 $710,000 25,837 67.4% 18,477 1.1 104% 11 3,926 $3,532,330,617 $899,728 $675,000 8,451 69.2% 5,829 1.1 106% 11 1,067 $834,388,642 $781,995 $689,000 2,171 69.7% 1,524 1.2 106% 12 75 $70,522,783 $940,304 $708,000 168 70.4% 106 1.0 105% 11 99 $101,299,180 $1,023,224 $970,000 194 73.2% 105 0.8 111% 10 84 $62,836,567 $748,054 $760,000 187 68.2% 116 0.9 110% 9 91 $58,422,170 $642,002 $605,000 206 66.3% 161 1.3 107% 12 116 $63,501,099 $547,423 $514,000 248 67.6% 214 1.5 103% 17 206 $134,007,247 $650,521 $572,500 333 68.3% 211 1.4 105% 13 30 $38,650,100 $1,288,337 $1,235,000 73 69.6% 52 1.0 108% 10 224 $215,393,581 $961,578 $807,500 424 73.1% 286 1.1 104% 11 51 $39,663,824 $777,722 $820,000 111 71.1% 82 1.0 106% 10 91 $50,092,091 $550,463 $525,000 227 68.8% 191 1.2 105% 9 1,958 $2,002,524,702 $1,022,740 $630,000 4,037 69.4% 2,889 1.2 105% 12 647 $447,123,040 $691,071 $556,000 1,233 72.9% 869 1.2 106% 11 100 $172,308,543 $1,723,085 $1,335,000 182 59.4% 166 2.1 103% 18 77 $126,670,318 $1,645,069 $1,200,000 135 63.5% 96 1.3 102% 16 100 $186,618,238 $1,866,182 $1,650,000 243 61.6% 155 1.3 106% 10 39 $37,099,888 $951,279 $605,000 99 66.5% 78 1.0 107% 10 117 $104,521,842 $893,349 $651,000 322 66.3% 249 1.2 104% 10 256 $159,805,068 $624,239 $549,000 421 72.5% 284 1.2 106% 10 50 $122,395,869 $2,447,917 $1,970,000 79 68.6% 58 1.5 104% 15 88 $102,780,702 $1,167,963 $980,000 177 69.5% 103 1.0 107% 8 52 $48,818,988 $938,827 $445,000 93 75.2% 59 0.8 104% 10 43 $143,787,176 $3,343,888 $2,900,000 91 62.1% 95 2.0 101% 20 101 $104,038,740 $1,030,087 $615,000 212 72.1% 125 0.9 109% 10 147 $121,720,115 $828,028 $529,000 391 67.3% 288 1.2 103% 11 141 $124,836,175 $885,363 $532,500 359 70.8% 264 1.1 105% 11 901 $695,417,273 $771,828 $742,000 2,243 68.2% 1,416 0.9 108% 10 98 $93,366,726 $952,722 $885,000 203 72.0% 92 0.7 113% 8 72 $81,422,414 $1,130,867 $1,014,000 177 69.9% 98 0.8 107% 9 104 $97,546,030 $937,943 $895,000 246 65.6% 144 0.8 109% 9 105 $66,687,341 $635,118 $665,500 279 68.2% 186 0.9 108% 11 88 $62,761,037 $713,194 $629,000 217 68.4% 143 0.9 106% 10 35 $32,758,500 $935,957 $830,000 86 61.9% 59 1.0 108% 9 78 $49,841,585 $638,995 $471,500 225 65.0% 157 1.1 105% 11 70 $49,643,488 $709,193 $722,500 129 71.2% 82 0.9 106% 8 113 $67,806,914 $600,061 $590,000 299 72.0% 191 0.9 108% 11 62 $51,126,938 $824,628 $798,800 190 62.5% 131 1.1 105% 11 76 $42,456,300 $558,636 $557,500 192 71.0% 133 0.9 107% 11 1 1 1 2 8 3 9 4 5
- 5. Toronto Real Estate Board Market Watch, May 2017 SUMMARY OF EXISTING HOME TRANSACTIONS ALL HOME TYPES, YEAR-TO-DATE 2017 ALL TREB AREAS 5 Number of Sales Dollar Volume Average Price Median Price New Listings Avg. SP / LP Avg. DOM TREB Total Halton Region Burlington Halton Hills Milton Oakville Peel Region Brampton Caledon Mississauga City of Toronto Toronto West Toronto Central Toronto East York Region Aurora E. Gwillimbury Georgina King Markham Newmarket Richmond Hill Vaughan Whitchurch-Stouffville Durham Region Ajax Brock Clarington Oshawa Pickering Scugog Uxbridge Whitby Dufferin County Orangeville Simcoe County Adjala-Tosorontio Bradford West GwillimburyEssa Innisfil New Tecumseth 46,940 $41,445,078,517 $882,937 $730,000 81,498 108% 11 4,598 $4,472,145,178 $972,628 $835,000 7,602 105% 12 1,205 $1,015,238,322 $842,521 $770,000 1,775 104% 14 534 $402,515,319 $753,774 $689,450 703 105% 14 1,073 $844,290,859 $786,851 $750,000 1,928 108% 9 1,786 $2,210,100,678 $1,237,458 $1,125,000 3,196 105% 13 9,505 $7,266,104,730 $764,451 $703,000 16,714 107% 10 4,428 $3,277,452,687 $740,165 $700,000 8,046 106% 9 454 $447,920,494 $986,609 $900,000 882 104% 15 4,623 $3,540,731,549 $765,895 $685,000 7,786 108% 10 17,109 $15,133,709,827 $884,547 $658,000 27,616 109% 12 4,464 $3,367,418,731 $754,350 $650,000 7,069 109% 14 8,659 $8,678,261,756 $1,002,224 $620,500 13,869 108% 13 3,986 $3,088,029,340 $774,719 $752,000 6,678 113% 10 8,423 $9,637,362,668 $1,144,172 $1,020,500 17,372 109% 11 590 $683,078,812 $1,157,761 $1,050,000 1,224 109% 11 267 $275,800,436 $1,032,960 $950,222 584 110% 12 646 $451,628,971 $699,116 $635,500 1,257 106% 12 233 $368,100,968 $1,579,832 $1,388,000 449 103% 25 2,166 $2,494,427,365 $1,151,629 $1,050,000 4,318 110% 11 813 $815,203,503 $1,002,710 $960,000 1,780 112% 9 1,496 $1,926,501,766 $1,287,769 $1,243,000 3,154 110% 11 1,882 $2,221,969,739 $1,180,643 $1,071,250 3,861 108% 11 330 $400,651,108 $1,214,094 $1,043,300 745 106% 16 5,549 $3,741,334,830 $674,236 $637,250 9,195 110% 9 884 $641,026,078 $725,143 $703,079 1,454 111% 9 84 $42,565,690 $506,734 $429,350 148 102% 21 993 $606,663,619 $610,940 $580,000 1,569 110% 9 1,552 $895,105,051 $576,743 $550,000 2,666 112% 8 627 $491,843,593 $784,440 $730,000 1,020 109% 9 152 $102,224,966 $672,533 $607,500 248 102% 17 169 $151,752,425 $897,943 $802,000 267 104% 22 1,088 $810,153,408 $744,626 $725,400 1,823 111% 8 325 $177,928,371 $547,472 $532,500 442 105% 11 325 $177,928,371 $547,472 $532,500 442 105% 11 1,431 $1,016,492,913 $710,337 $625,000 2,557 103% 14 87 $76,959,500 $884,592 $685,000 135 100% 25 401 $352,809,812 $879,825 $802,900 749 106% 11 208 $111,978,642 $538,359 $486,000 339 101% 17 348 $233,408,284 $670,713 $593,000 745 104% 14 387 $241,336,675 $623,609 $570,500 589 102% 14 1 1 1 2 4 5
- 6. Toronto Real Estate Board Market Watch, May 2017 SUMMARY OF EXISTING HOME TRANSACTIONS ALL HOME TYPES, YEAR-TO-DATE 2017 CITY OF TORONTO MUNICIPAL BREAKDOWN 6 Number of Sales Dollar Volume Average Price Median Price New Listings Avg. SP / LP Avg. DOM TREB Total City of Toronto Total Toronto West Toronto W01 Toronto W02 Toronto W03 Toronto W04 Toronto W05 Toronto W06 Toronto W07 Toronto W08 Toronto W09 Toronto W10 Toronto Central Toronto C01 Toronto C02 Toronto C03 Toronto C04 Toronto C06 Toronto C07 Toronto C08 Toronto C09 Toronto C10 Toronto C11 Toronto C12 Toronto C13 Toronto C14 Toronto C15 Toronto East Toronto E01 Toronto E02 Toronto E03 Toronto E04 Toronto E05 Toronto E06 Toronto E07 Toronto E08 Toronto E09 Toronto E10 Toronto E11 46,940 $41,445,078,517 $882,937 $730,000 81,498 108% 11 17,109 $15,133,709,827 $884,547 $658,000 27,616 109% 12 4,464 $3,367,418,731 $754,350 $650,000 7,069 109% 14 257 $222,511,172 $865,802 $635,450 436 109% 13 389 $388,796,011 $999,476 $950,000 595 114% 10 321 $238,709,066 $743,642 $750,000 543 113% 11 400 $281,322,517 $703,306 $632,500 678 110% 14 523 $293,293,924 $560,791 $547,450 829 106% 19 849 $537,001,904 $632,511 $527,200 1,275 106% 16 130 $161,964,101 $1,245,878 $1,215,000 214 113% 11 909 $843,781,863 $928,253 $700,050 1,394 107% 12 229 $171,691,451 $749,744 $750,000 373 110% 12 457 $228,346,722 $499,665 $400,000 732 106% 14 8,659 $8,678,261,756 $1,002,224 $620,500 13,869 108% 13 2,788 $1,861,212,117 $667,580 $550,000 4,271 106% 13 408 $624,518,115 $1,530,682 $1,254,500 728 105% 20 278 $451,883,369 $1,625,480 $1,155,258 464 107% 14 411 $778,629,232 $1,894,475 $1,815,000 720 109% 13 193 $191,474,852 $992,098 $600,000 334 113% 11 640 $614,802,962 $960,630 $630,500 1,114 107% 11 1,024 $661,766,924 $646,257 $569,900 1,494 107% 13 137 $317,889,784 $2,320,363 $1,905,000 235 105% 14 342 $347,172,812 $1,015,125 $699,500 541 110% 11 216 $210,623,717 $975,110 $484,000 317 109% 10 192 $620,432,438 $3,231,419 $3,029,000 355 103% 17 403 $487,842,803 $1,210,528 $761,500 652 115% 10 846 $838,355,808 $990,964 $562,333 1,395 108% 11 781 $671,656,823 $859,996 $535,000 1,249 110% 10 3,986 $3,088,029,340 $774,719 $752,000 6,678 113% 10 320 $313,991,556 $981,224 $912,000 524 119% 8 299 $328,109,218 $1,097,355 $1,000,000 481 113% 11 392 $380,305,504 $970,167 $942,500 694 116% 10 496 $331,800,581 $668,953 $725,000 812 113% 10 468 $360,487,458 $770,272 $635,000 753 114% 11 174 $158,646,588 $911,762 $808,500 306 109% 11 389 $251,409,451 $646,297 $460,000 704 113% 10 274 $215,560,304 $786,716 $775,000 426 109% 9 535 $317,140,030 $592,785 $535,000 891 113% 10 295 $239,196,525 $810,836 $801,000 545 111% 14 344 $191,382,125 $556,343 $571,000 542 110% 11 1 1 1 2 4 5
- 7. Toronto Real Estate Board Market Watch, May 2017 SUMMARY OF EXISTING HOME TRANSACTIONS DETACHED HOUSES, MAY 2017 ALL TREB AREAS 7 Sales Dollar Volume Average Price Median Price New Listings Active Listings Avg. SP / LP Avg. DOM TREB Total Halton Region Burlington Halton Hills Milton Oakville Peel Region Brampton Caledon Mississauga City of Toronto Toronto West Toronto Central Toronto East York Region Aurora E. Gwillimbury Georgina King Markham Newmarket Richmond Hill Vaughan Whitchurch-Stouffville Durham Region Ajax Brock Clarington Oshawa Pickering Scugog Uxbridge Whitby Dufferin County Orangeville Simcoe County Adjala-Tosorontio Bradford West GwillimburyEssa Innisfil New Tecumseth 4,757 $5,427,932,608 $1,141,041 $925,000 14,036 10,654 103% 12 606 $707,113,355 $1,166,854 $975,000 1,410 1,123 101% 13 176 $190,633,408 $1,083,144 $950,000 375 274 101% 14 108 $89,106,224 $825,058 $778,750 161 104 104% 12 120 $111,947,887 $932,899 $860,000 307 204 103% 10 202 $315,425,836 $1,561,514 $1,222,500 567 541 99% 15 991 $999,683,784 $1,008,763 $920,000 2,798 2,058 103% 11 496 $432,041,758 $871,052 $807,750 1,457 1,028 103% 12 97 $115,481,076 $1,190,527 $1,067,500 241 235 102% 13 398 $452,160,950 $1,136,083 $1,025,000 1,100 795 103% 10 1,146 $1,723,433,090 $1,503,868 $1,120,000 3,123 2,242 105% 10 399 $455,774,360 $1,142,292 $950,000 968 712 106% 10 352 $876,012,783 $2,488,673 $2,008,000 1,006 773 103% 11 395 $391,645,947 $991,509 $885,500 1,149 757 107% 10 842 $1,154,746,763 $1,371,433 $1,250,000 3,475 3,036 102% 13 72 $97,970,088 $1,360,696 $1,155,000 237 191 102% 14 35 $34,064,200 $973,263 $910,000 167 162 104% 11 84 $64,366,938 $766,273 $623,000 334 344 99% 17 38 $66,742,722 $1,756,387 $1,638,000 123 133 101% 28 173 $273,438,538 $1,580,570 $1,455,000 688 563 103% 11 78 $77,266,199 $990,592 $920,000 373 333 103% 11 111 $175,860,326 $1,584,327 $1,505,000 612 523 104% 12 204 $301,873,864 $1,479,774 $1,283,750 763 610 102% 12 47 $63,163,888 $1,343,913 $1,104,000 178 177 100% 16 921 $661,996,789 $718,780 $692,000 2,460 1,512 105% 10 124 $101,000,600 $814,521 $810,000 334 199 106% 10 22 $11,703,700 $531,986 $469,500 49 61 101% 19 175 $117,026,590 $668,723 $620,000 427 247 105% 10 255 $145,486,663 $570,536 $545,000 740 441 107% 9 87 $78,851,765 $906,342 $830,000 244 158 104% 12 28 $18,852,800 $673,314 $652,450 74 66 102% 12 32 $29,818,900 $931,841 $839,500 85 80 102% 11 198 $159,255,771 $804,322 $763,500 507 260 105% 8 49 $28,972,662 $591,279 $575,000 84 54 101% 11 49 $28,972,662 $591,279 $575,000 84 54 101% 11 202 $151,986,165 $752,407 $625,000 686 629 100% 14 24 $17,853,000 $743,875 $715,000 44 48 100% 14 42 $41,337,300 $984,221 $847,500 172 162 99% 15 28 $15,324,400 $547,300 $519,950 72 71 99% 19 52 $39,670,865 $762,901 $599,900 251 234 100% 12 56 $37,800,600 $675,011 $597,000 147 114 100% 12 1 2 3 4 51 1 1
- 8. Toronto Real Estate Board Market Watch, May 2017 SUMMARY OF EXISTING HOME TRANSACTIONS DETACHED HOUSES, MAY 2017 CITY OF TORONTO MUNICIPAL BREAKDOWN 8 Sales Dollar Volume Average Price Median Price New Listings Active Listings Avg. SP / LP Avg. DOM TREB Total City of Toronto Total Toronto West Toronto W01 Toronto W02 Toronto W03 Toronto W04 Toronto W05 Toronto W06 Toronto W07 Toronto W08 Toronto W09 Toronto W10 Toronto Central Toronto C01 Toronto C02 Toronto C03 Toronto C04 Toronto C06 Toronto C07 Toronto C08 Toronto C09 Toronto C10 Toronto C11 Toronto C12 Toronto C13 Toronto C14 Toronto C15 Toronto East Toronto E01 Toronto E02 Toronto E03 Toronto E04 Toronto E05 Toronto E06 Toronto E07 Toronto E08 Toronto E09 Toronto E10 Toronto E11 4,757 $5,427,932,608 $1,141,041 $925,000 14,036 10,654 103% 12 1,146 $1,723,433,090 $1,503,868 $1,120,000 3,123 2,242 105% 10 399 $455,774,360 $1,142,292 $950,000 968 712 106% 10 18 $30,701,063 $1,705,615 $1,525,000 46 32 101% 10 37 $49,332,890 $1,333,321 $1,325,000 83 43 110% 10 41 $32,403,256 $790,323 $770,750 98 66 113% 8 39 $35,568,217 $912,006 $900,000 124 104 108% 12 24 $20,252,500 $843,854 $847,500 69 67 103% 14 45 $42,240,921 $938,687 $860,000 98 73 107% 11 26 $36,078,100 $1,387,619 $1,325,000 65 46 108% 9 101 $151,129,739 $1,496,334 $1,275,000 227 166 103% 11 30 $29,627,124 $987,571 $940,000 62 45 106% 10 38 $28,440,550 $748,436 $752,500 96 70 106% 8 352 $876,012,783 $2,488,673 $2,008,000 1,006 773 103% 11 7 $11,885,000 $1,697,857 $1,390,000 28 23 102% 10 18 $55,480,000 $3,082,222 $2,604,000 38 33 103% 14 45 $103,427,338 $2,298,385 $1,825,000 85 52 103% 12 70 $160,676,331 $2,295,376 $1,900,000 195 122 106% 9 19 $27,554,888 $1,450,257 $1,330,000 66 51 107% 9 26 $49,059,906 $1,886,919 $1,704,500 124 112 99% 12 1 $1,551,423 $1,551,423 $1,551,423 1 1 113% 6 24 $82,963,888 $3,456,829 $3,075,000 34 26 101% 15 26 $52,020,408 $2,000,785 $1,895,000 51 27 107% 8 16 $32,386,150 $2,024,134 $2,000,000 41 25 102% 8 26 $125,120,376 $4,812,322 $4,537,500 63 76 100% 20 29 $64,615,075 $2,228,106 $1,960,000 101 64 109% 8 18 $49,356,000 $2,742,000 $2,427,500 91 93 99% 17 27 $59,916,000 $2,219,111 $2,050,000 88 68 105% 9 395 $391,645,947 $991,509 $885,500 1,149 757 107% 10 20 $23,812,500 $1,190,625 $1,146,250 50 26 116% 6 31 $42,624,014 $1,374,968 $1,270,000 84 49 106% 10 64 $65,648,030 $1,025,750 $947,500 153 93 108% 10 54 $43,791,229 $810,949 $785,000 161 110 109% 11 29 $31,877,688 $1,099,231 $1,100,000 105 79 106% 10 30 $30,143,000 $1,004,767 $917,500 74 48 108% 9 21 $23,414,650 $1,114,983 $1,015,000 89 64 102% 8 38 $35,776,200 $941,479 $858,000 84 54 104% 8 48 $39,325,286 $819,277 $812,500 152 93 107% 11 41 $40,010,850 $975,874 $855,001 134 93 105% 11 19 $15,222,500 $801,184 $850,000 63 48 107% 11 1 1 1 1 2 3 4 5
- 9. Toronto Real Estate Board Market Watch, May 2017 SUMMARY OF EXISTING HOME TRANSACTIONS SEMI-DETACHED HOUSES, MAY 2017 ALL TREB AREAS 9 Sales Dollar Volume Average Price Median Price New Listings Active Listings Avg. SP / LP Avg. DOM TREB Total Halton Region Burlington Halton Hills Milton Oakville Peel Region Brampton Caledon Mississauga City of Toronto Toronto West Toronto Central Toronto East York Region Aurora E. Gwillimbury Georgina King Markham Newmarket Richmond Hill Vaughan Whitchurch-Stouffville Durham Region Ajax Brock Clarington Oshawa Pickering Scugog Uxbridge Whitby Dufferin County Orangeville Simcoe County Adjala-Tosorontio Bradford West GwillimburyEssa Innisfil New Tecumseth 930 $766,939,874 $824,667 $745,000 2,550 1,611 107% 10 68 $48,570,400 $714,271 $717,500 168 87 104% 10 20 $13,952,800 $697,640 $705,500 32 20 103% 12 5 $2,854,800 $570,960 $584,000 12 8 103% 10 33 $23,305,900 $706,239 $715,000 102 46 104% 9 10 $8,456,900 $845,690 $807,500 22 13 104% 12 317 $217,974,988 $687,618 $680,000 920 607 104% 10 186 $120,624,200 $648,517 $642,550 527 359 104% 10 9 $6,334,500 $703,833 $692,000 33 19 100% 11 122 $91,016,288 $746,035 $733,500 360 229 104% 9 348 $369,686,834 $1,062,318 $925,000 843 515 110% 9 108 $93,606,296 $866,725 $829,000 265 175 109% 10 110 $158,038,824 $1,436,717 $1,274,500 278 166 109% 9 130 $118,041,714 $908,013 $870,000 300 174 111% 9 94 $79,297,864 $843,594 $840,500 386 276 105% 11 14 $11,846,888 $846,206 $842,500 35 22 102% 10 0 - - - 7 6 - - 2 $916,000 $458,000 $458,000 8 7 99% 18 0 - - - 1 1 - - 21 $18,860,000 $898,095 $882,000 91 59 108% 13 15 $10,460,688 $697,379 $670,000 82 61 103% 10 5 $5,148,888 $1,029,778 $875,000 39 36 114% 6 35 $30,460,400 $870,297 $870,000 109 73 104% 11 2 $1,605,000 $802,500 $802,500 14 11 115% 5 81 $41,147,300 $507,991 $465,000 197 100 108% 9 13 $8,522,800 $655,600 $670,000 49 29 108% 11 1 $415,000 $415,000 $415,000 0 0 97% 28 5 $2,117,500 $423,500 $405,000 9 7 106% 7 36 $15,307,500 $425,208 $425,000 89 44 109% 9 15 $9,162,500 $610,833 $610,000 25 9 107% 7 2 $785,000 $392,500 $392,500 2 1 102% 8 0 - - - 0 0 - - 9 $4,837,000 $537,444 $545,000 23 10 111% 8 13 $5,803,300 $446,408 $425,000 13 8 102% 10 13 $5,803,300 $446,408 $425,000 13 8 102% 10 9 $4,459,188 $495,465 $430,000 23 18 102% 15 1 $359,900 $359,900 $359,900 0 0 100% 15 2 $1,374,400 $687,200 $687,200 15 13 106% 7 3 $1,269,888 $423,296 $425,000 1 1 100% 27 0 - - - 0 0 - - 3 $1,455,000 $485,000 $430,000 7 4 100% 8 1 1 1 1 2 3 4 5
- 10. Toronto Real Estate Board Market Watch, May 2017 SUMMARY OF EXISTING HOME TRANSACTIONS SEMI-DETACHED HOUSES, MAY 2017 CITY OF TORONTO MUNICIPAL BREAKDOWN 10 Sales Dollar Volume Average Price Median Price New Listings Active Listings Avg. SP / LP Avg. DOM TREB Total City of Toronto Total Toronto West Toronto W01 Toronto W02 Toronto W03 Toronto W04 Toronto W05 Toronto W06 Toronto W07 Toronto W08 Toronto W09 Toronto W10 Toronto Central Toronto C01 Toronto C02 Toronto C03 Toronto C04 Toronto C06 Toronto C07 Toronto C08 Toronto C09 Toronto C10 Toronto C11 Toronto C12 Toronto C13 Toronto C14 Toronto C15 Toronto East Toronto E01 Toronto E02 Toronto E03 Toronto E04 Toronto E05 Toronto E06 Toronto E07 Toronto E08 Toronto E09 Toronto E10 Toronto E11 930 $766,939,874 $824,667 $745,000 2,550 1,611 107% 10 348 $369,686,834 $1,062,318 $925,000 843 515 110% 9 108 $93,606,296 $866,725 $829,000 265 175 109% 10 12 $14,156,000 $1,179,667 $1,183,000 19 12 113% 10 25 $24,962,985 $998,519 $950,000 55 32 117% 8 31 $24,770,811 $799,058 $815,000 68 40 107% 11 3 $2,161,000 $720,333 $750,000 16 14 103% 17 25 $18,105,000 $724,200 $710,500 82 63 102% 10 4 $3,569,000 $892,250 $909,500 8 2 108% 6 0 - - - 0 0 - - 2 $1,646,500 $823,250 $823,250 3 2 106% 8 0 - - - 2 2 - - 6 $4,235,000 $705,833 $640,000 12 8 103% 10 110 $158,038,824 $1,436,717 $1,274,500 278 166 109% 9 24 $33,064,242 $1,377,677 $1,274,500 64 30 111% 7 23 $42,459,238 $1,846,054 $1,750,000 29 17 110% 7 9 $7,807,500 $867,500 $825,000 16 12 99% 11 9 $12,592,000 $1,399,111 $1,350,000 15 7 114% 8 0 - - - 2 4 - - 4 $4,035,000 $1,008,750 $1,017,500 17 10 100% 9 10 $12,962,156 $1,296,216 $1,360,000 19 13 99% 16 5 $14,450,000 $2,890,000 $2,950,000 9 5 118% 17 11 $15,568,800 $1,415,345 $1,305,000 35 17 107% 7 3 $3,643,888 $1,214,629 $1,250,000 8 4 109% 7 0 - - - 3 2 - - 2 $1,570,000 $785,000 $785,000 13 10 101% 11 0 - - - 2 1 - - 10 $9,886,000 $988,600 $962,500 46 34 105% 12 130 $118,041,714 $908,013 $870,000 300 174 111% 9 35 $37,093,326 $1,059,809 $997,500 77 37 116% 7 23 $24,464,900 $1,063,691 $975,000 47 25 109% 9 24 $23,524,000 $980,167 $963,000 59 35 113% 8 5 $3,241,500 $648,300 $655,000 17 14 106% 6 7 $5,735,000 $819,286 $828,000 16 10 107% 11 2 $1,360,500 $680,250 $680,250 6 4 109% 9 5 $3,840,000 $768,000 $780,000 18 12 104% 9 2 $1,422,000 $711,000 $711,000 1 0 107% 5 10 $6,632,300 $663,230 $665,500 13 6 108% 10 10 $6,338,188 $633,819 $610,750 18 10 103% 11 7 $4,390,000 $627,143 $615,000 28 21 108% 9 1 1 1 1 2 3 4 5
- 11. Toronto Real Estate Board Market Watch, May 2017 SUMMARY OF EXISTING HOME TRANSACTIONS CONDOMINIUM TOWNHOUSES, MAY 2017 ALL TREB AREAS 11 Sales Dollar Volume Average Price Median Price New Listings Active Listings Avg. SP / LP Avg. DOM TREB Total Halton Region Burlington Halton Hills Milton Oakville Peel Region Brampton Caledon Mississauga City of Toronto Toronto West Toronto Central Toronto East York Region Aurora E. Gwillimbury Georgina King Markham Newmarket Richmond Hill Vaughan Whitchurch-Stouffville Durham Region Ajax Brock Clarington Oshawa Pickering Scugog Uxbridge Whitby Dufferin County Orangeville Simcoe County Adjala-Tosorontio Bradford West GwillimburyEssa Innisfil New Tecumseth 711 $409,482,993 $575,925 $536,000 1,574 1,027 105% 12 84 $42,984,000 $511,714 $496,500 184 127 105% 10 38 $19,989,400 $526,037 $500,000 73 54 102% 12 12 $5,198,300 $433,192 $450,000 11 3 111% 6 8 $3,767,600 $470,950 $454,500 28 13 103% 11 26 $14,028,700 $539,565 $510,000 72 57 107% 11 236 $132,210,581 $560,214 $549,444 556 345 105% 11 56 $27,456,742 $490,299 $464,500 159 110 105% 14 0 - - - 1 1 - - 180 $104,753,839 $581,966 $567,500 396 234 104% 10 248 $155,398,569 $626,607 $589,000 514 345 106% 13 97 $52,479,254 $541,023 $510,000 142 100 105% 16 85 $64,654,600 $760,642 $660,000 211 137 105% 11 66 $38,264,715 $579,768 $585,000 161 108 109% 10 73 $50,310,043 $689,179 $640,000 175 119 104% 12 10 $6,574,788 $657,479 $582,500 31 21 107% 5 0 - - - 0 0 - - 0 - - - 1 1 - - 0 - - - 0 0 - - 25 $18,857,000 $754,280 $725,000 76 54 103% 13 12 $8,396,000 $699,667 $621,000 18 10 105% 12 10 $6,143,000 $614,300 $577,500 20 14 104% 11 16 $10,339,255 $646,203 $620,000 28 18 102% 16 0 - - - 1 1 - - 66 $27,079,900 $410,302 $427,500 138 83 110% 11 6 $2,893,000 $482,167 $499,500 27 20 110% 12 0 - - - 1 1 - - 4 $1,745,000 $436,250 $457,500 8 5 115% 7 24 $8,092,900 $337,204 $320,000 46 26 113% 11 16 $7,851,000 $490,688 $481,500 34 22 112% 9 0 - - - 0 0 - - 2 $757,000 $378,500 $378,500 3 2 98% 41 14 $5,741,000 $410,071 $427,500 19 7 105% 12 2 $755,000 $377,500 $377,500 3 2 117% 4 2 $755,000 $377,500 $377,500 3 2 117% 4 2 $744,900 $372,450 $372,450 4 6 104% 19 0 - - - 0 0 - - 1 $399,900 $399,900 $399,900 1 3 100% 30 0 - - - 0 0 - - 0 - - - 0 0 - - 1 $345,000 $345,000 $345,000 3 3 108% 7 1 1 1 1 2 3 4 5
- 12. Toronto Real Estate Board Market Watch, May 2017 SUMMARY OF EXISTING HOME TRANSACTIONS CONDOMINIUM TOWNHOUSES, MAY 2017 CITY OF TORONTO MUNICIPAL BREAKDOWN 12 Sales Dollar Volume Average Price Median Price New Listings Active Listings Avg. SP / LP Avg. DOM TREB Total City of Toronto Total Toronto West Toronto W01 Toronto W02 Toronto W03 Toronto W04 Toronto W05 Toronto W06 Toronto W07 Toronto W08 Toronto W09 Toronto W10 Toronto Central Toronto C01 Toronto C02 Toronto C03 Toronto C04 Toronto C06 Toronto C07 Toronto C08 Toronto C09 Toronto C10 Toronto C11 Toronto C12 Toronto C13 Toronto C14 Toronto C15 Toronto East Toronto E01 Toronto E02 Toronto E03 Toronto E04 Toronto E05 Toronto E06 Toronto E07 Toronto E08 Toronto E09 Toronto E10 Toronto E11 711 $409,482,993 $575,925 $536,000 1,574 1,027 105% 12 248 $155,398,569 $626,607 $589,000 514 345 106% 13 97 $52,479,254 $541,023 $510,000 142 100 105% 16 4 $2,588,000 $647,000 $626,500 11 6 101% 6 11 $8,383,038 $762,094 $741,000 15 7 109% 11 4 $2,126,000 $531,500 $563,000 6 2 109% 9 11 $5,336,565 $485,142 $455,000 10 8 104% 15 33 $13,572,200 $411,279 $445,000 43 45 102% 29 12 $8,220,900 $685,075 $670,000 17 5 109% 7 0 - - - 0 0 - - 7 $4,764,000 $680,571 $711,000 9 5 105% 10 7 $3,920,000 $560,000 $500,000 10 5 103% 11 8 $3,568,551 $446,069 $453,276 21 17 108% 5 85 $64,654,600 $760,642 $660,000 211 137 105% 11 25 $20,135,300 $805,412 $775,000 67 46 106% 12 2 $1,280,000 $640,000 $640,000 5 5 111% 7 0 - - - 1 2 - - 0 - - - 0 1 - - 1 $585,000 $585,000 $585,000 0 0 98% 16 10 $7,029,000 $702,900 $655,500 18 10 110% 10 5 $4,057,500 $811,500 $535,000 19 11 98% 7 2 $3,200,000 $1,600,000 $1,600,000 3 0 102% 14 2 $1,080,000 $540,000 $540,000 5 2 105% 6 1 $400,000 $400,000 $400,000 5 3 111% 3 6 $5,951,800 $991,967 $998,900 13 9 102% 11 4 $2,342,500 $585,625 $535,000 7 5 108% 7 8 $6,903,000 $862,875 $840,000 26 13 104% 12 19 $11,690,500 $615,289 $630,000 42 30 104% 12 66 $38,264,715 $579,768 $585,000 161 108 109% 10 5 $3,843,000 $768,600 $620,000 6 4 125% 8 5 $4,198,000 $839,600 $756,000 10 4 111% 4 3 $2,251,000 $750,333 $690,000 3 0 118% 7 7 $3,923,000 $560,429 $590,000 12 8 107% 8 14 $8,421,980 $601,570 $613,500 40 25 105% 9 0 - - - 1 1 - - 7 $4,300,635 $614,376 $606,000 15 10 107% 12 4 $2,211,000 $552,750 $540,000 7 6 109% 14 4 $1,299,000 $324,750 $279,500 10 10 102% 23 3 $1,563,600 $521,200 $545,000 20 14 112% 7 14 $6,253,500 $446,679 $423,750 37 26 106% 11 1 1 1 1 2 3 4 5
- 13. Toronto Real Estate Board Market Watch, May 2017 SUMMARY OF EXISTING HOME TRANSACTIONS CONDOMINIUM APARTMENT, MAY 2017 ALL TREB AREAS 13 Sales Dollar Volume Average Price Median Price New Listings Active Listings Avg. SP / LP Avg. DOM TREB Total Halton Region Burlington Halton Hills Milton Oakville Peel Region Brampton Caledon Mississauga City of Toronto Toronto West Toronto Central Toronto East York Region Aurora E. Gwillimbury Georgina King Markham Newmarket Richmond Hill Vaughan Whitchurch-Stouffville Durham Region Ajax Brock Clarington Oshawa Pickering Scugog Uxbridge Whitby Dufferin County Orangeville Simcoe County Adjala-Tosorontio Bradford West GwillimburyEssa Innisfil New Tecumseth 2,854 $1,517,353,473 $531,659 $457,500 5,053 3,509 105% 12 100 $52,658,681 $526,587 $423,400 151 121 103% 18 31 $14,197,272 $457,977 $385,000 42 28 106% 13 1 $421,000 $421,000 $421,000 0 2 99% 34 16 $7,694,000 $480,875 $487,000 45 28 106% 11 52 $30,346,409 $583,585 $437,500 64 63 100% 23 403 $163,199,765 $404,962 $380,000 709 463 105% 11 71 $25,504,427 $359,217 $365,000 101 67 106% 11 0 - - - 0 0 - - 332 $137,695,338 $414,745 $386,750 608 396 104% 11 2,038 $1,151,077,906 $564,808 $485,000 3,616 2,509 105% 12 431 $202,507,665 $469,855 $425,000 714 492 105% 12 1,350 $842,238,244 $623,880 $531,575 2,405 1,717 105% 12 257 $106,331,997 $413,743 $380,000 497 300 106% 10 255 $127,725,362 $500,884 $450,000 488 345 104% 11 8 $4,055,000 $506,875 $462,000 12 13 102% 20 0 - - - 0 0 - - 0 - - - 2 2 - - 3 $1,750,310 $583,437 $505,310 5 3 103% 16 101 $49,286,052 $487,981 $449,000 197 139 106% 11 8 $3,912,000 $489,000 $492,250 7 3 105% 10 58 $27,218,000 $469,276 $437,500 122 81 103% 9 77 $41,504,000 $539,013 $475,000 143 100 102% 12 0 - - - 0 4 - - 54 $21,587,259 $399,764 $373,000 79 54 106% 11 9 $3,471,900 $385,767 $371,000 13 10 102% 12 0 - - - 0 0 - - 9 $3,120,000 $346,667 $330,000 18 16 105% 7 12 $4,305,859 $358,822 $300,511 18 11 115% 11 11 $4,456,000 $405,091 $390,000 18 11 109% 8 0 - - - 0 0 - - 1 $300,000 $300,000 $300,000 0 0 94% 26 12 $5,933,500 $494,458 $480,000 12 6 101% 13 3 $809,500 $269,833 $312,500 7 8 96% 8 3 $809,500 $269,833 $312,500 7 8 96% 8 1 $295,000 $295,000 $295,000 3 9 102% 8 0 - - - 0 0 - - 1 $295,000 $295,000 $295,000 0 2 102% 8 0 - - - 0 0 - - 0 - - - 0 3 - - 0 - - - 3 4 - - 1 1 1 1 2 3 4 5
- 14. Toronto Real Estate Board Market Watch, May 2017 SUMMARY OF EXISTING HOME TRANSACTIONS CONDOMINIUM APARTMENT, MAY 2017 CITY OF TORONTO MUNICIPAL BREAKDOWN 14 Sales Dollar Volume Average Price Median Price New Listings Active Listings Avg. SP / LP Avg. DOM TREB Total City of Toronto Total Toronto West Toronto W01 Toronto W02 Toronto W03 Toronto W04 Toronto W05 Toronto W06 Toronto W07 Toronto W08 Toronto W09 Toronto W10 Toronto Central Toronto C01 Toronto C02 Toronto C03 Toronto C04 Toronto C06 Toronto C07 Toronto C08 Toronto C09 Toronto C10 Toronto C11 Toronto C12 Toronto C13 Toronto C14 Toronto C15 Toronto East Toronto E01 Toronto E02 Toronto E03 Toronto E04 Toronto E05 Toronto E06 Toronto E07 Toronto E08 Toronto E09 Toronto E10 Toronto E11 2,854 $1,517,353,473 $531,659 $457,500 5,053 3,509 105% 12 2,038 $1,151,077,906 $564,808 $485,000 3,616 2,509 105% 12 431 $202,507,665 $469,855 $425,000 714 492 105% 12 38 $19,524,720 $513,808 $483,710 83 51 106% 10 18 $9,947,200 $552,622 $475,200 24 14 107% 11 7 $3,016,500 $430,929 $415,500 10 5 104% 8 35 $13,409,388 $383,125 $390,000 51 31 108% 11 31 $9,414,399 $303,690 $305,000 45 35 101% 12 138 $73,592,426 $533,278 $483,565 195 123 104% 15 4 $2,572,000 $643,000 $493,500 5 4 105% 14 109 $52,404,342 $480,774 $425,000 174 108 105% 11 13 $5,416,700 $416,669 $475,000 34 28 108% 7 38 $13,209,990 $347,631 $339,500 93 93 104% 11 1,350 $842,238,244 $623,880 $531,575 2,405 1,717 105% 12 571 $360,044,128 $630,550 $543,000 1,022 737 105% 12 49 $61,710,305 $1,259,394 $770,000 92 101 98% 25 19 $14,164,480 $745,499 $644,990 32 28 103% 25 17 $11,510,702 $677,100 $570,000 29 21 104% 10 19 $8,960,000 $471,579 $450,000 29 22 108% 11 76 $43,109,936 $567,236 $542,000 155 110 109% 10 230 $133,144,089 $578,887 $539,900 357 238 107% 10 14 $15,780,000 $1,127,143 $792,500 30 25 103% 15 46 $30,048,499 $653,228 $580,000 84 57 105% 9 32 $12,388,950 $387,155 $353,500 38 25 106% 12 11 $12,715,000 $1,155,909 $950,000 12 8 106% 26 62 $31,473,365 $507,635 $440,000 83 43 110% 11 119 $63,845,115 $536,514 $495,000 260 171 106% 10 85 $43,343,675 $509,926 $440,000 182 131 107% 12 257 $106,331,997 $413,743 $380,000 497 300 106% 10 27 $17,296,900 $640,626 $634,000 44 14 104% 8 7 $4,279,000 $611,286 $591,000 21 12 105% 8 10 $4,570,000 $457,000 $463,000 23 13 101% 10 32 $10,891,612 $340,363 $355,000 79 51 105% 11 37 $15,886,369 $429,361 $425,000 53 27 105% 10 3 $1,255,000 $418,333 $350,000 5 6 100% 8 42 $15,803,300 $376,269 $370,500 89 61 107% 13 22 $7,503,788 $341,081 $312,000 26 12 113% 7 51 $20,550,328 $402,948 $390,000 120 79 109% 10 5 $1,251,000 $250,200 $220,000 4 4 107% 23 21 $7,044,700 $335,462 $355,900 33 21 106% 13 1 1 1 1 2 3 4 5
- 15. Toronto Real Estate Board Market Watch, May 2017 SUMMARY OF EXISTING HOME TRANSACTIONS LINK, MAY 2017 ALL TREB AREAS 15 Sales Dollar Volume Average Price Median Price New Listings Active Listings Avg. SP / LP Avg. DOM TREB Total Halton Region Burlington Halton Hills Milton Oakville Peel Region Brampton Caledon Mississauga City of Toronto Toronto West Toronto Central Toronto East York Region Aurora E. Gwillimbury Georgina King Markham Newmarket Richmond Hill Vaughan Whitchurch-Stouffville Durham Region Ajax Brock Clarington Oshawa Pickering Scugog Uxbridge Whitby Dufferin County Orangeville Simcoe County Adjala-Tosorontio Bradford West GwillimburyEssa Innisfil New Tecumseth 113 $85,080,912 $752,928 $678,000 336 218 105% 11 5 $5,302,000 $1,060,400 $1,002,000 10 7 102% 17 1 $655,000 $655,000 $655,000 2 0 111% 3 0 - - - 1 1 - - 0 - - - 2 1 - - 4 $4,647,000 $1,161,750 $1,041,000 5 5 101% 21 13 $9,821,000 $755,462 $770,000 48 30 104% 10 3 $2,020,000 $673,333 $655,000 19 13 98% 9 1 $770,000 $770,000 $770,000 2 1 103% 11 9 $7,031,000 $781,222 $791,000 27 16 106% 11 6 $4,683,000 $780,500 $784,000 20 13 113% 8 1 $700,000 $700,000 $700,000 3 1 100% 12 0 - - - 3 3 - - 5 $3,983,000 $796,600 $808,000 14 9 115% 7 36 $36,915,000 $1,025,417 $1,024,000 157 113 105% 11 0 - - - 3 3 - - 0 - - - 0 0 - - 0 - - - 0 0 - - 1 $820,000 $820,000 $820,000 0 0 99% 18 22 $22,608,000 $1,027,636 $1,015,500 118 87 105% 10 0 - - - 0 1 - - 10 $11,007,000 $1,100,700 $1,107,500 21 14 104% 11 3 $2,480,000 $826,667 $826,000 12 7 106% 7 0 - - - 3 1 - - 35 $19,111,412 $546,040 $550,000 71 29 107% 9 5 $3,010,000 $602,000 $585,000 10 5 110% 14 0 - - - 0 0 - - 17 $8,837,900 $519,876 $530,000 34 12 107% 7 4 $1,863,000 $465,750 $472,500 13 5 101% 13 0 - - - 1 3 - - 1 $490,000 $490,000 $490,000 0 0 109% 6 4 $2,402,512 $600,628 $616,940 3 1 104% 6 4 $2,508,000 $627,000 $629,000 10 3 107% 9 0 - - - 1 0 - - 0 - - - 1 0 - - 18 $9,248,500 $513,806 $505,250 29 26 101% 13 0 - - - 0 0 - - 2 $1,230,000 $615,000 $650,000 12 11 104% 14 8 $4,044,000 $505,500 $495,000 7 11 99% 19 0 - - - 5 3 - - 8 $3,974,500 $496,813 $505,250 5 1 103% 7 1 1 1 1 2 3 4 5
- 16. Toronto Real Estate Board Market Watch, May 2017 SUMMARY OF EXISTING HOME TRANSACTIONS LINK, MAY 2017 CITY OF TORONTO MUNICIPAL BREAKDOWN 16 Sales Dollar Volume Average Price Median Price New Listings Active Listings Avg. SP / LP Avg. DOM TREB Total City of Toronto Total Toronto West Toronto W01 Toronto W02 Toronto W03 Toronto W04 Toronto W05 Toronto W06 Toronto W07 Toronto W08 Toronto W09 Toronto W10 Toronto Central Toronto C01 Toronto C02 Toronto C03 Toronto C04 Toronto C06 Toronto C07 Toronto C08 Toronto C09 Toronto C10 Toronto C11 Toronto C12 Toronto C13 Toronto C14 Toronto C15 Toronto East Toronto E01 Toronto E02 Toronto E03 Toronto E04 Toronto E05 Toronto E06 Toronto E07 Toronto E08 Toronto E09 Toronto E10 Toronto E11 113 $85,080,912 $752,928 $678,000 336 218 105% 11 6 $4,683,000 $780,500 $784,000 20 13 113% 8 1 $700,000 $700,000 $700,000 3 1 100% 12 0 - - - 0 0 - - 0 - - - 0 0 - - 0 - - - 0 0 - - 0 - - - 1 1 - - 0 - - - 1 0 - - 0 - - - 0 0 - - 0 - - - 0 0 - - 0 - - - 0 0 - - 1 $700,000 $700,000 $700,000 0 0 100% 12 0 - - - 1 0 - - 0 - - - 3 3 - - 0 - - - 0 0 - - 0 - - - 0 0 - - 0 - - - 0 0 - - 0 - - - 0 0 - - 0 - - - 0 0 - - 0 - - - 1 1 - - 0 - - - 0 0 - - 0 - - - 0 0 - - 0 - - - 0 0 - - 0 - - - 0 0 - - 0 - - - 0 0 - - 0 - - - 0 0 - - 0 - - - 1 1 - - 0 - - - 1 1 - - 5 $3,983,000 $796,600 $808,000 14 9 115% 7 0 - - - 0 0 - - 0 - - - 0 0 - - 0 - - - 0 0 - - 0 - - - 0 0 - - 1 $840,000 $840,000 $840,000 1 1 104% 9 0 - - - 0 0 - - 3 $2,483,000 $827,667 $808,000 11 7 121% 6 0 - - - 0 0 - - 0 - - - 0 0 - - 0 - - - 0 0 - - 1 $660,000 $660,000 $660,000 2 1 110% 8 1 1 1 1 2 3 4 5
- 17. Toronto Real Estate Board Market Watch, May 2017 SUMMARY OF EXISTING HOME TRANSACTIONS ATTACHED/ROW/TOWNHOUSE, MAY 2017 ALL TREB AREAS 17 Sales Dollar Volume Average Price Median Price New Listings Active Listings Avg. SP / LP Avg. DOM TREB Total Halton Region Burlington Halton Hills Milton Oakville Peel Region Brampton Caledon Mississauga City of Toronto Toronto West Toronto Central Toronto East York Region Aurora E. Gwillimbury Georgina King Markham Newmarket Richmond Hill Vaughan Whitchurch-Stouffville Durham Region Ajax Brock Clarington Oshawa Pickering Scugog Uxbridge Whitby Dufferin County Orangeville Simcoe County Adjala-Tosorontio Bradford West GwillimburyEssa Innisfil New Tecumseth 802 $583,638,442 $727,729 $664,500 2,247 1,422 105% 10 155 $110,566,104 $713,330 $650,000 392 247 103% 10 24 $15,678,600 $653,275 $637,400 50 30 101% 10 10 $5,976,000 $597,600 $633,750 14 6 104% 11 68 $42,485,116 $624,781 $618,750 160 91 104% 8 53 $46,426,388 $875,970 $820,000 168 120 103% 12 148 $95,733,816 $646,850 $650,000 471 290 105% 9 106 $65,788,528 $620,646 $623,000 328 203 105% 9 12 $7,951,500 $662,625 $667,500 43 22 102% 10 30 $21,993,788 $733,126 $706,500 100 65 105% 8 119 $116,626,032 $980,051 $900,000 311 184 107% 10 31 $29,321,067 $945,841 $918,065 73 37 107% 12 41 $50,383,065 $1,228,855 $1,080,000 118 82 106% 10 47 $36,921,900 $785,572 $748,000 120 65 108% 10 178 $152,205,862 $855,089 $839,600 653 481 105% 11 14 $10,064,600 $718,900 $682,800 49 31 106% 13 6 $3,819,850 $636,642 $627,425 14 11 101% 20 6 $3,207,500 $534,583 $527,500 20 18 103% 7 3 $3,115,000 $1,038,333 $1,050,000 12 7 104% 23 45 $40,735,900 $905,242 $888,000 153 122 105% 11 15 $11,087,300 $739,153 $725,000 59 44 105% 8 32 $30,401,500 $950,047 $935,000 143 105 107% 9 48 $42,790,412 $891,467 $847,500 154 112 106% 10 9 $6,983,800 $775,978 $768,800 49 31 103% 13 152 $83,806,163 $551,356 $544,950 326 163 109% 8 36 $21,232,700 $589,797 $598,700 87 48 106% 8 1 $425,000 $425,000 $425,000 1 0 115% 9 38 $17,643,300 $464,297 $449,500 57 20 114% 8 16 $7,734,750 $483,422 $477,500 44 28 105% 8 21 $13,346,000 $635,524 $605,000 47 27 105% 12 0 - - - 0 0 - - 1 $723,000 $723,000 $723,000 4 2 121% 7 39 $22,701,413 $582,088 $580,000 86 38 110% 7 19 $8,900,677 $468,457 $470,000 27 9 104% 11 19 $8,900,677 $468,457 $470,000 27 9 104% 11 31 $15,799,788 $509,671 $477,000 67 48 102% 9 0 - - - 0 0 - - 9 $5,804,000 $644,889 $650,000 23 11 103% 6 4 $1,648,888 $412,222 $392,944 12 8 101% 11 7 $3,280,900 $468,700 $487,000 11 14 101% 11 11 $5,066,000 $460,545 $465,000 21 15 103% 10 1 1 1 1 2 3 4 5
- 18. Toronto Real Estate Board Market Watch, May 2017 SUMMARY OF EXISTING HOME TRANSACTIONS ATTACHED/ROW/TOWNHOUSE, MAY 2017 CITY OF TORONTO MUNICIPAL BREAKDOWN 18 Sales Dollar Volume Average Price Median Price New Listings Active Listings Avg. SP / LP Avg. DOM TREB Total City of Toronto Total Toronto West Toronto W01 Toronto W02 Toronto W03 Toronto W04 Toronto W05 Toronto W06 Toronto W07 Toronto W08 Toronto W09 Toronto W10 Toronto Central Toronto C01 Toronto C02 Toronto C03 Toronto C04 Toronto C06 Toronto C07 Toronto C08 Toronto C09 Toronto C10 Toronto C11 Toronto C12 Toronto C13 Toronto C14 Toronto C15 Toronto East Toronto E01 Toronto E02 Toronto E03 Toronto E04 Toronto E05 Toronto E06 Toronto E07 Toronto E08 Toronto E09 Toronto E10 Toronto E11 802 $583,638,442 $727,729 $664,500 2,247 1,422 105% 10 119 $116,626,032 $980,051 $900,000 311 184 107% 10 31 $29,321,067 $945,841 $918,065 73 37 107% 12 3 $3,553,000 $1,184,333 $1,175,000 9 5 116% 34 8 $8,673,067 $1,084,133 $1,060,000 16 8 109% 10 1 $520,000 $520,000 $520,000 5 3 100% 6 3 $1,947,000 $649,000 $647,000 4 3 98% 15 3 $2,157,000 $719,000 $692,000 6 2 108% 4 7 $6,384,000 $912,000 $888,888 15 8 104% 8 0 - - - 3 2 - - 5 $5,449,000 $1,089,800 $999,000 10 3 105% 7 0 - - - 1 0 - - 1 $638,000 $638,000 $638,000 4 3 100% 33 41 $50,383,065 $1,228,855 $1,080,000 118 82 106% 10 18 $21,029,370 $1,168,298 $1,035,500 48 31 107% 10 6 $10,630,000 $1,771,667 $1,514,500 16 8 112% 6 0 - - - 0 1 - - 1 $930,000 $930,000 $930,000 2 2 98% 27 0 - - - 2 1 - - 1 $1,288,000 $1,288,000 $1,288,000 7 6 100% 7 7 $7,119,900 $1,017,129 $915,000 22 20 100% 14 0 - - - 0 0 - - 3 $4,062,995 $1,354,332 $1,400,000 2 0 111% 9 0 - - - 1 2 - - 0 - - - 0 0 - - 4 $4,037,800 $1,009,450 $1,064,900 7 2 104% 5 1 $1,285,000 $1,285,000 $1,285,000 11 9 93% 7 0 - - - 0 0 - - 47 $36,921,900 $785,572 $748,000 120 65 108% 10 11 $11,321,000 $1,029,182 $975,000 26 11 113% 10 6 $5,856,500 $976,083 $900,000 14 6 102% 8 2 $1,325,000 $662,500 $662,500 8 3 111% 9 7 $4,840,000 $691,429 $685,000 10 3 104% 15 0 - - - 2 1 - - 0 - - - 0 0 - - 0 - - - 2 2 - - 4 $2,730,500 $682,625 $637,750 11 10 110% 13 0 - - - 4 3 - - 3 $1,963,300 $654,433 $711,800 14 10 107% 8 14 $8,885,600 $634,686 $588,000 29 16 108% 9 1 1 1 1 2 3 4 5
- 19. Toronto Real Estate Board Market Watch, May 2017 SUMMARY OF EXISTING HOME TRANSACTIONS CO-OP APARTMENT, MAY 2017 ALL TREB AREAS 19 Sales Dollar Volume Average Price Median Price New Listings Active Listings Avg. SP / LP Average DOM TREB Total Halton Region Burlington Halton Hills Milton Oakville Peel Region Brampton Caledon Mississauga City of Toronto Toronto West Toronto Central Toronto East York Region Aurora E. Gwillimbury Georgina King Markham Newmarket Richmond Hill Vaughan Whitchurch-Stouffville Durham Region Ajax Brock Clarington Oshawa Pickering Scugog Uxbridge Whitby Dufferin County Orangeville Simcoe County Adjala-Tosorontio Bradford West GwillimburyEssa Innisfil New Tecumseth 14 $9,544,186 $681,728 $585,000 17 14 114% 15 1 $778,000 $778,000 $778,000 0 0 101% 5 0 - - - 0 0 - - 0 - - - 0 0 - - 0 - - - 0 0 - - 1 $778,000 $778,000 $778,000 0 0 101% 5 0 - - - 1 1 - - 0 - - - 1 1 - - 0 - - - 0 0 - - 0 - - - 0 0 - - 13 $8,766,186 $674,322 $520,000 16 13 115% 16 0 - - - 5 6 - - 12 $8,538,186 $711,516 $585,000 9 6 116% 17 1 $228,000 $228,000 $228,000 2 1 99% 11 0 - - - 0 0 - - 0 - - - 0 0 - - 0 - - - 0 0 - - 0 - - - 0 0 - - 0 - - - 0 0 - - 0 - - - 0 0 - - 0 - - - 0 0 - - 0 - - - 0 0 - - 0 - - - 0 0 - - 0 - - - 0 0 - - 0 - - - 0 0 - - 0 - - - 0 0 - - 0 - - - 0 0 - - 0 - - - 0 0 - - 0 - - - 0 0 - - 0 - - - 0 0 - - 0 - - - 0 0 - - 0 - - - 0 0 - - 0 - - - 0 0 - - 0 - - - 0 0 - - 0 - - - 0 0 - - 0 - - - 0 0 - - 0 - - - 0 0 - - 0 - - - 0 0 - - 0 - - - 0 0 - - 0 - - - 0 0 - - 0 - - - 0 0 - - 1 1 1 1 2 3 4 5
- 20. Toronto Real Estate Board Market Watch, May 2017 SUMMARY OF EXISTING HOME TRANSACTIONS CO-OP APARTMENT, MAY 2017 CITY OF TORONTO MUNICIPAL BREAKDOWN 20 Sales Dollar Volume Average Price Median Price New Listings Active Listings Avg. SP / LP Avg. DOM TREB Total City of Toronto Total Toronto West Toronto W01 Toronto W02 Toronto W03 Toronto W04 Toronto W05 Toronto W06 Toronto W07 Toronto W08 Toronto W09 Toronto W10 Toronto Central Toronto C01 Toronto C02 Toronto C03 Toronto C04 Toronto C06 Toronto C07 Toronto C08 Toronto C09 Toronto C10 Toronto C11 Toronto C12 Toronto C13 Toronto C14 Toronto C15 Toronto East Toronto E01 Toronto E02 Toronto E03 Toronto E04 Toronto E05 Toronto E06 Toronto E07 Toronto E08 Toronto E09 Toronto E10 Toronto E11 14 $9,544,186 $681,728 $585,000 17 14 114% 15 13 $8,766,186 $674,322 $520,000 16 13 115% 16 0 - - - 5 6 - - 0 - - - 0 0 - - 0 - - - 1 1 - - 0 - - - 0 0 - - 0 - - - 0 0 - - 0 - - - 1 1 - - 0 - - - 0 0 - - 0 - - - 0 0 - - 0 - - - 1 2 - - 0 - - - 2 2 - - 0 - - - 0 0 - - 12 $8,538,186 $711,516 $585,000 9 6 116% 17 2 $965,000 $482,500 $482,500 4 2 106% 9 1 $395,000 $395,000 $395,000 1 1 100% 20 3 $1,001,000 $333,667 $249,000 0 0 94% 20 1 $175,205 $175,205 $175,205 1 1 104% 38 0 - - - 0 0 - - 0 - - - 0 0 - - 0 - - - 0 0 - - 5 $6,001,981 $1,200,396 $1,255,000 3 2 124% 13 0 - - - 0 0 - - 0 - - - 0 0 - - 0 - - - 0 0 - - 0 - - - 0 0 - - 0 - - - 0 0 - - 0 - - - 0 0 - - 1 $228,000 $228,000 $228,000 2 1 99% 11 0 - - - 0 0 - - 0 - - - 1 0 - - 1 $228,000 $228,000 $228,000 0 0 99% 11 0 - - - 0 0 - - 0 - - - 0 0 - - 0 - - - 0 0 - - 0 - - - 1 1 - - 0 - - - 0 0 - - 0 - - - 0 0 - - 0 - - - 0 0 - - 0 - - - 0 0 - - 1 1 1 1 2 3 4 5
- 21. Toronto Real Estate Board Market Watch, May 2017 SUMMARY OF EXISTING HOME TRANSACTIONS DETACHED CONDOMINIUM, MAY 2017 ALL TREB AREAS 21 Sales Dollar Volume Average Price Median Price New Listings Active Listings Avg. SP / LP Avg. DOM TREB Total Halton Region Burlington Halton Hills Milton Oakville Peel Region Brampton Caledon Mississauga City of Toronto Toronto West Toronto Central Toronto East York Region Aurora E. Gwillimbury Georgina King Markham Newmarket Richmond Hill Vaughan Whitchurch-Stouffville Durham Region Ajax Brock Clarington Oshawa Pickering Scugog Uxbridge Whitby Dufferin County Orangeville Simcoe County Adjala-Tosorontio Bradford West GwillimburyEssa Innisfil New Tecumseth 7 $5,798,936 $828,419 $750,000 16 14 112% 8 1 $575,000 $575,000 $575,000 1 2 144% 6 1 $575,000 $575,000 $575,000 0 1 144% 6 0 - - - 0 0 - - 0 - - - 0 0 - - 0 - - - 1 1 - - 0 - - - 1 1 - - 0 - - - 0 0 - - 0 - - - 0 0 - - 0 - - - 1 1 - - 0 - - - 0 0 - - 0 - - - 0 0 - - 0 - - - 0 0 - - 0 - - - 0 0 - - 1 $1,513,436 $1,513,436 $1,513,436 2 1 126% 5 0 - - - 0 0 - - 0 - - - 0 0 - - 0 - - - 0 0 - - 0 - - - 0 0 - - 1 $1,513,436 $1,513,436 $1,513,436 1 0 126% 5 0 - - - 0 0 - - 0 - - - 0 0 - - 0 - - - 1 1 - - 0 - - - 0 0 - - 0 - - - 0 0 - - 0 - - - 0 0 - - 0 - - - 0 0 - - 0 - - - 0 0 - - 0 - - - 0 0 - - 0 - - - 0 0 - - 0 - - - 0 0 - - 0 - - - 0 0 - - 0 - - - 0 0 - - 0 - - - 0 0 - - 0 - - - 0 0 - - 5 $3,710,500 $742,100 $750,000 12 10 104% 9 0 - - - 0 0 - - 0 - - - 0 0 - - 0 - - - 0 0 - - 0 - - - 0 0 - - 5 $3,710,500 $742,100 $750,000 12 10 104% 9 1 1 1 1 2 3 4 5
- 22. Toronto Real Estate Board Market Watch, May 2017 SUMMARY OF EXISTING HOME TRANSACTIONS DETACHED CONDOMINIUM, MAY 2017 CITY OF TORONTO MUNICIPAL BREAKDOWN 22 Sales Dollar Volume Average Price Median Price New Listings Active Listings Avg. SP / LP Avg. DOM TREB Total City of Toronto Total Toronto West Toronto W01 Toronto W02 Toronto W03 Toronto W04 Toronto W05 Toronto W06 Toronto W07 Toronto W08 Toronto W09 Toronto W10 Toronto Central Toronto C01 Toronto C02 Toronto C03 Toronto C04 Toronto C06 Toronto C07 Toronto C08 Toronto C09 Toronto C10 Toronto C11 Toronto C12 Toronto C13 Toronto C14 Toronto C15 Toronto East Toronto E01 Toronto E02 Toronto E03 Toronto E04 Toronto E05 Toronto E06 Toronto E07 Toronto E08 Toronto E09 Toronto E10 Toronto E11 7 $5,798,936 $828,419 $750,000 16 14 112% 8 0 - - - 0 0 - - 0 - - - 0 0 - - 0 - - - 0 0 - - 0 - - - 0 0 - - 0 - - - 0 0 - - 0 - - - 0 0 - - 0 - - - 0 0 - - 0 - - - 0 0 - - 0 - - - 0 0 - - 0 - - - 0 0 - - 0 - - - 0 0 - - 0 - - - 0 0 - - 0 - - - 0 0 - - 0 - - - 0 0 - - 0 - - - 0 0 - - 0 - - - 0 0 - - 0 - - - 0 0 - - 0 - - - 0 0 - - 0 - - - 0 0 - - 0 - - - 0 0 - - 0 - - - 0 0 - - 0 - - - 0 0 - - 0 - - - 0 0 - - 0 - - - 0 0 - - 0 - - - 0 0 - - 0 - - - 0 0 - - 0 - - - 0 0 - - 0 - - - 0 0 - - 0 - - - 0 0 - - 0 - - - 0 0 - - 0 - - - 0 0 - - 0 - - - 0 0 - - 0 - - - 0 0 - - 0 - - - 0 0 - - 0 - - - 0 0 - - 0 - - - 0 0 - - 0 - - - 0 0 - - 0 - - - 0 0 - - 0 - - - 0 0 - - 1 1 1 1 2 3 4 5
- 23. Toronto Real Estate Board Market Watch, May 2017 SUMMARY OF EXISTING HOME TRANSACTIONS CO-OWNERSHIP APARTMENT, MAY 2017 ALL TREB AREAS 23 Sales Dollar Volume Average Price Median Price New Listings Active Listings Avg. SP / LP Avg. DOM TREB Total Halton Region Burlington Halton Hills Milton Oakville Peel Region Brampton Caledon Mississauga City of Toronto Toronto West Toronto Central Toronto East York Region Aurora E. Gwillimbury Georgina King Markham Newmarket Richmond Hill Vaughan Whitchurch-Stouffville Durham Region Ajax Brock Clarington Oshawa Pickering Scugog Uxbridge Whitby Dufferin County Orangeville Simcoe County Adjala-Tosorontio Bradford West GwillimburyEssa Innisfil New Tecumseth 8 $2,659,000 $332,375 $344,500 8 8 100% 21 0 - - - 0 0 - - 0 - - - 0 0 - - 0 - - - 0 0 - - 0 - - - 0 0 - - 0 - - - 0 0 - - 0 - - - 0 0 - - 0 - - - 0 0 - - 0 - - - 0 0 - - 0 - - - 0 0 - - 8 $2,659,000 $332,375 $344,500 8 8 100% 21 0 - - - 1 1 - - 8 $2,659,000 $332,375 $344,500 7 5 100% 21 0 - - - 0 2 - - 0 - - - 0 0 - - 0 - - - 0 0 - - 0 - - - 0 0 - - 0 - - - 0 0 - - 0 - - - 0 0 - - 0 - - - 0 0 - - 0 - - - 0 0 - - 0 - - - 0 0 - - 0 - - - 0 0 - - 0 - - - 0 0 - - 0 - - - 0 0 - - 0 - - - 0 0 - - 0 - - - 0 0 - - 0 - - - 0 0 - - 0 - - - 0 0 - - 0 - - - 0 0 - - 0 - - - 0 0 - - 0 - - - 0 0 - - 0 - - - 0 0 - - 0 - - - 0 0 - - 0 - - - 0 0 - - 0 - - - 0 0 - - 0 - - - 0 0 - - 0 - - - 0 0 - - 0 - - - 0 0 - - 0 - - - 0 0 - - 0 - - - 0 0 - - 1 1 1 1 2 3 4 5
- 24. Toronto Real Estate Board Market Watch, May 2017 SUMMARY OF EXISTING HOME TRANSACTIONS CO-OWNERSHIP APARTMENT, MAY 2017 CITY OF TORONTO MUNICIPAL BREAKDOWN 24 Sales Dollar Volume Average Price Median Price New Listings Active Listings Avg. SP / LP Avg. DOM TREB Total City of Toronto Total Toronto West Toronto W01 Toronto W02 Toronto W03 Toronto W04 Toronto W05 Toronto W06 Toronto W07 Toronto W08 Toronto W09 Toronto W10 Toronto Central Toronto C01 Toronto C02 Toronto C03 Toronto C04 Toronto C06 Toronto C07 Toronto C08 Toronto C09 Toronto C10 Toronto C11 Toronto C12 Toronto C13 Toronto C14 Toronto C15 Toronto East Toronto E01 Toronto E02 Toronto E03 Toronto E04 Toronto E05 Toronto E06 Toronto E07 Toronto E08 Toronto E09 Toronto E10 Toronto E11 8 $2,659,000 $332,375 $344,500 8 8 100% 21 8 $2,659,000 $332,375 $344,500 8 8 100% 21 0 - - - 1 1 - - 0 - - - 0 0 - - 0 - - - 0 0 - - 0 - - - 0 0 - - 0 - - - 0 0 - - 0 - - - 1 1 - - 0 - - - 0 0 - - 0 - - - 0 0 - - 0 - - - 0 0 - - 0 - - - 0 0 - - 0 - - - 0 0 - - 8 $2,659,000 $332,375 $344,500 7 5 100% 21 0 - - - 0 0 - - 1 $354,000 $354,000 $354,000 1 1 98% 53 1 $270,000 $270,000 $270,000 1 1 104% 28 2 $734,000 $367,000 $367,000 1 1 97% 20 0 - - - 0 0 - - 0 - - - 0 0 - - 3 $970,000 $323,333 $345,000 3 1 101% 14 0 - - - 0 0 - - 0 - - - 0 0 - - 0 - - - 0 0 - - 0 - - - 0 0 - - 0 - - - 1 1 - - 1 $331,000 $331,000 $331,000 0 0 100% 3 0 - - - 0 0 - - 0 - - - 0 2 - - 0 - - - 0 0 - - 0 - - - 0 2 - - 0 - - - 0 0 - - 0 - - - 0 0 - - 0 - - - 0 0 - - 0 - - - 0 0 - - 0 - - - 0 0 - - 0 - - - 0 0 - - 0 - - - 0 0 - - 0 - - - 0 0 - - 0 - - - 0 0 - - 1 1 1 1 2 3 4 5
- 25. Toronto Real Estate Board Market Watch, May 2017 FOCUS ON THE MLS HOME PRICE INDEX INDEX AND BENCHMARK PRICE, MAY 2017 ALL TREB AREAS 25 Composite Single-Family Detached Single-Family Attached Townhouse Apartment Index Benchmark Yr./Yr. % Chg. Index Benchmark Yr./Yr. % Chg. Index Benchmark Yr./Yr. % Chg. Index Benchmark Yr./Yr. % Chg. Index Benchmark Yr./Yr. % Chg. TREB Total Halton Region Burlington Halton Hills Milton Oakville Peel Region Brampton Caledon Mississauga City of Toronto York Region Aurora East Gwillimbury Georgina King Markham Newmarket Richmond Hill Vaughan Whitchurch-Stouffville Durham Region Ajax Brock Clarington Oshawa Pickering Scugog Uxbridge Whitby Dufferin County Orangeville Simcoe County Adjala-Tosorontio Bradford West GwillimburyEssa Innisfil New Tecumseth 268.8 $821,400 28.98% 280.7 $1,049,500 28.76% 280.1 $789,900 26.23% 258.8 $580,200 30.25% 231.4 $464,600 31.85% 279.5 $957,700 28.39% 280.8 $1,070,600 28.10% 280.1 $744,800 28.07% 274.2 $555,600 30.01% - - - 270.3 $821,800 26.49% 270.3 $966,000 26.01% 265.4 $661,400 24.08% 275.2 $565,400 29.93% - - - 256.8 $795,000 24.84% 252.9 $847,900 24.15% 264.0 $661,400 26.68% 275.4 $490,000 28.63% - - - 262.5 $787,800 27.37% 260.5 $911,800 27.20% 271.2 $684,500 27.98% 252.7 $443,300 29.59% - - - 296.9 $1,135,600 29.09% 297.8 $1,262,600 28.64% 299.7 $837,100 29.07% 277.0 $660,100 29.80% - - - 256.9 $728,800 29.88% 260.8 $918,200 28.85% 262.3 $671,600 28.39% 257.3 $552,900 32.49% 227.9 $394,000 33.27% 258.7 $657,200 32.26% 256.6 $748,500 31.79% 261.2 $612,800 30.99% 253.4 $465,200 35.58% 201.0 $314,700 34.09% 238.2 $850,300 32.48% 240.2 $882,600 33.52% 261.7 $646,500 30.52% - - - - - - 257.1 $763,100 27.91% 269.8 $1,077,600 24.79% 263.9 $727,800 25.07% 258.5 $581,000 31.62% 232.3 $408,900 32.97% 255.6 $830,300 26.10% 280.1 $1,228,500 24.82% 278.5 $928,200 22.10% 256.0 $628,100 27.05% 231.8 $477,600 31.03% 307.6 $1,052,000 29.19% 319.3 $1,244,100 30.17% 311.5 $901,600 26.37% 246.3 $631,700 18.87% 232.3 $511,000 33.97% 306.0 $982,100 33.04% 312.4 $1,161,200 34.02% 304.7 $787,800 29.83% 230.0 $584,100 29.00% 230.4 $477,100 27.93% 278.2 $891,400 35.77% 280.2 $921,900 37.42% 238.8 $549,100 22.15% - - - - - - 288.0 $598,000 42.08% 301.7 $624,300 42.58% 295.9 $583,400 35.80% - - - - - - 275.2 $1,151,900 30.12% 276.1 $1,148,600 29.87% 284.3 $665,800 28.64% - - - - - - 318.7 $1,104,800 28.25% 343.1 $1,411,500 29.28% 319.4 $955,200 25.25% 245.1 $623,000 15.34% 242.6 $587,600 40.15% 285.6 $842,100 30.29% 292.8 $986,900 31.18% 289.1 $680,900 26.63% 261.0 $530,800 27.01% 232.2 $391,600 25.11% 332.1 $1,201,100 30.85% 366.0 $1,555,400 32.61% 335.8 $1,020,600 29.25% 226.9 $628,000 15.65% 219.9 $456,700 29.13% 290.3 $1,048,600 26.22% 287.0 $1,193,000 26.26% 302.5 $916,300 23.87% 273.6 $744,700 22.03% 231.9 $516,400 32.51% 310.4 $1,091,000 29.55% 309.3 $1,113,700 29.31% 276.4 $759,200 29.28% - - - - - - 262.8 $615,200 33.33% 259.0 $673,400 32.75% 272.9 $545,100 30.82% 256.0 $415,900 39.21% 236.5 $424,700 43.42% 272.3 $671,800 29.60% 269.8 $723,200 30.34% 281.7 $605,700 28.45% 262.2 $479,200 33.98% 223.7 $379,400 43.67% 202.2 $367,800 29.70% 203.4 $371,200 29.89% - - - - - - - - - 256.2 $540,700 32.88% 247.8 $596,800 31.88% 257.1 $491,100 25.35% 259.7 $406,500 43.72% 246.9 $349,400 47.40% 266.4 $509,700 37.89% 261.1 $556,300 36.42% 283.2 $475,600 37.94% 254.9 $343,700 52.91% 221.1 $269,100 39.41% 262.2 $706,000 30.19% 260.2 $814,500 27.80% 267.5 $623,300 27.14% 267.7 $478,000 34.12% 253.8 $500,600 46.62% 230.6 $602,100 30.87% 237.7 $615,800 31.40% 221.7 $464,000 25.61% - - - - - - 237.1 $724,700 28.37% 235.6 $727,500 28.25% 233.3 $572,500 29.76% - - - - - - 267.8 $698,100 34.30% 270.0 $776,500 34.33% 272.1 $599,400 32.67% 230.2 $419,200 25.59% 225.3 $433,500 41.25% 259.3 $594,400 34.91% 271.0 $617,600 34.56% 254.0 $476,000 36.05% - - - - - - 259.3 $594,400 34.91% 271.0 $617,600 34.56% 254.0 $476,000 36.05% - - - - - - 261.7 $560,600 36.73% 252.9 $563,700 36.85% 264.3 $502,600 33.28% - - - - - - 202.6 $719,000 31.47% 202.6 $719,000 31.47% - - - - - - - - - 294.5 $727,900 34.60% 267.7 $816,600 34.39% 296.2 $615,800 32.83% - - - - - - 250.8 $573,300 35.86% 242.3 $595,600 34.09% 248.8 $423,800 36.55% - - - - - - 259.6 $477,300 40.25% 259.8 $478,200 39.90% 263.1 $409,300 34.23% - - - - - - 230.6 $533,800 34.46% 225.3 $580,800 34.59% 234.0 $446,900 31.09% - - - - - -
- 26. Toronto Real Estate Board Market Watch, May 2017 FOCUS ON THE MLS HOME PRICE INDEX INDEX AND BENCHMARK PRICE, MAY 2017 CITY OF TORONTO 26 Composite Single-Family Detached Single-Family Attached Townhouse Apartment Index Benchmark Yr./Yr. % Chg. Index Benchmark Yr./Yr. % Chg. Index Benchmark Yr./Yr. % Chg. Index Benchmark Yr./Yr. % Chg. Index Benchmark Yr./Yr. % Chg. TREB Total City of Toronto Toronto W01 Toronto W02 Toronto W03 Toronto W04 Toronto W05 Toronto W06 Toronto W07 Toronto W08 Toronto W09 Toronto W10 Toronto C01 Toronto C02 Toronto C03 Toronto C04 Toronto C06 Toronto C07 Toronto C08 Toronto C09 Toronto C10 Toronto C11 Toronto C12 Toronto C13 Toronto C14 Toronto C15 Toronto E01 Toronto E02 Toronto E03 Toronto E04 Toronto E05 Toronto E06 Toronto E07 Toronto E08 Toronto E09 Toronto E10 Toronto E11 269 $821,400 28.98% 281 $1,049,500 28.76% 280 $789,900 26.23% 259 $580,200 30.25% 231 $464,600 31.85% 256 $830,300 26.10% 280 $1,228,500 24.82% 279 $928,200 22.10% 256 $628,100 27.05% 232 $477,600 31.03% 205 $828,000 15.00% 218 $1,135,400 9.13% 240 $923,500 9.66% 228 $482,900 15.44% 187 $436,600 24.62% 251 $910,600 11.23% 260 $1,094,000 8.28% 301 $922,000 10.51% 194 $576,400 16.68% 192 $756,700 24.79% 281 $730,600 24.90% 294 $799,500 26.44% 285 $729,000 21.68% 162 $393,200 19.35% 200 $382,800 27.81% 246 $630,900 25.72% 263 $829,600 26.27% 239 $691,700 17.95% 207 $490,800 13.96% 218 $319,700 31.82% 226 $528,900 23.12% 251 $830,800 22.25% 229 $669,200 21.01% 224 $363,300 24.05% 201 $264,400 28.97% 205 $599,200 22.37% 292 $933,600 30.30% 231 $699,700 20.14% 290 $861,000 37.46% 154 $390,500 24.47% 247 $1,057,300 28.75% 264 $1,145,900 27.30% 229 $939,800 17.06% 197 $724,900 34.61% 150 $609,100 29.82% 214 $852,900 26.13% 229 $1,196,500 21.24% 221 $819,500 14.43% 232 $557,000 33.03% 201 $414,200 32.59% 230 $579,700 22.24% 242 $903,600 18.72% 208 $597,000 14.51% 240 $623,400 25.77% 210 $269,900 29.64% 240 $552,600 32.21% 251 $753,900 25.46% 252 $645,900 26.33% 197 $415,900 22.51% 237 $329,400 49.28% 259 $643,200 25.80% 281 $1,060,300 17.19% 273 $953,000 13.21% 254 $739,000 26.16% 257 $534,600 27.82% 254 $1,215,200 19.50% 247 $1,955,700 23.33% 284 $1,486,800 21.99% 239 $1,112,700 9.75% 234 $665,800 19.23% 298 $1,555,800 27.92% 289 $1,774,700 28.52% 306 $1,135,800 26.67% - - - 302 $794,900 26.34% 256 $1,574,700 23.77% 265 $1,859,700 22.82% 265 $1,240,600 19.96% 259 $968,000 33.97% 213 $492,600 31.73% 294 $1,157,200 28.35% 324 $1,384,300 27.50% 236 $872,300 19.33% - - - 260 $575,300 28.89% 270 $935,600 27.95% 356 $1,630,400 30.55% 256 $914,300 23.73% 214 $628,000 15.41% 220 $537,800 31.54% 249 $654,000 30.59% 276 $1,610,900 17.09% 276 $1,318,600 14.74% 259 $739,300 30.81% 246 $532,600 32.97% 167 $1,176,100 18.84% 146 $1,830,200 14.10% 159 $1,295,500 10.40% 176 $910,000 1.97% 183 $604,700 23.39% 259 $1,003,800 18.66% 280 $1,728,100 16.09% 268 $1,322,500 12.24% 245 $638,900 8.41% 251 $598,700 22.65% 244 $864,900 25.49% 220 $1,495,200 17.07% 244 $1,080,900 14.76% 166 $264,800 22.51% 266 $386,300 32.45% 249 $2,110,000 25.85% 233 $2,496,100 20.49% 306 $1,280,400 24.86% 308 $1,077,200 40.10% 251 $785,700 31.07% 264 $957,700 26.08% 316 $1,683,600 26.99% 277 $884,500 22.87% 273 $790,600 30.60% 214 $429,900 27.77% 277 $923,200 36.38% 366 $1,978,400 34.50% 289 $1,406,300 26.67% 320 $1,080,900 34.13% 244 $614,700 39.73% 269 $877,400 29.40% 381 $1,786,600 38.31% 319 $1,035,800 32.53% 297 $732,000 34.48% 200 $465,300 27.78% 312 $977,800 25.71% 324 $1,142,300 25.07% 332 $1,046,000 27.64% 266 $538,300 18.68% 263 $624,300 25.63% 293 $1,101,300 31.11% 250 $1,138,600 27.24% 302 $1,012,300 31.32% 356 $1,139,100 51.90% 295 $813,900 33.95% 271 $834,500 25.61% 286 $965,600 25.78% 261 $853,400 24.21% - - - 208 $304,700 29.89% 266 $657,000 28.75% 267 $788,400 19.59% 276 $666,000 28.38% 238 $515,600 24.62% 272 $417,100 51.14% 262 $686,200 24.64% 297 $1,046,000 23.65% 293 $807,100 24.69% 270 $587,600 21.71% 209 $411,200 26.07% 279 $776,300 24.38% 283 $808,600 24.11% 284 $676,000 26.54% 251 $619,900 25.66% 242 $506,600 31.06% 268 $656,000 22.58% 305 $999,700 19.80% 296 $774,500 23.73% 275 $595,800 20.09% 230 $394,200 26.34% 263 $634,200 32.59% 276 $858,700 25.91% 243 $629,600 25.72% 246 $502,500 33.73% 245 $390,700 48.69% 251 $598,900 27.81% 275 $780,300 21.59% 260 $635,900 22.18% 278 $517,200 37.36% 224 $419,800 36.21% 285 $799,700 33.63% 282 $902,000 31.05% 271 $702,200 32.42% 322 $562,300 44.12% 212 $341,700 38.47% 262 $572,400 30.59% 288 $801,600 27.69% 280 $633,700 28.47% 198 $389,400 15.21% 255 $381,100 48.66%
- 27. Toronto Real Estate Board Market Watch, May 2017 HISTORIC ANNUAL STATISTICS 27 Year Sales Average Price 2005 2006 2007 2008 2009 2010 2011 2012 2013 2014 2015 84,145 $335,907 83,084 $351,941 93,193 $376,236 74,552 $379,347 87,308 $395,460 85,545 $431,276 89,096 $465,014 85,496 $497,130 87,049 $522,958 92,782 $566,624 101,213 $622,121 2016 MONTHLY STATISTICS NOTES 1 - Sales, dollar volume, average sale prices and median sale prices are based on firm transactions entered into the TREB MLS® system between the first and last day of the month/period being reported. 2 - New listings entered into the TREB MLS® system between the first and last day of the month/period being reported. 3 - Active listings at the end of the last day of the month/period being reported. 4 - Ratio of the average selling price to the average listing price for firm transactions entered into the TREB MLS® system between the first and last day of the month/period being reported. 5 - Average number of days on the market for firm transactions entered into the TREB MLS® system between the first and last day of the month/period being reported. 6 - Due to past changes to TREB's service area, caution should be exercised when making historical comparisons. 7 - Past monthly and year-to-date figures are revised on a monthly basis. 8 - SNLR = Sales-to-New Listings Ratio. Calculated using a 12-month moving average (sales/new listings). 9 - Mos. Inv. = Months of Inventory. Calculated using a 12-month moving average (active listings/sales). 2017 MONTHLY STATISTICS *For historic annual sales and average price data over a longer time frame go to: January February March April May June July August September October November December Year to Date 5,156 $768,373 7,967 $876,773 12,027 $916,908 11,594 $919,614 10,196 $863,910 - - - - - - - - - - - - - - 46,940 $869,116 January February March April May June July August September October November December Annual 4,640 $630,193 7,582 $685,628 10,260 $688,011 12,016 $739,762 12,790 $752,100 12,725 $747,018 9,931 $710,420 9,748 $710,978 9,830 $756,021 9,717 $762,677 8,502 $777,041 5,306 $730,037 113,047 $729,821 1,6,7 1,7 1,7 http://www.torontorealestateboard.com/market_news/market_watch/historic_stats/p df/TREB_historic_statistics.pdf Copyright® 2017 Toronto Real Estate Board $882,93746,940