1. 1
COLORADO DIVISION OF PARKS AND WILDLIFE - AVIAN RESEARCH PROGRAM
Progress Report
April 2012
TITLE: Evaluating relationships between hunting regulations, habitat conditions, and duck
hunting quality on State Wildlife Areas in northeastern Colorado
AUTHORS: J. P. Runge and J. H. Gammonley
PROJECT PERSONNEL: T. Kroening, B. Smith
Period Covered: February 1, 2011– April 30, 2012
All information in this report is preliminary and subject to further evaluation. Information MAY
NOT BE PUBLISHED OR QUOTED without permission of the author. Manipulation of these
data beyond that contained in this report is discouraged.
ABSTRACT
The lower South Platte River (SPR) corridor has historically supported the highest numbers of
wintering ducks and highest hunter numbers and duck harvest of any region in Colorado. There is
concern that harvest pressure has led to reduced numbers of wintering ducks and low harvest success,
particularly on State Wildlife Areas (SWAs), which could in turn lead to lower hunter satisfaction and
declining hunter recruitment and retention. The goal of this study is to determine the extent to which a set
of more restrictive hunting regulations influence duck hunter success, hunter activity, hunter satisfaction,
and duck distribution, compared to a set of less restrictive hunting regulations, on selected SWAs along
the SPR corridor (Figure 1). We will also examine how the influence of regulations on these responses
varies among SWAs with differing habitat conditions. The 2011-2012 regular duck season was the fourth
field season of the project. We selected 3 pairs of SWAs representing different habitat conditions along
the SPR corridor, and assigned 1 SWA in each pair a set of restrictive hunting regulations (hunting access
permitted only on weekends, Wednesdays, and legal holidays; reservations required for a limited number
of parties; and the property is closed to the public after 2 p.m.), with no restrictive regulations on the other
SWA in each pair. We established check stations at each of the SWAs and required all waterfowl and
small game hunters to check out during the regular duck season. We interviewed all waterfowl and small
game hunters and recorded information on their hunting experience and methods, harvest success, and
satisfaction. We also conducted monthly aerial counts of waterfowl along the SPR corridor. During the
2011-2012 duck season, we obtained information from 929 hunting parties on study SWAs, of which 711
were duck hunting parties. Jackson Lake SWA (unrestricted regulations) had the highest use, with 341
duck hunting parties and 737 duck hunter-days, and Overland Trail SWA (unrestricted regulations) had
the lowest use, with 15 duck hunting parties and 35 duck hunter-days. From interview data, season-long
harvest success, measured as average ducks bagged per hunter per day, was greater at restricted areas than
unrestricted areas of similar size and habitat type: season-long harvest success was 4 times greater at
Atwood SWA than Overland trail SWA, 2.7 times greater at Jean K. Tool/Brush SWAs than Bravo SWA,
and 2 times greater at Red Lion SWA than Jackson Lake SWA. Hunting parties’ satisfaction with hunter
crowding levels, habitat conditions, property-specific regulations, and their overall hunt experience
averaged slightly satisfied or satisfied on all study SWAs; hunters tended to be dissatisfied or slightly
satisfied with duck numbers. Numbers of migrating/wintering ducks in the SPR corridor were relatively
high in October and November, and large numbers of ducks used open water in large reservoirs during
January. This study is expected to continue for 2 additional years.
2. 2
EVALUATING RELATIONSHIPS BETWEEN HUNTING REGULATIONS, HABITAT
CONDITIONS, AND DUCK HUNTING QUALITY ON STATE WILDLIFE AREAS IN
NORTHEASTERN COLORADO
Progress Report, February 1, 2011 – April 30, 2012
Jon Runge and Jim Gammonley
PROJECT OBJECTIVES
The goal of this study is to determine the extent to which a set of more restrictive hunting
regulations influence duck hunter success, hunter activity, hunter satisfaction, and duck distribution,
compared to a set of less restrictive hunting regulations, on selected state wildlife areas (SWAs) along the
South Platte River (SPR) corridor. We will also examine how the influence of regulations on these
responses varies among SWAs with differing habitat conditions. Specific objectives include:
1. Compare duck hunter success (ducks bagged per hunter) on selected SWAs with different hunting
regulations and habitat conditions.
Hypothesis 1: Average hunter success will be higher on properties with more restrictive
hunting regulations than on properties with similar habitat conditions where hunting
regulations are less restrictive.
Hypothesis 2: Average hunter success will be lower on properties with more restrictive
hunting regulations than on properties with similar habitat conditions where hunting
regulations are less restrictive.
Hypothesis 3: Differences between the two types of areas will be statistically
indistinguishable.
2. Compare hunter activity (hunter use-days, party size, hunting methods, number of hours per day
when hunters are present on the property) on selected SWAs with different hunting regulations
and habitat conditions.
Hypothesis 1: Properties with more restrictive hunting regulations will have less intensive
use than properties with similar habitat conditions where hunting regulations are less
restrictive.
Hypothesis 2: Differences between the two types of areas will be statistically
indistinguishable.
3. Compare self-reported indices of waterfowl hunter satisfaction on selected SWAs with different
hunting regulations and habitat conditions.
Hypothesis 1: Average indices of hunter satisfaction will be significantly higher on
properties with more restrictive hunting regulations than on properties with similar
habitat conditions where hunting regulations are less restrictive.
Hypothesis 2: Average indices of hunter satisfaction will be lower on properties with
more restrictive hunting regulations than on properties with similar habitat conditions
where hunting regulations are less restrictive.
Hypothesis 3: Differences between the two types of areas will be statistically
indistinguishable.
4. Correlate overall duck numbers, climate data (temperature, precipitation), and indices of habitat
conditions (river flows, percent of area flooded, percent of area frozen) with results from
objectives 1-4.
Prediction: These measures will explain a high proportion of the variation observed over
space and time in the response variables for Objectives 1-4.
3. 3
5. Based on results from objectives 1-4, develop recommendations for future duck hunting
management of SWAs along the South Platte River corridor.
Because the purpose of restrictive regulations is to reduce disturbance to waterfowl on SWAs, it will also
be necessary to restrict activities of other small game hunters. Although not the focus of this study, we
will also measure the harvest, activity, and satisfaction of small game hunters on SWAs along the SPR.
SEGMENT OBJECTIVES
1. Collect information on hunting activities, harvest, and satisfaction levels from all waterfowl and small
game hunting parties on 7 SWAs along the SPR corridor during the 2011-2012 regular duck hunting
season.
2. Conduct periodic aerial surveys of waterfowl numbers and distribution along the SPR corridor
throughout the 2011-2012 regular duck hunting season.
INTRODUCTION
About 50% of Colorado’s annual statewide duck harvest occurs in 5 counties (Logan, Morgan,
Sedgwick, Washington, and Weld) along the lower South Platte River (SPR) corridor in northeastern
Colorado (U.S. Fish and Wildlife Service, unpublished harvest survey results). Over 60% of Colorado
duck hunters hunt in this area, and a majority of these hunters hunt exclusively or regularly on public
lands (Colorado Division of Wildlife 2006). There are 26 State Wildlife Areas (SWAs) located in the
SPR corridor from Greeley to the state line, and duck hunting is a major activity and management
emphasis on many of these areas. The Colorado Division of Parks and Wildlife (CPW) historically has
managed to provide a range of duck hunting opportunities on SWAs along the SPR corridor. Some
properties have no restrictions on hunting beyond the statewide regulations, and the management
emphasis is on maximizing hunting opportunity. On other properties, the CPW has attempted to address
issues of hunting quality in part through property-specific restrictions in hunting regulations. Property-
specific restrictions include requiring reservations for access, day closures (portions of the week when no
hunting is allowed), and assigned areas. Use of hunting restrictions has been largely on an ad hoc,
property-specific basis. No rigorous evaluation has been conducted on the effectiveness of restrictive
hunting regulations on duck distribution or on hunter success, activity, or satisfaction.
Since the 1980s the annual midwinter index of ducks counted in the SPR corridor has averaged
less than half the number counted during the 1970s. The possibility exists that detection probability
decreased over those years, but it is unlikely that it decreased by 50%; thus winter abundance of ducks in
the SPR has likely declined. Although overall duck harvest during 1999-2006 has been comparable to
historic levels, in recent years there have been increasing concerns about the quality of duck hunting
along the SPR corridor, particularly on SWAs. There is a desire to increase wintering populations of
ducks, increase harvest success (i.e., average number of ducks bagged per hunter day), and recruit and
retain more duck hunters. It has been suggested that disturbance from excessive hunting activity along
the SPR corridor has led to decreased use of this area by ducks, poor harvest success, over-crowding and
interference among hunters on public areas, and unsatisfactory experiences for duck hunters. This
concern is supported by the results of a 2005 national duck hunter survey (National Flyway Council and
Wildlife Management Institute 2006), in which 66% of Colorado duck hunters surveyed (n = 488)
reported they believed hunting pressure had become worse compared to 5 years prior to the survey, 65%
of hunters believed crowding was worse at hunting areas, 53% reported more interference from other
hunters, and 50% believed ducks were more concentrated on fewer areas. Dissatisfaction with duck
hunting could in turn result in declining duck hunter recruitment and retention. Concerns over the quality
of duck hunting along the SPR have led to proposals to increase hunting restrictions in this area.
4. 4
Recent monitoring of duck hunter activity and harvest on South Platte SWAs indicates that
patterns of public use and duck harvests are variable among SWAs and on individual SWAs among years.
Voluntary reporting data suggest that average duck harvest/hunter trip was similar between public areas
with restrictive hunting regulations and areas without restrictive regulations in 2004-2005 and 2005-2006,
but higher in unrestricted areas in 2006-2007. Patterns of hunter use and harvest success may vary among
properties in relation to the property size and the habitat types present on the property (e.g., shallow
marsh impoundments, river channels, warm-water sloughs). Harvest success, particularly on properties
adjacent to the river channel, was weather-dependent: harvest success increased during colder, wetter
duck seasons, and within a duck season harvest success was higher when temperatures were colder.
Ducks use large reservoirs that act as refuge areas within the SPR corridor, and ducks often move to
feeding areas after dark. Duck use of the river is limited until low temperatures cause reservoirs to freeze
and the river provides the only available open water.
It is generally acknowledged that disturbance from hunting activity can influence the distribution
of ducks at a variety of spatial scales (Baldassarre and Bolen 1994). Ducks quickly find refuge areas
when hunting seasons begin, and alter their spatial and temporal activity patterns to avoid hunted areas
(Cox and Afton 1998a, Fleskes 2002), although refuge size and habitat conditions may influence their use
and value to waterfowl (Rave and Cordes 1993, Cox and Afton 1998b, Rave 1999, Cox and Afton 1999).
Numerous studies have documented anthropogenic disturbance to waterfowl (Dahlgren and Korschgen
1992, Madsen 1995, Madsen and Fox 1995, Fox and Madsen 1997, Madsen 1998a, 1998b; Evans and
Day 2001, 2002; Pease and Butler 2005). Most studies that examine hunting impacts compare bird use,
usually measured by counts, on sanctuary or refuge areas (i.e., no hunting or other disturbance) to hunted
areas, rather than comparing different levels or types of hunting disturbance. On a Danish wetland where
hunting was permitted only once every 1-3 weeks, Bregnballe and Madsen (2004) determined the
proportion of waterfowl occupying the wetland just prior to hunts that returned within 1-2 days after
hunts, and found that response to hunting disturbance was variable among species and within species in
relation to habitat conditions. Using a similar approach, Bregnballe et al. (2004) concluded that
restricting hunting to the afternoon did not adequately reduce disturbance to maintain bird numbers and
diversity. In addition, most studies focus exclusively on bird responses, but do not document changes in
hunter activity, success, or satisfaction in relation to creation of refuges. Madsen (1998b) noted that
following creation of refuge areas on 2 Danish wetlands, hunter numbers declined on hunted portions of
one area, and numbers did not decline but were redistributed on the other wetland; hunter success was not
reported. Hockin et al. (1992) and Hill et al. (1997) reviewed literature on studies investigating
disturbance to birds from human activity and reported that most results were anecdotal, with only a small
minority of studies having some sort of experimental design that compared control and treatment areas.
They recommended increased use of manipulative studies to more rigorously assess impacts of
disturbance or the effectiveness of controls on disturbance.
Relationships between federal frameworks for hunting (e.g., Flyway-specific season lengths and
bag limits) and resulting duck harvests have been investigated at national and regional scales (Martin and
Carney 1977), but few studies have been conducted to examine the influence of local-scale hunting
regulations on hunter success or satisfaction. Hunting parties were assigned 1 of 3 alternative bag limit
regulations (a 2-bird limit, Flyway-specific regulations, or point system) and their performance and
satisfaction were measured on a state game area during one season in Michigan (Mikula et al. 1972).
However, this study did not examine impacts of regulations other than bag limit restrictions, and variation
across years or among areas was not investigated. During 1963-1970, the CPW, in cooperation with the
U.S. Fish and Wildlife Service, conducted intensive studies examining how local duck populations and
duck hunters responded to various experimental duck hunting regulations in the San Luis Valley (Hopper
et al. 1975). However, this study did not did not directly compare results to more restrictive regulatory
approaches, and did not examine harvest success or hunter satisfaction in relation to hunting regulations at
a more local scale.
5. 5
Given the interest in reducing duck hunting pressure in the SPR corridor, there is a need to
evaluate how more restrictive hunting regulations impact duck numbers and distribution, and hunter
success and satisfaction, at local and regional scales. Here we summarize methods and results from the
first 3 years of a management experiment in SWAs along the SPR corridor that examines this issue.
STUDY AREA AND METHODS
This study is being conducted in the SPR corridor between Greeley and the state line (Fig. 1). On
7 non-randomly selected SWAs (see table below), we are using a quasi-experimental cross-over design to
examine the influence of hunting restrictions on selected response variables. Properties were selected to
represent the range of wetland habitat types on SWAs along the SPR, including areas off the river channel
with shallow, seasonally-flooded wetland impoundments near large reservoirs; small properties on the
river channel that have little other wetland habitat; and larger properties on the river channel that have
more diverse wetland habitats. For each pair of properties with these habitat conditions, each member of
the pair was assigned a different set of hunting regulations. On “Unrestricted” properties, no additional
hunting restrictions are applied for waterfowl and small game hunting beyond the regulations that apply
throughout eastern Colorado. A set of additional regulations are applied to “Restricted” properties,
intended to limit hunting disturbance while still providing some hunting opportunity. These regulations
include: (1) reservations are required for hunting access (a limited number of parties on the property, with
no more than 4 hunters per party); (2) all parties must leave the property by 2 p.m.; (3) hunting is allowed
only on Saturdays, Sundays, Wednesdays, and legal holidays; and (4) hunting parties are assigned to
specific areas on the property. These restrictions apply to waterfowl and small game hunting during the
regular duck hunting season, but not to deer and fall turkey hunting. The study design calls for Restricted
(R) and Unrestricted (U) regulations will be applied to the selected properties for 6 years as described in
the table below. A cross-over design is being used to account for site-specific influences on response
variables for each pair of properties. Note that the crossover began with the 2011-12 duck season.
Hunting Season Regulations
(R = Restricted, U = Unrestricted)
Type State Wildlife Area 2008 2009 2010 2011 2012 2013
Off river channel
Jackson Lake R R R U U U
Red Lion U U U R R R
On-channel
small property
Overland Trail R R R U U U
Atwood U U U R R R
On-channel large
property
Bravo R R R U U U
Jean K. Tool & Brush U U U R R R
Check stations were established at these 7 SWAs, and access to these areas was from designated
parking areas only. During the regular duck hunting season, all waterfowl and small game hunters were
required to check out at the check station before leaving the property. A check station attendant recorded
information on the hunters, their harvest, hunting methods, and measures of satisfaction (Appendix A).
Voluntary hunter check-out cards requesting the same information were also provided in case a check
station attendant was not present when hunters checked out.
In past years, significant ice buildup was noted on the ponds at Jackson Lake and Red Lion
SWAs by the end of November. For comparative purposes, data from before November 23 and on or
after November 23 are summarized separately for these 2 SWAs. In 2011-12, the duck season dates were
October 8 – December 4 and December 23 – January 29, with the season closed during December 5-22.
6. 6
During 23 December 2011 – 29 January 29 2012, check station attendants were no longer assigned to
Jackson Lake and Red Lion SWAs, and we relied on hunters filling out voluntary check-out cards.
Check station attendants recorded the license plate numbers of all vehicles at all study SWA
parking lots daily throughout the season, and recorded license plate numbers gain as hunting parties
checked out at check station. Whenever possible, attendants identified vehicles that belonged to people
other than waterfowl and small game hunters (e.g., deer hunters). We used the proportion of total
vehicles (excluding vehicles present for other uses) that checked out as an index to compliance with the
requirement that all waterfowl and small game hunters check out during the regular duck station at study
SWAs.
Aerial surveys of the SPR corridor from Greeley to the state line were conducted monthly during
the regular duck hunting season (October 14, November 16, December 16, and January 4) to provide an
index to overall waterfowl numbers and distribution in the region. Observers recorded numbers and
locations of ducks and geese on the river and associated sloughs, as well as ponds and reservoirs in the
SPR corridor. Photographs were taken of a subset of areas counted where large concentrations of
waterfowl occurred, and the number of waterfowl in each photograph was tallied to provide a more
accurate count at these locations.
RESULTS AND DISCUSSION
During the 2011-12 waterfowl hunting season, we obtained harvest and satisfaction measures
from 929 hunting parties. Of these, 711 (77%) were duck hunting parties. These totals are lower than
during the 3 previous years of the study, which averaged 1,352 total hunting parties and 1,018 duck
hunting parties per year. Part of the decline in hunting activity in 2011-12 might have been due to the
changes in regulations that occurred this year. For example, Jean K. Tool/Brush SWAs were unrestricted
and averaged 530 duck hunting parties per season during the previous 3 seasons, but were restricted
during 2011-12 and only 150 duck hunting parties used these SWAs, a 72% decrease. These areas were
paired with Bravo SWA, which averaged 80 duck hunting parties during the previous 3 years when
restricted regulations were in place, but duck hunting parties actually decreased 15% to 68 in 2011-12
when unrestricted regulations were in place at Bravo SWA. At Jackson Lake SWA, where regulations
switched from restricted during the previous 3 years to unrestricted in 2011-12, the number of duck
hunting parties in 2011-12 increased 244% (361 parties) above the average during the previous 3 years
(148 parties). Jackson Lake SWA is paired with Red Lion SWA, which averaged only 173 duck hunting
parties per year over the previous 3 years when regulations were unrestricted; the number of duck hunting
parties decreased 35% to 113 in 2011-12 when restricted regulations were put in place at Red Lion SWA.
It appears that hunting activity is impacted differently by restricted versus unrestricted regulations at
different study SWAs. In addition, although the overall length of the duck season was the same in 2011-
12 as during the previous 3 years, the timing of the split (closed period) in the season was changed during
2011-12; this change may have had some (unmeasured) effect on the hunting activity of hunters who
normally use the study SWAs. Finally, we are investigating whether the decline in hunter activity on
study SWAs is biased toward hunters with certain characteristics (e.g., novice or casual hunters versus
experienced or highly active hunters), to determine whether our research activities (i.e., check stations and
hunter interviews) are introducing some unintended influence on the behavior of the pool of hunters who
would normally use these SWAs.
During the 2011-12 season we interviewed 620 duck hunting parties, and 91 additional duck
hunting parties left checkout cards at unmanned check stations. Jackson Lake SWA (unrestricted
regulations) had the highest use, with 341 duck hunting parties and 737 duck hunter-days, and Overland
Trail SWA (unrestricted regulations) had the lowest use, with 15 duck hunting parties and 35 duck
hunter-days (Table 1).
7. 7
Overall, 30% of duck hunters at the 7 study SWAs were in their first year of hunting the lower
SPR corridor, 16% had hunted the area for 2 years, 10% for 3 years, 4% for 4 years, and 40% for 5 years
or more. Most (83%) of the duck hunters surveyed hunted mainly public lands, 4% hunted mainly private
lands, and 13% said they hunted both equally. The average duck hunting party size ranged from 1.7 on
Bravo SWA to 2.3 on Atwood and Overland Trail SWAs (Table 1). Across all 7 SWAs, 85% of all duck
hunting parties used standard decoys, 50% used spinning wing decoys, 42% used dogs, and 87% of used
duck calls.
A total of 1,565 ducks was reported harvested on the 7 study SWAs during the 2011-12 season
(Table 2). The species was identified for 1,459 (93%) of the ducks harvested, and of the identified ducks,
six species of dabbling ducks (mallard, northern shoveler, green-winged teal, gadwall, blue-winged teal,
and American wigeon) comprised 83% of the duck harvest. Waterfowl hunters also harvested 80 geese at
study SWAs, and small game hunters harvested a variety of other migratory game birds, upland game
birds, and small mammals at these 7 SWAs (Table 2).
Season-long duck harvest success was measured for each SWA as ducks bagged per hunter per
party per day over the 2011-2012 regular duck season. From interview data, harvest success was greater
at restricted areas than unrestricted areas of similar size and habitat type: season-long harvest success was
4 times greater at Atwood SWA than Overland trail SWA, 2.7 times greater at Jean K. Tool/Brush SWAs
than Bravo SWA, and 2 times greater at Red Lion SWA than Jackson Lake SWA (Table 1).
As in previous years, frequency distributions of ducks shot per hunter per day showed that small
on-channel properties (Atwood and Overland Trail SWAs) had the largest proportion of hunting parties
with 0 ducks bagged and most successful hunting parties on these areas bagged <2 ducks per hunter
(Figure 2). Hunters experienced slightly fewer 0 bag days on the large on-channel properties (Jean K.
Tool/Brush and Bravo SWAs) and a greater percentage of hunting parties bagged >2 ducks per hunter
(Figure 3). Hunters had greater success on off-channel properties (Red Lion and Jackson Lake SWAs),
with fewer 0 bag days and more hunting parties with >2 ducks bagged per hunter (Figure 4). Across all
study areas, average daily duck bag per hunter was variable over the course of the season, with generally
higher success early in the season, and lower success late in the season (Figure 5a). Duck hunter activity
was also variable across the season, with generally greater numbers of hunters per day on study SWAs
early in the season, and fewer hunters in January (Figure 5b). The maximum number of duck hunters on
the 7 study SWAs occurred on opening day of the regular duck season (October 8) at 34 hunters.
Satisfaction with number and proximity of other hunters (i.e., ‘crowding’) was high at all areas,
ranging from an average rank of 4.0 (on a scale of 1-5) at Jackson Lake SWA (unrestricted) to an average
of 4.8 at Bravo (unrestricted) and Red Lion (restricted) SWAs (Table 3). Among SWAs that switched
from unrestricted regulations during the previous 3 seasons to restricted regulations in 2011-12,
satisfaction with crowding decreased at Atwood SWA (average of 4.8 during the previous 3 seasons
versus 4.3 during 2011-12) and increased at Jean K. Tool/Brush SWAs (4.4 versus 4.7) and Red Lion
SWA (4.1 versus 4.8). Among SWAs that switched from restricted regulations during the previous 3
seasons to unrestricted regulations in 2011-12, satisfaction with crowding decreased slightly at Overland
Trail SWA (4.5 versus 4.4) increased at Bravo SWA (4.6 versus 4.8) and decreased at Jackson Lake SWA
(4.4 versus 4.0).
Satisfaction with property-specific hunting regulations was generally favorable at all areas,
ranging from an average rank of 3.5 at Overland Trail SWA (unrestricted) to an average of 4.0 at Red
Lion (restricted) and Jackson Lake (unrestricted) SWAs (Table 3). Compared to mean satisfaction rank
of hunting regulations during the previous 3 seasons, mean satisfaction rank during 2011-12 increased at
Bravo SWA (3.7 during the previous 3 seasons versus 3.9 during 2011-12), and decreased at all other
8. 8
study SWAs: 4.3 versus 3.8 at Atwood, 3.9 versus 3.5 at Overland Trail, 4.2 versus 3.9 at Jean K.
Tool/Brush, 4.1 versus 4.0 at Red Lion and Jackson Lake.
Satisfaction with bird numbers was ranked lower than other measures at all SWAs, whereas
satisfaction with habitat conditions was ranked favorably at all SWAs (Table 3). As in previous years,
average satisfaction with bird numbers was higher at the off-channel properties (Red Lion and Jackson
Lake SWAs) than other properties, with the exception in 2011-12 that Atwood SWA was ranked similarly
to the off-channel properties. Additionally, habitat conditions were ranked highest at off-channel
properties during previous seasons, but in 2011-12 Atwood SWA was ranked higher than off-channel
properties.
Overall satisfaction with the day’s hunt was generally ranked favorably at all study SWAs (Table
3). Overall satisfaction ranks were equal to or higher than the ranks during the previous 3 seasons at all
SWAs except Jackson lake SWA, where overall satisfaction averaged 3.6 during 2011-12, compared to an
average of 3.9 over the 3 previous seasons.
We estimated correlation coefficients between average ranks of satisfaction for crowding, hunting
regulations, duck numbers seen, overall satisfaction, and average ducks shot per hunter per day on each
study SWA (Table 4). Correlation coefficients provide a rough estimate of the effect these factors have
upon one another. A correlation coefficient of 1.0 suggests a perfect positive correlation between two
factors, and -1.0 suggests a perfect negative correlation between two factors. A correlation coefficient of
0.0 suggests no correlation between two factors. Although there were no strong correlations among
various measures of satisfaction, satisfaction with bird numbers was most closely positively correlated
with overall satisfaction with a day’s hunt on all SWAs (range 0.42 – 0.47) except Overland Trail SWA,
where there was a negative correlation (-0.37) between satisfaction with bird numbers and overall
satisfaction (Table 4).
Our index to compliance with the requirement that all waterfowl and small game hunters check
out at check stations was similar to that seen in previous years. Compliance was lowest (79%) at Brush
and Bravo SWAs, but exceeded 90% at all other study SWAs (Table 5).
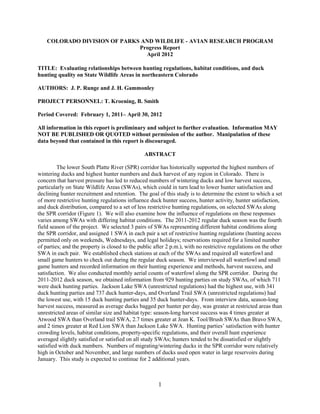
Indices of ducks during aerial surveys of the SPR corridor were relatively high during October
(44,704) compared to previous years, increased substantially to 82,996 in November before declining to
63,482 in December, and increased again to 98,017 in January (Figure 6). Unusually warm weather
occurred in late December 2011 and January 2012, and a large proportion of ducks were concentrated on
open water in large reservoirs along the SPR corridor.
This study is expected to continue for 2 more years, with assignments of regulations to study
SWAs the same as in the 2011-2012 hunting season. Data collection will resume in October 2012.
ACKNOWLEDGEMENTS
Area 3 Field Operations and Terrestrial personnel provided crucial support for technicians and
equipment in this project as well as providing solutions for the movement and storage of checkout
stations. Area 3 personnel again provided valuable assistance in communication with hunters. Brian
Smith’s piloting skills were well-appreciated. Loyse Hinkle and staff provided information on the
Division of Wildlife website. Joshua Barron, Maura Bishop, Cole Caldwell, Jeff Coyle, Chance Davison,
Blake Gipson, Casey Gray, and Mike McConnell served as field technicians.
9. 9
LITERATURE CITED
Baldassare, G. A., and E. G. Bolen. 1994. Waterfowl ecology and management. John Wiley and Sons,
New York.
Bregnballe, T., and J. Madsen. 2004. Tools in waterfowl reserve management: effects of intermittent
hunting adjacent to a shooting-free core area. Wildlife Biology 10:261-268.
Bregnballe, T., J. Madsen, and P. Rasmussen. 2004. Effects of temporal and spatial hunting control in
waterbird reserves. Biological Conservation 119:93–104.
Colorado Division of Wildlife. 2006. Waterfowl season preference survey results. Unpublished report.
Cox, R. R., Jr., and A. D. Afton. 1998a. Evening flights of female northern pintails from a major roost
site. Condor 98:810-819.
Cox, R. R., Jr., and A. D. Afton. 1998b. Use of mini-refuges by female northern pintails wintering in
southwestern Louisiana. Wildlife Society Bulletin 26:130-137.
Cox, R. R., Jr., and A. D. Afton. 1999. Do mini-refuges supply wintering northern pintails with
important diurnal roost sites? Response to Rave. Wildlife Society Bulletin 27: 901-903.
Dahlgren, R. and C. Korschgen. 1992. Human disturbances of waterfowl: An annotated bibliography.
U.S. Department of the Interior Fish and Wildlife Service: Resource Publication 188.
Washington, D.C.
Evans, R. M., and K. R. Day. 2001. Does shooting disturbance affect diving ducks wintering on large
shallow lakes? A case study on Lough Neagh, Northern Ireland. Biological Conservation
98:315–323.
Evans, R. M., and K. R. Day. 2002. Hunting disturbance on a large shallow lake: the effectiveness of
waterfowl refuges. Ibis 144:2–8.
Fleskes, J. P. 2002. Distribution of female northern pintails in relation to hunting and location of hunted
and non-hunted habitats in the Grassland Ecological Area, California. California Fish and Game.
88:75-94.
Fox, A. D., and J. Madsen. 1997. Behavioural and distributional effects of hunting disturbance on
waterbirds in Europe: implications for refuge design. Journal of Applied Ecology 34:1–13.
Hill, D., D. Hockin, D. Price, G. Tucker, R. Morris, and J. Treweek. 1997. Bird disturbance: improving
the quality and utility of disturbance research. Journal of Applied Ecology 34:275–788.
Hockin, D., M Ounsted, M. Gorman, D. Hill, V. Keller, and M. Barker. 1992. Examination of the effects
of disturbance on birds with reference to the role of environmental impact assessments. Journal
of Environmental Management 36:253-286.
Hopper, R. M., A. D. Geis, J. R. Grieb, and L. Nelson, Jr. 1975. Experimental duck hunting seasons, San
Luis Valley, Colorado, 1963-1970. Wildlife Monographs, Number 46.
Hurvich, C. M. and C. L. Tsai. 1989. Regression and time series model selection in small samples.
Biometrika 76:297-307.
Martin, E. M., and S. M. Carney. 1977. Population ecology of the mallard. IV. A review of duck hunting
regulations, activity, and success, with special reference to the mallard. U.S. Fish and Wildlife
Service Resource Publication 130, Washington, D.C.
Madsen, J. 1995. Impacts of hunting disturbance on waterfowl. Ibis 137, Suppl. 1:67–74.
Madsen, J. 1998a. Experimental refuges for migratory waterfowl in Danish wetlands. I. Baseline
assessment of the disturbance effects of recreational activities. Journal of Applied Ecology
35:386–397.
Madsen, J. 1998b.Experimental refuges for migratory waterfowl in Danish wetlands. II. Tests of
hunting disturbance effects. Journal of Applied Ecology 35:398–417
Madsen, J., and A. D. Fox. 1995. Impacts of hunting disturbance on waterbirds—a review. Wildlife
Biology 1:193–207.
Mikula, E. J., G. F. Martz, and C. L. Bennett, Jr. 1972. Field evaluation of three types of waterfowl
hunting regulations. Journal of Wildlife Management 36:441-459.
National Flyway Council and Wildlife Management Institute. 2006. National duck hunter survey 2005,
10. 10
Central Flyway report. www.ducksurvey.com
Pease, M., R. Rose, and M. Butler. 2005. Effects of human disturbances on the behavior of
wintering ducks. Wildlife Society Bulletin 33:103-112.
Rave, D. P. 1999. Do mini-refuges supply wintering northern pintails with important diurnal roost sites?
Wildlife Society Bulletin 27: 897-900.
Rave, D. P., and C. L. Cordes. 1993. Time-activity budget of northern pintails using nonhunted rice fields
in southwest Louisiana. Journal of Field Ornithology 64:211-218.
11. 11
Table 1. Statistics associated with duck hunting parties on selected State Wildlife Areas (SWAs) along
the South Platte River corridor during 2010-2011. Percent statistics are the percent of parties that used
standard decoys, spinning wing decoys, dogs, or duck calls.
SWA
Total
parties
Total
hunter
days
Avg.
hunters
in party
Avg.
total
duck
harvest
Avg.
ducks
/hunter
/day
%
Parties
using
decoys
%
Using
spinning
wing
%
Using
dogs
%
Using
duck
calls
Interviews
Atwood (R) 22 51 2.3 0.9 0.4 77 45 45 82
Overland Trail (U) 14 32 2.3 0.1 0.1 64 36 43 71
Jean K Tool /Brush (R) 133 293 2.2 1.6 0.8 84 34 44 84
Bravo (U) 56 95 1.7 0.5 0.3 64 13 29 76
Red Lion (R) 89 196 2.2 4.7 2.2 96 58 58 94
Jackson Lake (U) 306 673 2.2 2.5 1.1 90 66 35 90
Check-out Cards
Atwood (R) 2 3 1.5 0.0 0.0 0 0 100 0
Overland Trail (U) 1 3 3.0 0.0 0.0 0 0 100 100
Jean K Tool /Brush (R) 17 33 1.9 1.9 1.0 73 40 47 87
Bravo (U) 12 21 1.8 0.2 0.1 55 9 64 55
Red Lion (R) 4 9 2.3 3.0 1.4 75 75 25 67
Jackson Lake (U) 14 32 2.3 0.7 0.3 85 69 46 100
Interviews & Cards
Atwood (R) 24 54 2.3 0.8 0.4 74 43 48 78
Overland Trail (U) 15 35 2.3 0.1 0.0 51 33 47 73
Jean K Tool /Brush (R) 150 326 2.2 1.6 0.8 53 34 44 85
Bravo (U) 68 116 1.7 0.4 0.3 62 12 35 73
Red Lion (R) 93 205 2.2 4.6 2.1 93 53 55 91
Jackson Lake (U) 320 705 2.2 2.5 1.1 90 64 37 91
After ice-up (Cards)
Red Lion (R) 20 32 1.6 1.1 1.0 80 13 40 75
Jackson Lake (U) 21 32 1.5 1.6 1.2 81 43 57 86
13. 13
Table 3. Average satisfaction measures of duck hunting parties on selected State Wildlife Areas (SWAs)
along the South Platte River corridor during 2010-2011. Scale is 1 through 5, with 1 being the least
favorable and 5 being the most favorable. SWAs are designated as Restricted (R) or Unrestricted (U)
based on property regulations.
SWA
Total
parties Crowding
Bird
numbers
Habitat
conditions
Hunting
regulations Overall
Interviews
Atwood (R) 22 4.3 3.1 4.5 3.9 4.0
Overland Trail (U) 14 4.4 2.1 4.1 3.5 3.5
Jean K Tool /Brush (R) 133 4.7 2.5 4.3 4.0 3.5
Bravo (U) 56 4.8 2.4 4.1 4.1 3.8
Red Lion (R) 89 4.8 3.4 4.1 4.0 4.0
Jackson Lake (U) 304 4.0 2.9 4.5 4.0 3.6
Check-out Cards
Atwood (R) 2 4.5 1.0 5.0 2.0 5.0
Overland Trail (U) 0 - - - - -
Jean K Tool /Brush (R) 14 4.7 2.3 3.8 3.4 3.4
Bravo (U) 12 4.6 2.3 3.8 3.0 2.9
Red Lion (R) 4 5.0 2.8 3.3 3.3 3.3
Jackson Lake (U) 12 3.7 2.8 4.2 4.1 3.5
Interviews & Cards
Atwood (R) 24 4.3 3.0 4.5 3.8 4.1
Overland Trail (U) 14 4.4 2.1 4.1 3.5 3.5
Jean K Tool /Brush (R) 147 4.7 2.5 4.2 3.9 3.5
Bravo (U) 67 4.8 2.4 4.1 3.9 3.6
Red Lion (R) 93 4.8 3.4 4.1 4.0 4.0
Jackson Lake (U) 316 4.0 2.9 4.4 4.0 3.6
After ice-up (Cards)
Red Lion (R) 16 4.3 2.9 3.8 3.0 3.3
Jackson Lake (U) 20 4.2 3.5 4.4 4.3 3.7
14. Table 4. Correlation coefficients between some of the satisfaction measures from duck hunting parties at
selected State Wildlife Areas (SWAs) along the South Platte River corridor during the 2011-2012 regular
duck season.
SWA Factor Crowding
Bird
numbers
Hunting
regulations
Avg.
ducks
/hunter
/day
Atwood (R)
Bird numbers 0.11
Hunting regulations -0.01 -0.03
Avg. ducks /hunter /day 0.19 0.28 -0.31
Overall 0.37 0.45 0.32 0.19
Overland
Trail (U)
Bird numbers -0.30
Hunting regulations 0.21 -0.29
Avg. ducks /hunter /day 0.19 0.20 -0.15
Overall 0.44 -0.37 0.03 0.19
Jean K Tool /
Brush (R)
Bird numbers 0.16
Hunting regulations -0.05 -0.22
Avg. ducks /hunter /day 0.08 0.41 -0.02
Overall 0.09 0.44 0.29 0.31
Bravo (U)
Bird numbers -0.07
Hunting regulations -0.12 0.13
Avg. ducks /hunter /day 0.14 0.44 0.21
Overall -0.08 0.47 0.08 0.22
Red Lion (R)
Bird numbers -0.15
Hunting regulations -0.03 0.08
Avg. ducks /hunter /day 0.00 0.33 0.04
Overall 0.09 0.45 0.30 0.41
Jackson
Lake (U)
Bird numbers 0.05
Hunting regulations 0.19 0.16
Avg. ducks /hunter /day 0.02 0.44 -0.04
Overall 0.22 0.42 0.16 0.40
15. Table 5. Compliance index (number of vehicles present in parking lots, and number that checked out at check stations), and numbers of vehicles
using study SWA parking lots for purposes other than waterfowl and small game hunting during 2011-2012 regular duck season.
Vehicles that checked out Vehicles present for other uses
SWA Yes No % compliance Deer hunting Fishing Turkey hunting Scouting Walking Other
Atwood (R) 39 4 91 4
Overland Trail (U) 26 0 100 19 1 2
Brush (R) 52 14 79 15 2 1
Jean K. Tool (R) 102 1 99 2 1 1
Bravo (U) 129 35 79 38 1 3 7 4
Red Lion (R) 100 8 93 2 2
Jackson (U) 355 21 94 4 2 1 3
Total 803 83 91 80 8 2 9 8 8
16. 16
Figure 1. South Platte River corridor from Greeley to the state line, showing State Wildlife Areas included in the study.
17. Figure 2. Distribution of average ducks harvested per hunter per day for parties hunting Atwood
(Restricted) and Overland Trail (Unrestricted) SWAs during the 2011-2012 regular duck season.
18. 18
Figure 3. Distribution of average ducks harvested per hunter per day for parties hunting Jean K.
Tool/Brush (Restricted) and Bravo (Unrestricted) SWAs during the 2011-2012 regular duck season.
19. 19
Figure 4. Distribution of average ducks harvested per hunter per day for parties hunting Red Lion
(Restricted) and Jackson Lake (Unrestricted) SWAs during the 2011-2012 regular duck season.
20. 20
Figure 5. Daily duck hunting success (a) and (b) hunter activity on 7 SWAs along the South Platte River
corridor during the 2011-2012 regular duck season. The season was closed during 5-22 December.
a.
b.
21. 21
Figure 6. Indices of duck numbers in the South Platte River (SPR) corridor from October 2011 through
January 2012.
22. 22
Appendix A. Information collected from waterfowl and small game hunters on selected State Wildlife
Areas along the South Platte River during the 2011-2012 regular duck hunting season.
South Platte River Corridor State Wildlife Area Hunting Study
State Wildlife Area Date Initials
Number in hunting party _ Party arrival time Party departure time
Parking Lot/Hunt Zone__________________ License plates ____________________________________
CID number Sex Seasons out of last 5 hunted on
SPR (counting this year, 1-5)?
Mostly
public
Mostly
private
Equal
Target Species (e.g., ducks, quail, squirrels, etc):
Harvest Drake in
plumage
Brown Notes
Mallard
Blue-winged teal
American wigeon
Gadwall
Northern shoveler
Wood duck
Pheasant
Bobwhite quail
Decoys (# in dozens)? Spinning-wing decoys (#)? Dogs (#)? Calls (Y/N)?
Rank the following from 1 to 5 for today’s hunt:
Crowding problems (1 = extreme crowding problems, 5 = no crowding problems)
Bird/game numbers seen (1 = no birds seen, 5 = abundant numbers of birds seen)
Habitat conditions on the area (1 = very poor, 3 = average, 5 = excellent conditions)
Current hunting regulations on the SWA (1 = very dissatisfied, 3 = neutral, 5 = very satisfied)
Overall satisfaction with the hunt (1 = very dissatisfied, 3 = neutral, 5 = very satisfied)