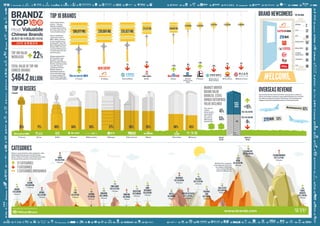
BrandZ Top 100 Most Valuable Chinese Brands 2015 Infographic
1. TOTAL VALUE OF TOP 100
CHINESE BRANDS
$464.2BILLION
TOP 100 VALUE
INCREASED 22%
MARKET-DRIVEN
BRAND VALUE
DOUBLED, STATE-
OWNED ENTERPRISE
VALUE DECLINED
The value of
market-
driven brands
increased by
97%, while
the value of
SOE brands
declined 9%.
VALUE OF
TOP 100
GROWTH OF
TOP100
47%
53%
-37%
$66,077Mil. $55,927Mil.
+95%
-13% +18%
-9%
+55% -18%
-20%
-11% -13%
TOP10BRANDS
TOP10RISERS
NEWENTRY
$59,684Mil.
$34,521Mil. $30,897Mil.
$21,005Mil. $15,493Mil.
$15,427Mil. $11,861Mil.$12,022Mil.
Three market-driven
brands – Tencent,
Alibaba and Baidu –
comprise about half of
the value of the Top 10
most valuable brands.
Almost doubling in
value in one year to
$66.1 billion, Tencent
rose to number one in
the BrandZ™ Top 100
Most Valuable Chinese
Brands 2015. Tencent
increased 442 percent
in brand value over the
past five years.
Alibaba appeared for
the first time in the
BrandZ™ Top 100
Most Valuable Chinese
Brands, ranking number
two after Tencent
and ahead of China
Mobile, based on
rapid appreciation in
brand value following
its record-setting IPO
(Initial Public Offering),
which raised $25 billion.
Two brands derived over half of their revenue from outside of
China: technology company Lenovo gained 62 percent; and ZTE,
the telecom equipment maker, 53 percent. This development
suggests the growing global presence of Chinese brands.
1 Tencent 7 New Oriental 8 Baidu 9 Pearl River 10 Hanting
% Growth
95%
2 Ctrip
71%
3 BYD
69%
4 Xueersi
64%
5 Ming Jewelry
59%
6 Mengniu
57% 56% 55% 48% 45%
+97%
-9%
US$ 218,728 Mil.
US$ 245,506 Mil.
OVERSEASREVENUE
BRANDNEWCOMERS TOP 100 RANK
2
37
48
54
61
68
95
98
MARKET-
DRIVEN
BRANDS
SOEs
53%
62%
1 Tencent 2 Alibaba 3 China Mobile 4 ICBC 5 Baidu 7 Sinopec 9 PetroChina 10 Bank of China6 China
Construction
Bank
8 Agricultural
Bank of China
Alibaba
Letv
ZTE
Baiyunshan
Great Wall
Yonghui
Superstore
Yihaodian
TCL
Retail led the categories
in brand growth driven by
the addition of Alibaba.
Even without Alibaba
retail rose 64 percent.
CATEGORIES
Value is concentrated in a few categories, with
Retail leading the growth and Technology,
Banks, Telecom Providers and Retail accounting
for almost three-quarters of the total value.
12 CATEGORIES
7 CATEGORIES
2 CATEGORIES UNCHANGED
9 Brands
TECHNOLOGY
US$106,886Mil.
9 Brands
BANKS
US$96,291Mil.
-16%
4 Brands
RETAIL
US$62,287Mil.
+3,827%
3 Brands
-4%
TELECOMPROVIDERS
US$71,272Mil.
+141%
2 Brands
CARS
US$1,877Mil.
+18%
2 Brands
CATERING
US$483Mil.
+14%
7 Brands
FOOD&DAIRY
US$14,572Mil. +1%
4 Brands
HEALTHCARE
US$5,500Mil.
+4%
2 Brands
OIL&GAS
US$27,515Mil.
+20%
7 Brands
HOME
APPLIANCES
US$6,529Mil.
+4%
2 Brands
PERSONAL
CARE
US$978Mil.
+48%
2 Brands
TRAVEL
AGENCIES
US$1,439Mil.
7 Brands
APPAREL
US$2,424Mil.
-22%
11 Brands
ALCOHOL
US$16,055Mil.
-1%
1 Brand
FURNITURE
US$359Mil.
-10%
6 Brands
INSURANCE
US$28,288Mil.
-2%
3 Brands
JEWELRYRETAILER
US$1,241Mil.
+57%
2 Brands
EDUCATION
US$1,399Mil.
3 Brands
HOTELS
US$998Mil.
0%
10 Brands
REALESTATE
US$9,594Mil.
0%
+7%
4 Brands
AIRLINES
US$8,248Mil.
+78%
TOP100: 8
Methodology and Valuation by
www.brandz.com
1 2 3 4 5 6 7 9 10 11 12 13 14 1615 17 Yili 18 19 20 21 22 23 24 25 26 Vanke 27
282930313233PolyRealEstate34353637383940414243TongRenTang44454647
48495051 Snow Beer5253555657 54 Baiyunshan585960616263646566676869707172737475 Suofeiya76777879
8081Quanjude828384858687888990919293949596979899100