1. Δελτίο της Ελληνικής Γεωλογικής Εταιρίας, τόμος L, 2016
Πρακτικά 14ου
Διεθνούς Συνεδρίου, Θεσσαλονίκη, Μάιος 2016
Bulletin of the Geological Society of Greece, vol. L, 2016
Proceedings of the 14th
Intern. Congress, Thessaloniki, May 2016
GRANULAR AQUIFER SYSTEM OF WEST CHALKIDIKI
AREA, REGION OF CENTRAL MACEDONIA, NORTHERN
GREECE
Veranis N.1, Nimfopoulos M.2, Christidis C.3 and Chrysafi A.4
1
Hydrogeologist, 39 Perraivou st., 543 52, Thessaloniki, Greece, nikosveranis@gmail.com
2
Environmental Geochemist, IGME, 1 Fragon street, 546 26 Thessaloniki, mnimfo@thes.igme.gr
3
MSc Geologist, christidisc@hotmail.com
4
MSc Geologist, alexchrysafi@hotmail.com
Abstract
The granular aquifer system of the western Chalkidiki peninsula covers an area of
667 Km2
occupying Neogene and Quaternary sediments. The present study deals
with the hydrogeological and hydrogeochemical characterization of the granular
aquifer system for the purposes of efficient utilization and management of
groundwater resources. It is a multilayered formation, composed of
unconsolidated to semi-consolidated sands, gravels, conglomerates, sandstones
and marly limestones with intercalated impermeable to semi-permeable beds of
clays, marls or mixed with pebbles and sands. The aquifer system is characterized
by medium to moderate hydrocapacity and the pumped groundwater consumptions
are 74*106
m3
/yr. Piezometric studies carried out in the period of 2003-14,
conclude that the piezometric surface decline is located in the S and SE parts of
the aquifer system, while in the rest Central and NW parts there is a noticeable
rising of the groundwater table. Groundwater is generally characterized by a good
quality; however, groundwaters of the broader Triglia area, have excessively high
contents of As (10 to 3400 μgr/l) and B (1.5 to 4.0 mg/l). Other natural pollutants
are Fe and Mn. Salinization and high values of nitrate are mainly detected in water
boreholes of Moudania-Portaria, Akrotiri-Epanomi and Agelochori areas.
Keywords: Hydrogeological parameters, piezometric study, groundwater quality.
Περίληψη
Το κοκκώδες υδροφόρο σύστημα Δ. Χαλκιδικής καλύπτει έκταση 667 km2 και
φιλοξενείται σε Νεογενή και Τεταρτογενή ιζήματα. Η μελέτη αυτή αναφέρεται στα
υδρογεωλογικά και υδροχημικά χαρακτηριστικά του υδροφόρου συστήματος. Οι
υδροφορείς συνίσταται από επαλληλία χαλαρών έως ημι-συνεκτικών ιζημάτων από
άμμους, χαλίκια, κροκάλες, ψαμμίτες και μαργαϊκούς ασβεστόλιθους με παρεμβολές
αδιαπέρατων έως ημιπερατών στρωμάτων από αργίλους, μάργες ή μίγματα αργίλων με
άμμους, χαλίκια και κροκάλες. Το υδροφόρο σύστημα χαρακτηρίζεται από μέτρια έως
ενδιάμεση υδρο-δυναμικότητα και οι καταναλώσεις από αντλήσεις ανέρχονται σε
74x106
m3
/έτος. Από πιεζομετρικές μελέτες που πραγματοποιήθηκαν στο
διάστημα 2003-14 προέκυψε ότι η πιεζομετρική επιφάνεια υποχώρησε στο N-NA
τμήμα, ενώ στο κεντρικό και ΒΔ τμήμα παρουσίασε ακόμη και άνοδο. Η ποιότητα των
2. υπόγειων νερών είναι γενικά καλή, με εξαίρεση την περιοχή Τρίγλιας όπου
εντοπίζονται αυξημένες τιμές σε As (10-3400 μgr/l) και Β (1.5-4.0 mg/l) καθώς και σε
μερικές θέσεις αυξημένες συγκεντρώσεις σ ε Fe, Mn, ΝΟ3. Υφαλμύρινση των
παράκτιων υδροφορέων παρατηρείται κύρια στις περιοχές Μουδανιών-Πορταριάς,
Ακρωτηρίου Επανομής και Αγγελοχωρίου.
Λέξεις-κλειδιά: υδρογεωλογικές παράμετροι, πιεζομετρία, ποιότητα υπόγειων νερών.
1. Introduction
Groundwater is a critical resource for 65000 permanent inhabitants living in the west Chalkidiki
area. In addition, 180000 tourists and seasonal inhabitants during summer season use it as potable
water, in agriculture, farming and manufacture. Previous hydrogeological studies only refer to some
parts of the aquifer system (e.g. Loehnert and Papakonstantinou, 1988; Xefteris, 2000,
unpublished reports of IGME).
This work deals with the hydrogeological and hydrogeochemical characterization of west
Chalkidiki granular aquifer system aiming to contribute t o a n efficient utilization and management
of groundwater resources. The methodology involves the analysis and interpretation of existing
data as borehole logs, pumping tests, static water level measurements, meteorological data, surface
water supply measurements, groundwater consumption and chemical analyses of the ground waters
samples collected in the period 2004-10 by the Institute of Geology and Mineral Exploration
(IGME), (Veranis et al., 2010) and from local authorities in the period 2011-14.
2. Geomorphology and land uses
The west Chalkidiki aquifer system covers an area of 667 km2
and is extended from the Megalo
Emvolo to the northern part of Kassandra Peninsula and along the west part of the Chalkidiki
peninsula. The main part of the aquifer system is plain, with hilly (200-500 m) and semi-
mountainous (500-638 m) areas. The average elevation of the area is 110 m ranging from 0 to 638
m. The relief is mature with elongated, U-shaped, dry valleys of crosscutting torrents (Syrides,
1990). Karstified limestones of Mesozoic age, are located in the Katsika mountainous area. They
cover a total area of 15 km2
and represent a very intense geomorphologic relief in contrast to the
surrounding hilly and flat coastal area. Most part of the area is characterized by a smooth relief, with
small to moderate soil slopes (2-5% S-SW) in the larger part of the area. This fact, has
predominantly favored the infiltration process rather than the run off, which only occurs after
intense rainfalls. The hydrographic network is of dendrite type and consists of sub-parallel
torrents of NNE-SSW general direction. Olynthios river is located in the E part of the aquifer
system, being the only stream where the run off occurs for 9 to 10 months per year, with mean water
supply of 1400 m3
/h. According to CORINE, from a total area of 667 km2
, the agricultural land
occupies 534 km2
(80.06%). The forest, semi-forest and pasture areas occupy 100.0 km2
(15.0%),
about 32 km2
(4.7%) are covered by the settlements and 0.8 km2
(0.12 %) are occupied by wetlands.
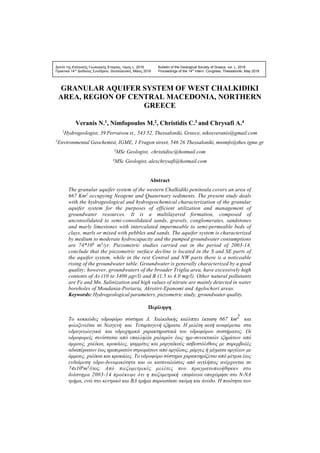
3. Geology
The study area geologically belongs to the Peonia zone and consists of Quaternary and Neogene
sediments (Figure 1) with a depositional environment varying from land-river to delta, lake and
land type. The total thickness of the sediments ranges from 150 to 500 m in the higher topographic
reliefs and increases to 1000-1500 m or more (max=3500 m) in the coastal areas (Syrides, 1990).
Holocene alluvial sediments are located along the torrent beds and coastal valleys. They consist of
sands, clay-sands, clays, conglomerates, pebbles and their intercalations. Pleistocene deposits of
red-clays are located in the Moudania area and travertines as hot spring aprons are found in Eleo-
choria area. Pleistocene terrace deposits of unconsolidated recent or old scree and lateral deposits
of boulders, conglomerates, clays and their intercalations are located in other places (Figure 1).
3. Neogene sediments are divided in: (a) Lacustrine limestones and hard marls. They are found in
the W part of Katsika mountain and constitute the upper horizons of the sandstone-marl series. (b)
Sandstone-marl series overlie the red clay beds and dominate most of the W and Central part of
the W Chalkidiki peninsula. The stratigraphic succession of the beds is not constant and generally
consists of alternating beds of sands, clayey marls, clays, marl-clays with intercalations of semi-
unconsolidated sandstones, river-bank deposits and sandstone grit. (c) Red clay series, covers the
Central and S-SE parts of the aquifer system and consists of red to brick bed clays with mica and
fine grained quartz. In places they include lenticular intercalations of sands, marls, travertine,
marly limestones and conglomerates. (d) Basal conglomerates series, located at the north margins
of the study area, were deposited unconformably to the basement pro-Neogene rocks and usually
consist of loose to semi-consolidated conglomerates with intercalations of red beds.
Figure 1 - Simplified geological-hydrogeological map of west Chalkidiki aquifer system.
In the NE part of the aquifer system many boreholes are found penetrating the basal conglomerate
series.
The basement rocks (gneisses, schists, ophiolites, limestones, granites) of Paleozoic and Mesozoic
age are located in the upper topographic parts along the northern margins of the aquifer system.
From the hydrogeological point of view, the most interesting are the Mesozoic karstified limestones
of Katsika mountainous area (15 km2
). Satellite picture interpretation concludes that the faults have
NNW-SSE, NE-SW and N-S directions.
4. Hydrolithology and hydrogeological parameters
The aquifer system is a multilayered system that is composed of unconsolidated to semi-
consolidated sands, gravels, conglomerates, sandstones, as well as marly limestones or travertine
lenses and among them intercalations of impermeable to semi-permeable beds as red clays, silts,
green-gray clays, marls or mix of clays with sands, pebbles, gravels and conglomerates. The thick-
4. ness and permeability of the unsaturated zone are important parameters for the vulnerability
assessment of the aquifer system to contamination sources. The lithological description of the 150
borehole logs reveals that the thickness of unsaturated zone ranges from 10 to 195 m and the geo-
metric mean value is 45 m. In most part (64%) of the aquifer system, the unsaturated zone consists
of semi-permeable materials as clays, mixed with sands and gravels or intercalations of clay and
sand beds. The rest 33% consists of impermeable materials like red clay beds, marls and 3% only
consists of permeable sediments as gravels, pebbles, sands mixed with a small amount of clays.
The percentage contribution of the aquifers in the total thickness of the drilled sediments ranges
from 1.5 to 61% and the mean value is about 28%. The different aquifers range in thickness from0.5
to 50 m and the total thickness of the aquifer system up to a depth of 500 m is 140 m, ranging from
10 to 250 m. The boreholes (n=150) geometric mean values of yield is 40 m3
/h (10-140), specific
capacity (Sc) is 1.50 (m3
/h)/m (0.05-33.3), transmissivity (T) is 5.0*10-4
m2
/s (3.46*10-5
-2.92*10-
2
) and hydraulic conductivity (K) is 1.56*10-5
m/s (3.30*10-7
-1.01*10-3
) respectively. The most
favorable hydrogeological conditions for groundwater resources are located in the area extended
between the Epanomi and Agelochori village and the worst among Petralona, Scholari and
Lakkoma village. The N part of the aquifer system extending among Krini, Scholari, Mesimeri,
Lakkoma, Gonia, Petralona villages and N of Simandra village covers a total area of 160 Km2
(Figure 1). It consists of red beds, basal conglomerates, clays, clay-sands, sands, lacustrine
limestones with hard marl intercalations and clay-marls with sandstones intercalations. The
hydraulic conductivity of these formations is very low (K≤10-7
m/s) and the potentiometric surface
is very low (>150 m from the surface). Even in the deep (320 m) boreholes, yields are very low
(5-10 m3
/h) associated with low values of specific capacity [0.05 (m3
/h)/m]. There, the
groundwater quality is inhibiting its use as drinking water.
Pumping test data and the associated piezometric study revealed that the aquifer system is varied
from semi-confined to confined. Intense permeability variations characterize different strata either
in vertical or in horizontal dimension. This is attributed to grain size distribution of the materials
and the varying degrees of diagenesis process. Permeable sediments such as unconsolidated deposits
of sands and pebbles with hydraulic conductivity (k) ranging from 10-3
to 10-4
m/s, semi- permeable
sediments as consolidated conglomerates, sands, sandstones and marly limestones have intermediate
hydraulic conductivity ranging from 10-4
to 10-7
m/s. The marls, clays or mixtures of them with
sands and pebbles have a very low permeability or are almost impermeable materials (k =10-7
to 10-
9
m/s). According to their hydrolithological behavior and hydrogeological potential the different
geological formations of the study area are divided into the following classes (Figure 1).
(a) Micro pore permeable alluvial formations covering large areas and having a low resource
potential. They consist of alluvial fans, lake deposits of Holocene and Pleistocene river-torrent
deposits that overlie the Neogene sediments and are crossing the area of the aquifer system. Sections
across the alluvial fans show that they are lenticular in shape resulting in small thickness elongated
layers along the direction of the watercourses. The grain size is continuously decreased from
upstream to downstream and, in the same direction the thickness of the permeable strata is also
decreased. Alternations of clays, silts, sands, pebbles, gravels or a mixture of them can be observed
in these areas. Red clay beds, mixed with gravels, pebbles and sands (10-25 m in thickness)
compose most part of this formation. Due to lateral changes in the grain size composition of the
sediments and the presence of clay materials, the hydraulic conductivity of the formations varies
from 10-4
to 10-7
m/s. The aquifers are mostly composed of gravels, sands and conglomerates, and
are mainly located in the downhill parts of the streams. The aquifer materials have an effective
porosity ranging from 10 to 22%. Their hydrogeological interest is considered important because
they cover an area of 87 km2
and allow a high infiltration about 10-20% of the precipitation. They
also provide favorable conditions for the development of groundwater potential in the underlying
Neocene aquifers. They are recharged from direct percolation of precipitation (46-92 mm/yr) or
by percolation of surface waters that were once stored within the alluvial formations moving
5. downwards to deep Neogene aquifers. Shallow boreholes located in this hydrolithological
formation yield 10 to 30 m3
/h, but due to over-pumping in the last decades the alluvial aquifers
have been largely depleted in many places.
(b) Micro to macro-porous semi-permeable Neogene formations of large area and moderate potential.
They cover an area of 235 km2
in the Central and NW part of the aquifer system (Figure 1). The
formations belong to sandstone-marl series and consist of alternating beds of clays, clay- sands, sands,
clay-marls with intercalations of sandstones, conglomerates and marly limestones. The recharge of the
aquifers is by infiltration of precipitation (46 mm/yr), surface water percolation along the torrent beds
and lateral infiltration of karst aquifer of Katsika area. Τhe hydraulic conductivity of the different
formations ranges from 10-4
to 10-7
m/s depending on the grain size and clay content. Borehole yields
range from 20 to 140 m3
/h with mean value of 40 m3
/h. The specific capacity (Sc) values range from
0.5 to 12 (m3
/h)/m, transmissivity (T) ranges from 1.67*10-4
to 1.3*10-3
m2
/s and aquifers hydraulic
conductivity (K) from 3.30*10-6
to 8.0*10-5
m/s.
(c) Impervious to low permeability Neogene and Pleistocene microporous formations covering a
large area and of moderate to low potential in the underlying aquifers. These formations occupy
an area of 348 km2
and are mainly situated in the Central, S and E part of the aquifer system (Figure
1). They consist of red to brick bed clays and in places they include lenticular intercalations of sands,
marls, travertine, marly limestones and conglomerates. The red beds have a grain size less than
2μm in 50% of the material and the hydraulic conductivity is very low (k≤10-7
m/s). Borehole yields
range from 10 to 80 m3
/h with a mean value of 25 m3
/h. The higher borehole yields (40-80 m3
/h)
are usually found in the coastal area where the Neogene aquifers are also recharged by runoff
infiltration through the Quaternary deposits and the lower yields (10-25 m3
/h) in the topographic
uphill areas, close to contact with the basement rocks. The specific capacity (Sc) values range from
0.05 to 1.75 (m3
/h)/m with a geometric mean value of 0.4 (m3
/h)/m (n=50). Transmissivity (T)
ranges from 1.54*10-5
to 9.51*10-4
m2
/s and the geometric mean value is 1.50*10-4
m2
/s. Pumping
tests revealed that correlation between T and Sc parameters is: T =1.09*(Sc)1,11
, (R2
= 0.89,
n=15), where T and Sc values are expressed in m2
/day. This relationship for transmissivity values
≤ 40 m2
/day gives approximately similar results with the known empirical relationship of Logan
(T=1.22*Sc), which is generally applied for confined granular aquifers. The average total thickness
of the aquifers is 143 m (78-228). They comprise about 40% (28-59) of the drilled layers (200-
500 m). The aquifers average hydraulic conductivity (K) is 8.74*10-7
m/s, ranging from 9.1*10-
8
to 5.66*10-6
m/s. The water resource potentiality of this formation is considered relatively low
when compared to neighboring areas in the NW portion of the aquifer system.
5. Piezometry and hydrological balance
Systematic piezometric measurements were carried out by IGME in intervals of the period 1983-
2000 on 27 irrigation boreholes and 2004-2008 on 99 irrigation boreholes respectively (Veranis et
al. 2010). On the frame of this study, piezometric measurements were also conducted in October
2014. The depth of the PS ranges from 0.9 to 195 m and the geometric mean value is 33.62 m. The
higher depths (138-195 m) of the PS are found in the NE to E part (Agios Panteleimonas- Simantra-
Olynthos villages area) and in the N part (Lakkoma-Scholari-Petralona villages area) of the aquifer
system and the lower depths (0.9-10 m) in the coastal areas. The PS ranges between -38 to +165 m
a.s.l. and the geometric mean value is 0.35 m a.s.l. The inter-annual variation (ds) of the PS per
borehole ranges from 0.43 to 15.0 m, the values also follow the lognormal distribution with a
geometric mean value of ds=3.20 m (±2.2). The rate of the inter-annual fluctuations (ds) varies
depending on the region. In order to estimate the mean value of ds we have estimated the area of
influence for each borehole by Thiessen polygons. During the period 2004-08, no important decline
was observed in the area (A), except in the Akrotiri coastal area of Epanomi. On the contrary, in
the areas (B) and (C) we have estimated a decline of 0.2 m/yr and 0.6 m/yr respectively. In case that
6. we don’t take into account the PS decline which is attributed to abstractions of the permanent
reserves, the real mean value of ds is 2.90 m (Table 1).
Table 1 - Inter-annual real fluctuations of the potentiometric surface (period 2003-08).
a/a Area Area (km2) Mean(m) Range(m)
A Agelochori to Ag. Pavlos 140 1.70 0.5-6.0
B Ag. Pavlos-Gonia to Ag. Panteleimonas- Flogita 150 3.3 0.9-15.0
C Ag. Panteleimonas- Flogita-Moudania to
Agios Mammas-Kalyvia
220 3.4 1.3-9.0
Total area 510 X=2.9
According to piezometric measurements conducted by IGME in the period 1986-2000, it resulted
that PS underwent a constant downturn and the mean value was 0.72 m/yr (n=16 boreholes) ranged
from 2.5 to 0.08 m/yr per borehole. In the period 2003-08, upwards trends have been noticed in
many boreholes, mainly situated in the Central and NW part of the aquifer system, covering a total
area of 285 km2
or 56% and the mean PS value is 1.10 m (n=54). On the contrary, in E-SE and
partially in the Central parts, we noticed a decline of the PS with a geometric mean value 0,97 m
(n=40 boreholes) covering an area of 235 km2
corresponding to 46% of the aquifer system with
exploitable groundwater reserves (E=510 km2
).
Specifically, the areas where a decline of PS observed are: (a) Agios Pavlos- Kallikratia- Silata-
Eleochoria, (b) Triglia-Agios Panteleimonas-Simantra-Dionysiou, (c) Agios Mammas-Olynthos-
Kalyvia and (d) Akrotiri coastal area of Epanomi. These differences in the behavior of the PS are
attributed to different pressures applied to the aquifers due to intense pumping of a considerable
number irrigation and drinking water boreholes and differences in recharging rate. Static water level
measurements carried out in irrigation boreholes in the S part of the aquifer system during the period
2008-14, point to a gradual decline (0,5-1,5 m/yr) but data are not enough for the rest of the area
of the aquifer system in this period. The reversal in the trend of the PS from reduction in the period
1985-2000 to rising during 2003-08 in many boreholes could be explained by rainfall increase in
the period 2003-08 in relation to the period 1986-2000 and de- crease in consumption of irrigation
water (Veranis et al., 2010).
According to the groundwater flow contours, the water flow approximately follows the slope of
the topographical relief (Figure 1). The geomorphology directly affects the shape of the piezo-
metric contours by shaping curved and concave forms. The convergent and divergent contours are
also associated to the hydraulic characteristics of the aquifer system, the recharge and pressure of
the abstractions. The aquifer system on a broader scale is considered to be homogenized regarding
the hydraulic conductivity values in various directions and the directions of subsurface flow are
plotted perpendicular to the piezometric curves. The piezometry shows a general flow direction
from NE to SW for the larger part of the aquifer system (Figure 1).
In the NW part of the aquifer system, extending between Ιraklia and Agelochori villages, the
hydraulic gradient (i) is small and ranges from 0.002 to 0.0072. In this region, the piezometric con-
tours are invariably parallel to each other and this is attributed to unchanging hydraulic properties
of the aquifers. There doesn’t seem to be a strong influence on aquifer recharge by runoff percolation
or discharge along the stream beds. Low values on the hydraulic head make the aquifer system
vulnerable to the intrusion of seawater, and up to date the salinization was detected in Agelochori
and Akrotiri Epanomi coastal areas. In Lakkoma, Agios Pavlos and Kallikratia area the hydraulic
gradient is 0.005. Higher gradients (0.012- 0.015) are observed in the area between Agios Pavlos-
Kallikratia-Gonia and Silata area, as well as in the area between Triglia and Tenedos up to the
coastal area of Flogita village. In this area the piezometric curves have shapes associated with
the topographic relief. Along the stream valleys the hydraulic gradient has reduced due to water
pumping from a considerable number of irrigation boreholes. The curved surfaces of contours in
the area downhill of the Katsika are attributed to geomorphology and recharge from the karstic
7. aquifer by lateral infiltration (Figure 1). Within the coastal zone of Plagia and Flogita up to Tenedos
area the contours are convex. This is attributed to the topographic relief and the numerous irrigation
boreholes which caused the decline of the PS. The average hydraulic gradient of PS along the axis
Agios Panteleimonas-Zografou villages is 0.010. Elevated values (i=0.013) are found in the hilly
area (altitude 100-240 m) and lower (i=0.003) in lowland coastal area respectively.
During the last decades, the pressures due to water pumping were particularly intense and resulted
in PS decline, creating negative absolute elevations (max=-38 m a.s.l.) in the area of Portaria,
Zografou, Dionysiou beach and Flogita villages, where we also have noticed a reverse direction of
the hydraulic gradient (Figure 1). This procedure has resulted in aquifer contamination in the area
between Zografou and Dionysiou Beach due to mixing with sea water up to a distance of 2.5 km
from the coastline. In the E part of the aquifer system, the direction of groundwater flow is from
NNW to SSE and is parallel to the bed of Olynthios river (Figure 1). The hydraulic gradient ranges
from 0.013 to 0.015. Although the aquifer system is recharged by runoff percolation (5.5*106
m3
/yr)
along the bed of Olynthios river, due to great inclination of the main stream (25%0) and the pressures
from the abstractions, the equal potentiometric curves are of concave form and salinization occurs
in the coastal area aquifers of Agios Mammas and Kalyvia villages.
Due to intense long time pumping in drinking water wells and in some of the irrigation boreholes,
permanent cones of depression were created. Even after pumping stops, due to mingling of the
clay or marl layers, a long time (ranging from 2 to 6 months or more) is required to restore
the potentiometric surface to the former static level. The greater pressures to the aquifer system were
applied by irrigation and drinking water wells during the summer season, the period when the
aquifer’s recharge by the infiltration and run of percolation are low and simultaneously the PS is
at lower level. This procedure favors in many places the intrusion of sea water (salinization) in the
coastal areas and, thus deteriorating the groundwater quality. In some places (Agelochori, Akrotiri
Epanomi, Agios Pavlos, Flogita-Moudania and Ag. Mamma-Kalyvia) the PS decline has caused a
dramatic elimination or a total interruption of the previous aquifer natural discharge to the sea water.
Figure 2 - Fluctuations of the piezometric surface in the period 1984-2008 of Triglia-
Moudania area of west Chalkidiki aquifer system.
Inflows: The water balance study is referred to the period 2004-08, because systematic static level
measurements of the 99 boreholes are available for this time interval only. Data interpretation of
the broader area (Agios Mammas, Agios Pavlos, Mikra, Loutra Thermi and Polygyros)
meteorological stations reveals that, the average annual precipitation of the aquifer system area
0
10
20
30
40
50
60
70
14/5/84
14/5/86
14/5/88
14/5/90
14/5/92
14/5/94
14/5/96
14/5/98
14/5/00
14/5/02
14/5/04
14/5/06
14/5/08
Potentiometricsurfacedepth(m)
1 3 4 7 10 11
8. during the period 2002-08 is 458 mm and the mean annual temperature is 15.82 ο
C. Average
annual real evapotranspiration represents 83 % of total annual precipitation and amounts to 380
mm/yr. (Veranis et al., 2010). The sum of infiltration plus runoff is 78 mm/yr or 52.3*106
m3
/yr.
The mean value of the infiltration based on the distribution of the rock outcrops in the geological
map and the coefficient of infiltration for each rock type (Soulios, 2004) is 41 mm/yr (9%). Runoff
is calculated from the equation of water balance and is 37 mm/yr (8 %). Since limited amounts of
surface water arrive to the coast, apart from the direct infiltration (27.4*106
m3
/yr), the recharging
of the aquifer system occurs through surface waters percolation of Olynthios river (5.5*106
m3
/yr),
along the streams beds located in the aquifer system (24.9*106
m3
/yr) and from surface water
(2.7*106
m3
/yr) originating from the Vavdos mountainous area and crosscutting the aquifer sys-
tem. The total surface water quantities infiltrated to the aquifers system are 31.2*106
m3
/yr). The
aquifer system also enriched by lateral subsurface filtration of the Katsika karst area with 3.0*106
m3
/yr. Irrigation water quantities returning to the aquifer system are estimated about 8.5*106
m3
/yr
and correspond to 10-15% of the abstractions. Total inflows to the aquifer system are estimated to
be 72*106
m3
/yr.
Inflows were also estimated using the equation (1) for renewable reserves estimation: V=E*ds*ne,
Where, E=the area of the aquifer system with productive boreholes, ds=mean value of the inter-
annual static water level fluctuations. According to data from the lithology description of 150
borehole logs, the aquifers consist of unconsolidated to semi-consolidated sands, conglomerates,
sandstones and less of marly limestones and travertine lenses. The cementing materials are fine
sands, silts and clays. According to bibliography (Wolf, 1982) the mean value for the effective
porosity (ne) of these materials are estimated about 5%.
V=510km2
*2.9m*0.05=74*106
m3
/yr
Water pumping: For drinking water purposes consumptions are 14.0*106
m3
/yr, and for livestock
and other uses 0.4*106
m3
/yr. In earlier studies it was referred that, for the irrigation of 118.000
acres (in the year 2001) the pumped groundwater quantities were about 69*106
m3
/yr; this
corresponds to 585 m
3
/acre/yr but 10-15% of the irrigation water returns back to the aquifers (ENM
and Consulters 2008). The total water pumping reserves of the system are approximately estimated
to be 74*106
m3
/yr. Although inputs are approximately equal to outputs, due to differential
recharge rates and pressures applied from water pumping in the different parts of the aquifer
system, we observed a decline of the PS in some parts and rise in others respectively. The
discharges of the groundwater to the sea are estimated 1.5*106
m3
/yr and the inflows of seawater
to the land about 1.0*106
m3
/yr (Veranis et al., 2010).
6. Groundwater quality and contamination
In order to assess groundwater quality of the aquifer system, we evaluated hydrochemical data
from previous studies carried out by IGME in the period 2003-10 (Veranis et al., 2010), while in
the period 2011-14 chemical analyses were carried out by local authorities in samples collected
from drinking water boreholes only. The water samples were collected in dry and wet periods and
at least two samples correspond in each borehole.
The pH values of the groundwater vary between 6.62 and 8.75 with an average of 7.84 which
indicates the alkaline nature of groundwater of the study area. In about 96% of the collected
samples, the pH values are within the permissible range of 6.5 to 8.5 established for drinking water
by the Directive 98/83/EC/3. Electrical Conductivity (EC) ranges from 369 to 7182 μS/cm at 250
C,
with a geometric mean value of 887 μS/cm. In only 3% of the boreholes, the EC values were above
the maximum permissible limit (2500 μS/cm) for the potable water.
9. The geometric mean value of the total hardness is 358 mg/l and ranges from 60 to 1536 mg/l (as
equivalent CaCO3). In 3% of the boreholes, the values of total hardness are less than 150 mg/l
(medium hardness waters), in 25% they range from 150 to 300 mg/l (hard waters) and in 72% they
are more than 300 mg/l (very hard waters). High hardness values (> 500 mg/l) represent 18.5% of
the analyzed samples and attributed to salinization process or mixing with geothermal waters of
the karst. Elevated concentrations of calcium, magnesium, sodium and potassium are attributed to
contamination by sea water or mixing with geothermal waters. The increased values of magnesium
(60-180 mg/l) located in some of the coastal areas are associated with sea water contamination and
in the NE part of the aquifer system are attributed to the ophiolites weathering products mixed
with the sediments.
The mean concentration of the cations is in the order Mg>Na>Ca+
>K, while those of the anions i
HCO3 >Cl > SO4 >NO3 respectively. The ratio HCO3/SiO2 ranges from 5.5 to 94 (n=121
boreholes). In only 6 samples the values are less than 10, indicating ubiquitous weathering. In
115 samples, the HCO3/SiO2 ratio ranges from 10 to 94 indicating the prevalence of carbonate
rather than silicate weathering and the recharge zone is at a small distance (Hounslow, 1995).
Depending on, (a) the local lithological variations, (b) ion exchange reactions, (c) the time of the
groundwater remaining in contact with rock materials, (d) sea water or geothermal waters
contamination, different types of groundwater are detected. Hydrochemical data interpretation
using the software AquaChem indicated that the most dominant (41%) water–type is Na-Mg-Ca-
HCO3±Cl.±SO4. In 21% of the analyzed samples the magnesium ions prevail and the water-type is
Mg-Ca-Na-HCO3±Cl.±SO4. In 24% of the samples the calcium ions prevail and the water-type is
Ca-Mg-Na-HCO3±Cl.±SO4.The water types as Ca-Mg-HCO3 or Mg-Ca-HCO3 corresponds to 10%
of the samples indicating a meteoric origin of the groundwaters with small retention time. The rest
4% of the samples correspond to different water-types, such as Mg-HCO3, Mg-Ca-Cl, Na-HCO3-
Cl, Mg-Ca-Na-Cl and are usually associated with sea water contamination. Graphic chemistry
presentation of the water samples by Piper and Durov diagrams is given in Figure 3.
Chlorine content ranges from 14.1 to 3085 mg/l and the geometric mean value is 92.2 mg/l. In
90% of the boreholes, the chlorine content is less than 250 mg/l (the upper permissible level for
the drinking water). Elevated concentrations of chlorine (250-3085 mg/l) are attributed to
contamination with sea water in the coastal areas of Agelochori, Akrotiri-Epanomi, Agios
Pavlos, Moudania- Portaria and Agios Mammas-Kalyvia. High contents of chlorine (200-303
mg/l) were also detected in the Tenedos -Triglia-Silata area and are attributed to contamination
by geothermal waters which laterally infiltrate from the Katsika karst area to the neighboring
fresh water granular aquifers. Sporadic elevated values of chlorine (200-330 mg/l), which were
determined in irrigation bore- holes of the Gonia area, are associated to the disposal of untreated
waste of domestic origin or farming installations to hydrographic network.
Nitrate (NO3) content ranges from 0.1 to 215 mg/l and the geometric mean value is 9.3 mg/l
(n=220). In 25% of the boreholes, nitrate content is 3.97 mg/l, in 75% of the samples is 26.4 mg/l
and values more than 50 mg/l correspond to 6%. In 21.6% of the sampled boreholes the nitrate
values are exceeding the threshold value (ΤV) =(50+9.3)/2=29.6 mg/l NO3. In case that nitrate
concentrations are more than the TV75 value (in our case TV 75=22 mg/l) as defined by EU
2000/60 (article 17.2a & 17.2b) and the Daughter Guide 2006/118/EU measures must be taken in
order to eliminate the nitrate increase (Veranis et al., 2010).
10. Figure 3 - Graphical representation of the chemistry of the water samples in Piper and
Durov diagrams.
Groundwater from potable and irrigation water boreholes was also analyzed for trace elements. The
iron content usually is within the drinking water standards (<200 μgr/l). In 7% (n=17) of the
sampled boreholes we observe a high iron content (210-5500 μgr/l). The manganese content in
14.5% (n=33) of the boreholes ranges from 50 to 850 μgr/l, exceeding drinking water standards
(50 μgr/l). Relatively increased values (1600-5600 μgr/l, n=45) of boron, exceeding drinking
water standards (1000 μgr/l) were determined in the groundwaters of Triglia- Tenedos to Plagia-
Sozopolis areas covering a surface of 100 km2
. The arsenic content is usually low (<5 μgr/l) in
general, however higher arsenic (11-3487 μgr/l) contents are found in the groundwaters of the
same area as for high boron values. The elevated boron and arsenic values in the groundwaters are
attributed to the contamination by geothermal waters (33-350
C) from Katsika karst area. They
have elevated contents of boron (4000-8000 μgr/l) and arsenic (500-3600 μgr/l) and infiltrate to
the granular aquifers contaminating the fresh groundwater. The geothermal waters of Katsika karst
area, besides the high values of B and As, contain also relatively high values of EC, Ca, Cl, HCO3,
Na, K, F, U and Li (Veranis et al., 2010). The contents of other trace elements analyzed (Cr, Ni, Al,
Co, Pb, Zn, Cu, Cd, Sb, Se, U, Rn) are within the permissible limits for the domestic water. The
natural or anthropogenic contamination of areas in the aquifer system, have been defined by the
hydrogeochemical research and these results must be taken into account for site selection of the
drinking water boreholes.
Since the main groundwater uses of the aquifer system are for irrigation water we have evaluated
the water quality for irrigation purposes. The most important characteristics of water which deter-
mine the suitability of groundwater for irrigation purpose are: Salinity, TDS, Relative Proportion
of Sodium to other Cations (SAR), HCO3 content, Residual Sodium Carbonate (RSC), the values
of sodium percentage (Na%). Permeability Index (P.I) and trace elements such as B, As, F, Cu, Fe,
Mn, Mo, Al, Cr, Co, Li, Sb, Ni, V, Zn, Pb (EPA 2004). In 96% of the boreholes analyzed the waters
are suitable for irrigation water purposes (Veranis et al., 2010).
7. Conclusions
The aquifer system of west Chalkidiki area (667 km2
) is a multilayered system semi-confined to
confined, consisting of unconsolidated to semi-consolidated sands, gravels, conglomerates, sand-
stones and marly limestones with intercalations of impermeable to semi-permeable beds of red clays
and marls or a mixture of them. The aquifer system hydrocapacity is of medium to moderate potential.
11. The geometric mean value of borehole (n=150) yields is 40 m
3
/h (10-140), specific capacity (Sc) is
1.50 (m3
/h)/m (0.08-33.3), transmissivity (T) is 5.0*10-4
m2
/s (3.46*10-5
-2.92*10-2
) and hydraulic
conductivity (K) is 1.56*10-5
m/s (3.30*10-7
-1.01*10-3
) respectively. The groundwater abstractions
are 74*106
m3
/yr. Based on data of piezometric studies carried out in the period 2003-14, it is
concluded that the piezometric surface decline is located in Kalyvia-Agios Mammas, Portaria-
Dionysiou, Akrotiri Epanomi and Agelochori coastal areas and resulted to salinization of the coastal
area aquifers. In the rest Central and NW part of the aquifer system we have noticed a positive water
balance relation between the aquifers recharge and water pumping quantities or the recharge is
higher than the pumped water quantities.
Groundwater has generally a good quality, with the exception of Triglia–Tenedos-Plagia- Sozopoli-
Silata area (100 km2
) where the groundwater contains high values of As (3400-10 μgr/l), B (4.0-1.5
mg/l) ± Cl (200-250 mg/l). Other common natural contaminants exceeding the recommended
drinking water standards are iron (210-5500 μgr/l) and manganese (50-850 μgr/l) corresponding to
7% and 14.5% of the analyzed samples respectively. High values of nitrate (50-208 mg/l) are
located in some boreholes in Moudania-Portaria and Akrotiri Epanomi areas.
From the total area of the aquifer system (667 km2
), it can be concluded that exploitable groundwater
reserves are found in 510 km2
and about 300 km2
contain potable groundwaters. Since the water balance
in the most part of the aquifer system is negative, it is necessary to protect the groundwater reserves
by constructing a dam in the Olynthios river in order to eliminate the groundwater consumptions.
8. References
ENM and Consultants, 2008. Developing water resources management plans of West Macedonia,
Central Macedonia and Thraki Regions, Northern Greece. Water resources management
plans of the water districts (SAE061/3 – 20002 SE06130000), Special Secretary of Water
Resources, Athens, Unp. report (in Greek).
EPA, 2004. Guidelines for Water Reuse, Washington, DC, 450 pp.
Hounslow, A., 1995. Water Quality Data: Analysis and Interpretation, Lewis Publ., 416 pp.
Loehnert, E. and Papakonstantinou, A., 1988. Relationship between karst and porous aquifers on the
Chalkidiki peninsula, In: Greece, IAH 21rst Congress on Karst hydrogeology and karst
environmental protection, Beijing, China, 321–326.
Soulios, G., 2004. General Hydrogeology, STUDIO PRESS, Thessaloniki, 374 pp.
Syrides, G., 1990. Lithostratigraphic, biostratigraphic and paleogeographic study of the Neogene-
Quaternary sedimentary deposits of Chalkidiki Peninsula, Northern Greece, Ph Degree
study, Geological Department, Aristotle University, Thessaloniki, 340 pp. (in Greek).
Wolff, G., 1982. Physical Properties of rocks-Porosity, Permeability, Distribution Coefficient and
Dispersivity, U.S. Geol. Survey, Open file Report 1982, 82-116, 118 pp.
Xefteris, A., 2000. Study of quality degradation of ground water in Kalamaria plain with empha sis
to nitrate contamination, PhD Degree, AUTH, Civil Eng. Department, 309 pp.
Veranis, Ν., Kalousi, E., Lazaridou, M., Pratanopoulos, A. and Chatzikyrkou, A.,
2010.Hydrogeological Study of the aquifer systems of Central Macedonia Region, CSF
Project (2003-2009) “Inventory and Assessment of Hydrogeological Character of the
aquifer systems of the country”, RUCM-IGME, 15 issues, maps (in Greek).