SlideShare une entreprise Scribd logo
1  sur  9
Télécharger pour lire hors ligne
Anand Rathi Share and Stock Brokers Limited (hereinafter “ARSSBL”) is a full-service brokerage and equities-research firm and the views expressed therein are solely of
ARSSBL and not of the companies which have been covered in the Research Report. This report is intended for the sole use of the Recipient. Disclosures and analyst
certifications are present in the Appendix.
Anand Rathi Research India Equities
Technology
Company Update
India I Equities
Key financials (YE Mar) FY15 FY16 FY17 FY18e FY19e
Sales (` m) 35,461 46,730 52,364 53,128 57,075
Net profit (` m) 5,322 5,523 4,160 4,695 5,459
EPS (`) 31.5 31.6 24.8 28.0 32.5
Growth (%) 22.6 0.2 -21.6 12.8 16.3
PE (x) 16.1 16.0 20.4 18.1 15.6
PBV (x) 4.0 3.7 3.3 3.0 2.7
RoE (%) 27.6 24.3 16.7 17.3 18.3
RoCE (%) 23.6 21.1 15.1 12.9 14.8
Dividend yield (%) 1.7 2.0 1.9 2.1 2.5
Net debt/equity (x) -0.4 -0.1 -0.3 -0.4 -0.5
Source: Company, Anand Rathi Research
Mohit Jain
Research Analyst
+9122 6626 6531
mohitjain@rathi.com
Shobit Singhal
Research Associate
+9122 6626 6511
shobitsinghal@rathi.com
`
Rating: Hold
Target Price: `520
Share Price: `507
Key data MTCL IN / MINT.BO
52-week high / low `621/ `399
Sensex / Nifty 31955 / 9900
3-m average volume $5.5m
Market cap `85bn/$1325.1m
Shares outstanding 168m
Shareholding pattern (%) Jun'17 Mar'17 Dec'16
Promoters 13.6 13.7 13.7
- of which, Pledged - - -
Free float 86.4 86.3 86.3
- Foreign institutions 39.9 39.2 39.0
- Domestic institutions 6.9 7.1 7.2
- Public 39.6 40.1 40.1
20 July 2017
Mindtree
Acquisitions dragging performance; downgrade to Hold.
Mindtree had a weak Q1 with both revenue (US$200m, +2.3%qoq) and
margins (11.1%, -309bps qoq) missing expectations, primarily due to a
~US$2.5m revenue shortfall created by Bluefin and Magnet360.
Margins were further impacted by visa costs, cost overruns, and
currency. Growth outlook was cut to high single digit (from low double
digit) growth in FY18 and margin outlook was discontinued. The
positives were strong volumes (+3.7%qoq), better deal wins (+8%yoy
TTM), and higher onshore proportion (+250bpsqoq). We revise FY18
estimates sharply and hope for a recovery in FY19, factoring in
positives above. Revise target to `520 (from `535) at 16x FY19 EPS.
One challenge – Acquired entities and associated volatility. Mindtree
faced twin challenges of drag from acquisitions and stagnation in top
accounts. Both Bluefin (US$7.3m, -19%qoq) and Magnet360 (US$6.5m, -
13%qoq) witnessed sharp decline in revenues and recovery is taking time. The
other challenge, weakness in top accounts (top 10 are 41% of Rev) is getting
offset by growth in other accounts (+3%qoq in 1QFY18, +2.5%qoq in
4QFY17). In terms of margins, there is 240bps impact of the acquisitions on
consolidated margins, including US$1m cost overrun in Bluefin.
All is not lost, scope for margin recovery in FY18. This is second
consecutive quarter of utilization improvement (+150bps in last 6M, now at
73.8%) and it can act as an important lever for margins (especially when
growth slows). Management also alluded to higher offshore proportion of
work in matured digital deals as another lever. Lastly, Mindtree is now a
US$800m company (quarterly annualized basis) which puts it in a strong
position to extract scale benefits.
Valuation. We are revising FY18 and FY19 estimates downwards by ~11%
and ~4% respectively, factoring in current exchange rate (`64.5/$) and
building in margin recovery in FY19. Our target price at `520, is based on 16x
FY19e. Risk. Sharp rupee appreciation.
Relative price performance
Source: Bloomberg
MTCL
Sensex
400
450
500
550
600
650
Jul-16
Aug-16
Sep-16
Oct-16
Nov-16
Dec-16
Jan-17
Feb-17
Mar-17
Apr-17
May-17
Jun-17
Jul-17
Estimates revision (%) FY18e FY19e
Sales($) (1.5) (2.0)
EBITDA (21.2) (10.6)
PAT (11.0) (4.2)
Change in Estimates Target Reco 
20 July 2017 Mindtree – Acquisitions dragging performance; downgrade to Hold.
Anand Rathi Research 2
Quick Glance – Financials and Valuations
Fig 1 – Income statement (`m)
Year-end: Mar FY15 FY16 FY17 FY18e FY19e
Net revenues 35,461 46,730 52,364 53,128 57,075
Revenue growth (%) 17.4 31.8 12.1 1.5 7.4
- Oper. expenses 28,455 38,520 45,183 46,473 48,873
EBIDTA 7,006 8,210 7,181 6,655 8,201
EBITDA margins (%) 19.8 17.6 13.7 12.5 14.4
- Interest 2 161 191 101 42
- Depreciation 1,016 1,648 1,848 1,827 1,998
+ Other income 876 813 407 1,491 1,174
- Tax 1,542 1,691 1,389 1,523 1,876
Effective tax rate (%) 22.5 23.4 25.0 24.5 25.6
+ Associates/(minorities) - - - - -
Adjusted PAT 5,322 5,523 4,160 4,695 5,459
+ Extraordinary items - - - - -
Reported PAT 5,322 5,523 4,160 4,695 5,459
Adj. FDEPS (`/sh) 31.5 31.6 24.8 28.0 32.5
Adj. FDEPS growth (%) 22.6 0.2 -21.6 12.8 16.3
Source: Company, AnandRathi Research
Fig 3 – Cash-flow statement (`m)
Year-end: Mar FY15 FY16 FY17 FY18e FY19e
Adjusted PAT 5,322 5,523 4,160 4,695 5,459
+ Non-cash items 1,016 1,648 1,848 1,827 1,998
Cash profit 6,338 7,171 6,008 6,522 7,456
- Incr./(decr.) in WC -213 1,689 -1,031 -1,000 62
Operating cash-flow 6,551 5,482 7,039 7,521 7,395
- Capex 3,012 7,771 420 1,149 1,235
Free cash-flow 3,539 -2,289 6,619 6,372 6,160
- Dividend 1,715 2,087 1,928 2,113 2,456
+ Equity raised 378 -537 -636 - -
+ Debt raised 91 712 -25 - -
- Investments -285 -2,770 3,854 2,938 4,406
- Misc. items - - - - -
Net cash-flow 2,578 -1,431 176 1,322 -702
+ Op. cash & bank bal. 1,185 3,763 2,332 2,508 3,830
Cl. Cash & bank bal. 3,763 2,332 2,508 3,830 3,128
Source: Company, AnandRathi Research
Fig 5 – Price movement
Source: Bloomberg
Fig 2 – Balance sheet (`m)
Year-end: Mar FY15 FY16 FY17 FY18e FY19e
Share capital 837 1,678 1,680 1,680 1,680
Reserves & surplus 20,443 22,501 24,095 26,677 29,679
Net worth 21,280 24,179 25,775 28,357 31,359
Total debt 178 829 996 996 996
Minority interest - - - - -
Def. tax liab. (net) -493 -432 -624 -624 -624
Capital employed 20,965 24,576 26,147 28,729 31,731
Net fixed assets 4,665 4,383 3,991 3,313 2,550
Intangible assets 1,042 7,447 6,411 6,411 6,411
Investments 4,808 2,038 5,892 8,829 13,235
- of which, Liquid 4,790 2,016 5,869 8,804 13,205
Working capital 6,687 8,376 7,345 6,346 6,407
Cash 3,763 2,332 2,508 3,830 3,128
Capital deployed 20,965 24,576 26,147 28,729 31,731
Working capital (days) 69 65 51 44 41
Book value (`/sh) 126.1 138.4 153.5 168.9 186.8
Source: Company, AnandRathi Research
Fig 4 – Ratio analysis@ `507
Year-end: Mar FY15 FY16 FY17 FY18e FY19e
P/E (x) 16.1 16.0 20.4 18.1 15.6
Cash P/E (x) 13.5 12.3 14.2 13.0 11.4
EV/EBITDA (x) 10.9 9.9 10.8 11.0 8.5
EV/sales (x) 2.2 1.7 1.5 1.4 1.2
P/B (x) 4.0 3.7 3.3 3.0 2.7
RoE (%) 27.6 24.3 16.7 17.3 18.3
RoCE (%) 23.6 21.1 15.1 12.9 14.8
Dividend yield (%) 1.7 2.0 1.9 2.1 2.5
Dividend payout (%) 32.2 37.8 46.4 45.0 45.0
Net debt/equity (x) -0.4 -0.1 -0.3 -0.4 -0.5
Debtor (days) 82 93 76 74 74
Inventory (days) - - - - -
Payables (days) 18 15 12 12 12
CFO:PAT% 110.7 76.0 157.1 132.0 114.7
CFO:Sales% 16.6 9.0 12.5 11.7 11.0
Source: Company, AnandRathi Research
Fig 6 – EBIT margin
Source: Company
100
200
300
400
500
600
700
800
Jul-12
Nov-12
Mar-13
Jul-13
Nov-13
Mar-14
Jul-14
Nov-14
Mar-15
Jul-15
Nov-15
Mar-16
Jul-16
Nov-16
Mar-17
Jul-17
(`)
MTCL
0.0
2.0
4.0
6.0
8.0
10.0
12.0
1QFY17
2QFY17
3QFY17
4QFY17
1QFY18
(%)
20 July 2017 Mindtree – Acquisitions dragging performance; downgrade to Hold.
Anand Rathi Research 3
Result Highlights
Q1FY18 Results at a Glance
Fig 8 – Quarterly result
Year-end: Mar Q1FY18 % qoq % yoy FY17 FY16 % yoy
Sales ($ m) 200 2.3 0.6 780 715 9.0
Sales (`m) 12,895 (2.2) (2.9) 52,364 46,730 12.1
EBITDA (`m) 1,429 (23.5) (26.9) 7,181 8,210 (12.5)
EBITDA margin (%) 11.1 -309 bps -364 bps 13.7 17.6 -386 bps
EBIT (`m) 979 (30.2) (34.2) 5,333 6,562 (18.7)
EBIT margin (%) 7.6 -304 bps -361 bps 10.2 14.0 -386 bps
PBT (`m) 1,590 26.3 (2.5) 5,549 7,214 (23.1)
Tax (`m) (373) 30.4 (11.6) (1,389) (1,691) (17.9)
Tax rate (%) (23.5) -74 bps 243 bps (25.0) (23.4) -159 bps
Net Income (`m) 1,217 25.1 0.7 4,160 5,523 (24.7)
Source: Company
Fig 7 – Segment-wise results
Q1FY17 Q2FY17 Q3FY17 Q4FY17 Q1 FY 18 QoQ YoY%
Revenues ($m) 199 193 192 196 200 2.3% 1%
Growth YoY % 28% 7% 4% 0% 1% 55bps -2792bps
Volume growth % 2.4% -1.8% -3.0% 2.2% 3.7% 151bps 129bps
Revenues (Rsm) 13,276 12,954 12,953 13,181 12,895 -2% -3%
Eff. exchange rate 66.7 67.1 67.4 67.4 64.4 -4% -3%
Employees (EoP) 16,110 16,219 16,099 16,470 16,561
Revenue Productivity ($ ‘000/employee) 12.4 11.9 11.9 11.9 12.1 2% -2.2%
Gross Utilization (IT services) 72.0% 73.1% 72.3% 72.7% 73.8% 110bps 180bps
Attrition 16.5% 16.4% 16.1% 15.1% 14.0% -110bps -250bps
CoR (excluding D&A) (8,660) (8,659) (8,516) (8,817) (8,937) 1% 3%
As % of Revenues -65% -67% -66% -67% -69% -241bps -408bps
SG&A (2,661) (2,677) (2,697) (2,496) (2,529) 1% -5%
As % of Revenues -20% -21% -21% -19% -20% -68bps 43bps
EBITDA 1,955 1,618 1,740 1,868 1,429 -24% -27%
EBITDA margins % 15% 12% 13% 14% 11% -309bps -364bps
EBIT 1,487 1,161 1,283 1,402 979 -30% -34%
EBIT margins % 11% 9% 10% 11% 8% -304bps -361bps
Other Income 106 195 110 132 632 379% 496%
Forex gain/loss 88 (28) 32 (228) 19 -108% -78%
PBT 1,630 1,281 1,379 1,259 1,590 26.3% -2%
PBT margins % 12% 10% 11% 10% 12% 278bps 5bps
Taxes (422) (332) (349) (286) (373) -30.4% -12%
ETR % -26% -26% -25% -23% -23% -74bps 243bps
PAT 1,208 949 1,030 973 1,217 25.1% 1%
PAT Margin % 9% 7% 8% 7% 9% 206bps 34bps
Source: Company, Anand Rathi Research
20 July 2017 Mindtree – Acquisitions dragging performance; downgrade to Hold.
Anand Rathi Research 4
Conference call highlights
Business
 Revenue growth was impacted owing to volatility among few clients,
slower ramp up of the deals, and ramp-down of few projects in Bluefin
and Magnet 360.
 EBITDA margins impacted due to visa cost (-150 bps), currency
headwinds (-90 bps) and losses in Bluefin and Magnet 360 (-70bps).
 Bluefin quarterly revenue run rate stood at USD 7.3m, while Magnet
360 revenue run rate stood at USD 6.5m. Both the entitiesare expected
to face volatility in revenues. Within the two, Magnet360 is expected to
recover faster as it is only facing delays in project closures. Bluefin is
facing execution challenges – including cost overruns in fixed rice
project.
 Ex subsidiaries and currency movements, Mindtree expects to improve
its EBITDA margins in FY18.
 Out of 2 large deals won in Q3 FY 17 one customer is progressing as
per plan and has started contributing to revenues in this quarter. But
the other customer is a quarter behind schedule due to evolving
regulatory environment in the US.
 70% of employees will receive salary hike in Q2.Average salary hike in
offshore would be 5.5%, while onshore it would be 1.8%. This will be
absorbed in 2Q as visa expenses will not be there.
 There is a churn in top accounts and hence, top 2-10 accounts look
stagnant. However, with new clients coming in the top 10 category,
company believes that growth will return in top accounts in FY18.
 The Company entered into a payment resolution agreement with
the erstwhile shareholders of one of the subsidiaries.
Consequently, `374m representing liability no longer required
and written back has been recognised under other income.
 
Business Outlook
 Company has revised revenue growth guidance for FY18 to high single
digit from low double digit and expects organic business to perform
well.
 Margin guidance was discontinued for the consolidated entity due to
extreme volatility in the two subsidiaries. (7% of Revenues)
20 July 2017 Mindtree – Acquisitions dragging performance; downgrade to Hold.
Anand Rathi Research 5
Factsheet
Fig 9 – Revenue-split, by industry
(%) Q1FY17 Q2FY17 Q3FY17 Q4FY17 Q1FY18
BFSI 24.9 24.7 24.1 24.7 25.1
Manufacturing - Includes Retail and CPG 24.1 24.2 24.1 23.0 22.7
Hi-Tech/PES 36.1 36.7 36.7 37.5 37.9
Travel and Hospitability 15.0 14.4 15.1 14.9 14.3
Others 0.0 0.0 0.0 0.0 0.0
Source: Company
Fig 10 – Revenue-split, by services
(%) Q1FY17 Q2FY17 Q3FY17 Q4FY17 Q1FY18
ADM 40 39.8 39.9 39.7 41.6
Enterprise Solutions 18 16.9 16.3 16.6 14.9
Assurance Solutions / Testing 12.8 12.4 12.6 12.5 11.8
Engineering & Industrial Services 9.8 9.8 9.5 9.5 9.6
IMS 18.4 19.9 20.3 20.4 21
Asset Leveraged Solutions 1 1.2 1.4 1.3 1.1
Source: Company
Fig 11 – Revenue-split, by region
(%) Q1FY17 Q2FY17 Q3FY17 Q4FY17 Q1FY18
North America 66.7 67.6 68.7 69.8 69.6
Continental Europe 23.1 21.4 20.8 20.8 21.1
India 3.1 3.5 3.1 2.8 3
APAC 7.1 7.5 7.4 6.6 6.3
Source: Company
Fig 12 – Operational Performance
(%) Q2FY17 Q3FY17 Q4FY17 Q1FY18
Top-five verticals growth (yoy)
BFSI 3 (3) 1 1
Manufacturing (1) (0) (3) (5)
Travel and Hospitability 9 (0) (9) (4)
Hi-Tech 15 15 6 6
Top-five horizontals growth
(yoy)
ADM (4) (4) (3) 5
Enterprise Solutions 12 10 (6) (17)
Assurance Solutions / Testing 4 3 (1) (7)
Engineering & Industrial
Services
22 19 (3) (1)
IMS 25 17 17 15
Key geographical growth (yoy)
North America 14 13 6 5
Europe (14) (18) (15) (8)
Source: Company
20 July 2017 Mindtree – Acquisitions dragging performance; downgrade to Hold.
Anand Rathi Research 6
Fig 13 – Operational Performance
Q1FY17 Q2FY17 Q3FY17 Q4FY17 Q1FY18
Client profiling
$1m+ 98 107 106 111 113
$5m+ 31 30 30 30 33
$10m+ 16 16 17 16 16
$20m+ 5 6 4 4 3
$50m+ 2 2 1 1 1
Client Addition (LTM)
$1m+ 10 15 13 10 15
$5m+ 3 1 1 (1) 2
$10m+ 3 3 4 1 -
$20m+ (1) - (1) (2) (2)
$50m+ - - (1) (1) (1)
Source: Company
Fig 14 – Employee movement
Q1FY17 Q2FY17 Q3FY17 Q4FY17 Q1FY18
Employees (EoP) 16,110 16,219 16,099 16,470 16,561
Gross Addition 210 744 470 914 645
Attrition 675 663 650 615 578
Net Addition -513 109 -120 371 91
Attrition % - LTM 17% 16% 16% 15% 14%
Utilization % (cum trainees) 71% 71% 71% 71% 73%
Utilization % (ex trainees) 72% 73% 72% 73% 74%
Source: Company
20 July 2017 Mindtree – Acquisitions dragging performance; downgrade to Hold.
Anand Rathi Research 7
Valuations
The stock trades at 15.6x FY19e EPS of`32.4. This, we think, is fair, given
that Mindtree is one of the better mid-sized IT companies with the
potential to touch $1bn by 2020. Also, it enjoys a strong balance sheet and
has strong free-cash-flow generation.
It is currently exhibiting volatility on account of weaknesses in its top
clients but the deal wins in the last six months suggest its ability to compete
in a tough environment and return to industry-level growth.
Also, it has margin levers in the business, primarily the employee-pyramid
correction and utilisation to absorb headwinds in margins. At present,
acquisitions are dragging down the performance but are expected to
recover in FY18.
Fig 15 – Change in estimates
FY18 FY19
New Old Chg % New Old Chg %
Revenues ($m) 824 837 (1.5) 885 903 (2.0)
Revenues (`m) 53,128 56,052 (5.2) 57,075 60,510 (5.7)
EBITDA (`m) 6,655 8,441 (21.2) 8,201 9,172 (10.6)
EBITDA Margin % 12.5% 15.1% -253 bps 14.4% 15.2% -79 bps
EBIT (`m) 4,828 6,530 (26.1) 6,204 7,082 (12.4)
EBIT Margin % 9.1% 11.7% -256 bps 10.9% 11.7% -83 bps
PBT 6,217 7,090 (12.3) 7,335 7,744 (5.3)
Net profit 4,695 5,273 (11.0) 5,459 5,698 (4.2)
Source: Anand Rathi Research
We expect Mindtree to recoup in FY18 some of the margin erosion it
suffered in 1QFY18, leading to FY18 margins trending toward 12.5%. We
value it based on a target PE of 16x FY19e EPS, similar to other
companies in Indian IT, which we like due to their quality management,
business and corporate governance (Persistent, Cyient).
Fig 16 – PE band
Source: Bloomberg, Anand Rathi Research
Risks
 Sharp rupee appreciation.
0.0
5.0
10.0
15.0
20.0
25.0
30.0
Apr-13
Jul-13
Oct-13
Jan-14
Apr-14
Jul-14
Oct-14
Jan-15
Apr-15
Jul-15
Oct-15
Jan-16
Apr-16
Jul-16
Oct-16
Jan-17
Apr-17
Jul-17
PERatio(1yearforward)
Appendix
Analyst Certification
The views expressed in this Research Report accurately reflect the personal views of the analyst(s) about the subject securities or issuers and no part of the
compensation of the research analyst(s) was, is, or will be directly or indirectly related to the specific recommendations or views expressed by the research
analyst(s) in this report. The research analysts are bound by stringent internal regulations and also legal and statutory requirements of the Securities and Exchange
Board of India (hereinafter “SEBI”) and the analysts’ compensation are completely delinked from all the other companies and/or entities of Anand Rathi, and have
no bearing whatsoever on any recommendation that they have given in the Research Report.
Important Disclosures on subject companies
Rating and Target Price History (as of 19 July 2017)
Date Rating
TP
(`)
Share
Price (`)
1 11-Feb-14 Buy 463 365
2 01-Apr-14 Buy 438 339
3 04-Jun-14 Buy 450 390
4 12-Jun-14 Buy 475 432
5 04-Jul-14 Hold 475 426
6 18-Jul-14 Buy 500 441
7 20-Aug-14 Sell 500 508
8 01-Oct-14 Sell 575 589
9 16-Oct-14 Hold 585 518
10 05-Jan-15 Sell 640 636
11 20-Jan-15 Sell 680 706
12 09-Apr-15 Sell 655 733
13 17-Jul-15 Sell 640 615
14 19-Jan-16 Sell 690 735
15 19-Apr-16 Sell 710 731
16 19-Jul-16 Hold 650 614
17 06-Sep-16 Buy 630 525
18 24-Oct-16 Hold 550 479
19 20-Jan-17 Hold 535 485
20 21-Apr-17 Buy 535 443
Anand Rathi Ratings Definitions
Analysts’ ratings and the corresponding expected returns take into account our definitions of Large Caps (>US$1bn) and Mid/Small Caps (<US$1bn) as described
in the Ratings Table below:
Ratings Guide (12 months)
Buy Hold Sell
Large Caps (>US$1bn) >15% 5-15% <5%
Mid/Small Caps (<US$1bn) >25% 5-25% <5%
Research Disclaimer and Disclosure inter-alia as required under Securities and Exchange Board of India (Research Analysts) Regulations, 2014
Anand Rathi Share and Stock Brokers Ltd. (hereinafter refer as ARSSBL) (Research Entity) is a subsidiary of Anand Rathi Financial Services Ltd. ARSSBL is a
corporate trading and clearing member of Bombay Stock Exchange Ltd, National Stock Exchange of India Ltd. (NSEIL), Multi Stock Exchange of India Ltd (MCX-
SX), United Stock Exchange and also depository participant with National Securities Depository Ltd (NSDL) and Central Depository Services Ltd. ARSSBL is
engaged in the business of Stock Broking, Depository Participant and Mutual Fund distributor.
The research analysts, strategists, or research associates principally responsible for the preparation of Anand Rathi research have received compensation based
upon various factors, including quality of research, investor client feedback, stock picking, competitive factors and firm revenues.
General Disclaimer: This Research Report (hereinafter called “Report”) is meant solely for use by the recipient and is not for circulation. This Report does not
constitute a personal recommendation or take into account the particular investment objectives, financial situations, or needs of individual clients. The
recommendations, if any, made herein are expression of views and/or opinions and should not be deemed or construed to be neither advice for the purpose of
purchase or sale of any security, derivatives or any other security through ARSSBL nor any solicitation or offering of any investment /trading opportunity on behalf
of the issuer(s) of the respective security (ies) referred to herein. These information / opinions / views are not meant to serve as a professional investment guide for
the readers. No action is solicited based upon the information provided herein. Recipients of this Report should rely on information/data arising out of their own
investigations. Readers are advised to seek independent professional advice and arrive at an informed trading/investment decision before executing any trades or
making any investments. This Report has been prepared on the basis of publicly available information, internally developed data and other sources believed by
ARSSBL to be reliable. ARSSBL or its directors, employees, affiliates or representatives do not assume any responsibility for, or warrant the accuracy,
completeness, adequacy and reliability of such information / opinions / views. While due care has been taken to ensure that the disclosures and opinions given are
fair and reasonable, none of the directors, employees, affiliates or representatives of ARSSBL shall be liable for any direct, indirect, special, incidental,
consequential, punitive or exemplary damages, including lost profits arising in any way whatsoever from the information / opinions / views contained in this Report.
The price and value of the investments referred to in this Report and the income from them may go down as well as up, and investors may realize losses on any
investments. Past performance is not a guide for future performance. ARSSBL does not provide tax advice to its clients, and all investors are strongly advised to
consult with their tax advisers regarding taxation aspects of any potential investment.
Opinions expressed are our current opinions as of the date appearing on this Research only. We do not undertake to advise you as to any change of our views
expressed in this Report. Research Report may differ between ARSSBL’s RAs and/ or ARSSBL’s associate companies on account of differences in research
methodology, personal judgment and difference in time horizons for which recommendations are made. User should keep this risk in mind and not hold ARSSBL,
its employees and associates responsible for any losses, damages of any type whatsoever.
MindTree
20
1
2
3
8
4
5 6
7
9
10
11
12
13
14
15
16
17
18 19
-
100
200
300
400
500
600
700
800
900
Jan-14
Mar-14
May-14
Jul-14
Sep-14
Nov-14
Jan-15
Mar-15
May-15
Jul-15
Sep-15
Nov-15
Jan-16
Mar-16
May-16
Jul-16
Sep-16
Nov-16
Jan-17
Mar-17
May-17
Jul-17
ARSSBL and its associates or employees may; (a) from time to time, have long or short positions in, and buy or sell the investments in/ security of company (ies) mentioned
herein or (b) be engaged in any other transaction involving such investments/ securities of company (ies) discussed herein or act as advisor or lender / borrower to such
company (ies) these and other activities of ARSSBL and its associates or employees may not be construed as potential conflict of interest with respect to any
recommendation and related information and opinions. Without limiting any of the foregoing, in no event shall ARSSBL and its associates or employees or any third party
involved in, or related to computing or compiling the information have any liability for any damages of any kind.
Details of Associates of ARSSBL and Brief History of Disciplinary action by regulatory authorities & its associates are available on our website i.e. www.rathionline.com
Disclaimers in respect of jurisdiction: This report is not directed to, or intended for distribution to or use by, any person or entity who is a citizen or resident of or located in
any locality, state, country or other jurisdiction where such distribution, publication, availability or use would be contrary to law or regulation or which would subject ARSSBL to
any registration or licensing requirement within such jurisdiction(s). No action has been or will be taken by ARSSBL in any jurisdiction (other than India), where any action for
such purpose(s) is required. Accordingly, this Report shall not be possessed, circulated and/or distributed in any such country or jurisdiction unless such action is in
compliance with all applicable laws and regulations of such country or jurisdiction. ARSSBL requires such recipient to inform himself about and to observe any restrictions at
his own expense, without any liability to ARSSBL. Any dispute arising out of this Report shall be subject to the exclusive jurisdiction of the Courts in India.
Statements on ownership and material conflicts of interest, compensation - ARSSBL and Associates
Answers to the Best of the knowledge and belief of ARSSBL/ its Associates/ Research Analyst who is preparing this report
ARSSBL/its Associates/ Research Analyst/ his Relative have actual/beneficial ownership of one per cent or more securities of the subject company, at the end of
the month immediately preceding the date of publication of the research report?
No
ARSSBL/its Associates/ Research Analyst/ his Relative have actual/beneficial ownership of one per cent or more securities of the subject company No
ARSSBL/its Associates/ Research Analyst/ his Relative have any other material conflict of interest at the time of publication of the research report? No
ARSSBL/its Associates/ Research Analyst/ his Relative have received any compensation from the subject company in the past twelve months No
ARSSBL/its Associates/ Research Analyst/ his Relative have managed or co-managed public offering of securities for the subject company in the past twelve
months
No
ARSSBL/its Associates/ Research Analyst/ his Relative have received any compensation for investment banking or merchant banking or brokerage services from
the subject company in the past twelve months
No
ARSSBL/its Associates/ Research Analyst/ his Relative have received any compensation for products or services other than investment banking or merchant
banking or brokerage services from the subject company in the past twelve months
No
ARSSBL/its Associates/ Research Analyst/ his Relative have received any compensation or other benefits from the subject company or third party in connection
with the research report
No
ARSSBL/its Associates/ Research Analyst/ his Relative have served as an officer, director or employee of the subject company. No
Other Disclosures pertaining to distribution of research in the United States of America
This report was prepared, approved, published and distributed by the Anand Rathi Share and Stock Brokers Limited (ARSSBL) located outside of the United States (a “non-
US Group Company”). This report is distributed in the U.S. by Enclave Capital LLC, a U.S. registered broker dealer, on behalf of ARSSBL only to major U.S. institutional
investors (as defined in Rule 15a-6 under the U.S. Securities Exchange Act of 1934 (the “Exchange Act”)) pursuant to the exemption in Rule 15a-6 and any transaction
effected by a U.S. customer in the securities described in this report must be effected through Enclave Capital. ARSSBL accepts responsibility for its contents. Any US
customer wishing to effect transactions in any securities referred to herein or options thereon should do so only by contacting a representative of Enclave Capital LLC at 646-
454-8600
Neither the report nor any analyst who prepared or approved the report is subject to U.S. legal requirements or the Financial Industry Regulatory Authority, Inc. (“FINRA”) or
other regulatory requirements pertaining to research reports or research analysts. No non-US Group Company is registered as a broker-dealer under the Exchange Act or is a
member of the Financial Industry Regulatory Authority, Inc. or any other U.S. self-regulatory organization.
This material was produced by ARSSBL, solely for information purposes and for the use of the recipient. It is not to be reproduced under any circumstances and is not to be
copied or made available to any person other than the recipient. It is distributed in the United States of America by Enclave Capital LLC (19 West 44th Street, Suite 1700, New
York, NY 10036) and elsewhere in the world by ARSSBL or an authorized affiliate of ARSSBL (such entities and any other entity, directly or indirectly, controlled by ARSSBL,
the “Affiliates”). This document does not constitute an offer of, or an invitation by or on behalf of ARSSBL or its Affiliates or any other company to any person, to buy or sell
any security. The information contained herein has been obtained from published information and other sources, which ARSSBL or its Affiliates consider to be reliable. None
of ARSSBL or its Affiliates accepts any liability or responsibility whatsoever for the accuracy or completeness of any such information. All estimates, expressions of opinion
and other subjective judgments contained herein are made as of the date of this document. Emerging securities markets may be subject to risks significantly higher than more
established markets. In particular, the political and economic environment, company practices and market prices and volumes may be subject to significant variations. The
ability to assess such risks may also be limited due to significantly lower information quantity and quality. By accepting this document, you agree to be bound by all the
foregoing provisions.
1. ARSSBL or its Affiliates may or may not have been beneficial owners of the securities mentioned in this report.
2. ARSSBL or its affiliates may have or not managed or co-managed a public offering of the securities mentioned in the report in the past 12 months.
3. ARSSBL or its affiliates may have or not received compensation for investment banking services from the issuer of these securities in the past 12 months and do not expect
to receive compensation for investment banking services from the issuer of these securities within the next three months.
4. However, one or more of ARSSBL or its Affiliates may, from time to time, have a long or short position in any of the securities mentioned herein and may buy or sell those
securities or options thereon, either on their own account or on behalf of their clients.
5. As of the publication of this report, ARSSBL does not make a market in the subject securities.
6. ARSSBL or its Affiliates may or may not, to the extent permitted by law, act upon or use the above material or the conclusions stated above, or the research or analysis on
which they are based before the material is published to recipients and from time to time, provide investment banking, investment management or other services for or solicit
to seek to obtain investment banking, or other securities business from, any entity referred to in this report.
Enclave Capital LLC is distributing this document in the United States of America. ARSSBL accepts responsibility for its contents. Any US customer wishing to effect
transactions in any securities referred to herein or options thereon should do so only by contacting a representative of Enclave Capital LLC.
© 2016. This report is strictly confidential and is being furnished to you solely for your information. All material presented in this report, unless specifically indicated otherwise,
is under copyright to ARSSBL. None of the material, its content, or any copy of such material or content, may be altered in any way, transmitted, copied or reproduced (in
whole or in part) or redistributed in any form to any other party, without the prior express written permission of ARSSBL. All trademarks, service marks and logos used in this
report are trademarks or service marks or registered trademarks or service marks of ARSSBL or its affiliates, unless specifically mentioned otherwise.
Additional information on recommended securities/instruments is available on request.
ARSSBL registered address: 4th Floor, Silver Metropolis, Jaicoach Compound, Opposite Bimbisar Nagar, Goregaon (East), Mumbai - 400 063.
Tel No: +91 22 4001 3700 | Fax No: +91 22 4001 3770 | CIN: U67120MH1991PLC064106.

Contenu connexe

Tendances

Maruti suzuki ru2 qfy2011-291010
Maruti suzuki   ru2 qfy2011-291010Maruti suzuki   ru2 qfy2011-291010
Maruti suzuki ru2 qfy2011-291010Angel Broking
 
Motherson Sumi Systems - Result Update
Motherson Sumi Systems - Result UpdateMotherson Sumi Systems - Result Update
Motherson Sumi Systems - Result UpdateAngel Broking
 
20160502 olympus pres
20160502 olympus pres20160502 olympus pres
20160502 olympus presTravis Lundy
 
Entertainment Network Ltd: Stock Price & Q4 Results Of Entertainment Network ...
Entertainment Network Ltd: Stock Price & Q4 Results Of Entertainment Network ...Entertainment Network Ltd: Stock Price & Q4 Results Of Entertainment Network ...
Entertainment Network Ltd: Stock Price & Q4 Results Of Entertainment Network ...hdfcsecurities1
 
Second Quarter of Fiscal Year Ending March 2017 Briefing on Financial Results
Second Quarter of Fiscal Year Ending March 2017 Briefing on Financial ResultsSecond Quarter of Fiscal Year Ending March 2017 Briefing on Financial Results
Second Quarter of Fiscal Year Ending March 2017 Briefing on Financial ResultsRicohLease
 
Cipla Q2 disappoints, gearing up for strong H2FY15E
Cipla Q2 disappoints, gearing up for strong H2FY15ECipla Q2 disappoints, gearing up for strong H2FY15E
Cipla Q2 disappoints, gearing up for strong H2FY15EIndiaNotes.com
 
Fiscal Year Ended March 2016 Briefing on Financial Results
Fiscal Year Ended March 2016 Briefing on Financial ResultsFiscal Year Ended March 2016 Briefing on Financial Results
Fiscal Year Ended March 2016 Briefing on Financial ResultsRicohLease
 
Mahindra Financial result update: 4QFY15 PAT up 7% YoY and 144% QoQ
Mahindra Financial result update: 4QFY15 PAT up 7% YoY and 144% QoQMahindra Financial result update: 4QFY15 PAT up 7% YoY and 144% QoQ
Mahindra Financial result update: 4QFY15 PAT up 7% YoY and 144% QoQIndiaNotes.com
 
Bharat forge ru2 qfy2011-221010
Bharat forge ru2 qfy2011-221010Bharat forge ru2 qfy2011-221010
Bharat forge ru2 qfy2011-221010Angel Broking
 
Stock Tip: Buy this stock for a target of Rs270
Stock Tip: Buy this stock for a target of Rs270Stock Tip: Buy this stock for a target of Rs270
Stock Tip: Buy this stock for a target of Rs270IndiaNotes.com
 

Tendances (12)

Maruti suzuki ru2 qfy2011-291010
Maruti suzuki   ru2 qfy2011-291010Maruti suzuki   ru2 qfy2011-291010
Maruti suzuki ru2 qfy2011-291010
 
M&A Advisory Firms jmfl
M&A Advisory Firms   jmflM&A Advisory Firms   jmfl
M&A Advisory Firms jmfl
 
Motherson Sumi Systems - Result Update
Motherson Sumi Systems - Result UpdateMotherson Sumi Systems - Result Update
Motherson Sumi Systems - Result Update
 
20160502 olympus pres
20160502 olympus pres20160502 olympus pres
20160502 olympus pres
 
Entertainment Network Ltd: Stock Price & Q4 Results Of Entertainment Network ...
Entertainment Network Ltd: Stock Price & Q4 Results Of Entertainment Network ...Entertainment Network Ltd: Stock Price & Q4 Results Of Entertainment Network ...
Entertainment Network Ltd: Stock Price & Q4 Results Of Entertainment Network ...
 
Second Quarter of Fiscal Year Ending March 2017 Briefing on Financial Results
Second Quarter of Fiscal Year Ending March 2017 Briefing on Financial ResultsSecond Quarter of Fiscal Year Ending March 2017 Briefing on Financial Results
Second Quarter of Fiscal Year Ending March 2017 Briefing on Financial Results
 
Cipla Q2 disappoints, gearing up for strong H2FY15E
Cipla Q2 disappoints, gearing up for strong H2FY15ECipla Q2 disappoints, gearing up for strong H2FY15E
Cipla Q2 disappoints, gearing up for strong H2FY15E
 
Loan against shares
Loan against sharesLoan against shares
Loan against shares
 
Fiscal Year Ended March 2016 Briefing on Financial Results
Fiscal Year Ended March 2016 Briefing on Financial ResultsFiscal Year Ended March 2016 Briefing on Financial Results
Fiscal Year Ended March 2016 Briefing on Financial Results
 
Mahindra Financial result update: 4QFY15 PAT up 7% YoY and 144% QoQ
Mahindra Financial result update: 4QFY15 PAT up 7% YoY and 144% QoQMahindra Financial result update: 4QFY15 PAT up 7% YoY and 144% QoQ
Mahindra Financial result update: 4QFY15 PAT up 7% YoY and 144% QoQ
 
Bharat forge ru2 qfy2011-221010
Bharat forge ru2 qfy2011-221010Bharat forge ru2 qfy2011-221010
Bharat forge ru2 qfy2011-221010
 
Stock Tip: Buy this stock for a target of Rs270
Stock Tip: Buy this stock for a target of Rs270Stock Tip: Buy this stock for a target of Rs270
Stock Tip: Buy this stock for a target of Rs270
 

Similaire à Mindtree 1QFY18

Persistent 1QFY18
Persistent 1QFY18Persistent 1QFY18
Persistent 1QFY18Mohit Jn
 
Mastek 1QFY18
Mastek 1QFY18Mastek 1QFY18
Mastek 1QFY18Mohit Jn
 
Firstsource 1QFY18
Firstsource 1QFY18Firstsource 1QFY18
Firstsource 1QFY18Mohit Jn
 
FSOL 1QFY18
FSOL 1QFY18FSOL 1QFY18
FSOL 1QFY18Mohit Jn
 
Prabhudas lilladher techmahindra_29june_2015
Prabhudas lilladher techmahindra_29june_2015Prabhudas lilladher techmahindra_29june_2015
Prabhudas lilladher techmahindra_29june_2015IndiaNotes.com
 
Nirmal pi industries_03_aug15
Nirmal pi industries_03_aug15Nirmal pi industries_03_aug15
Nirmal pi industries_03_aug15IndiaNotes.com
 
Stock Market Report For Investors -Sai Proficient
Stock Market Report For Investors -Sai ProficientStock Market Report For Investors -Sai Proficient
Stock Market Report For Investors -Sai Proficientsai proficient research
 
Financial Ratio Analysis PowerPoint Presentation Slides
Financial Ratio Analysis PowerPoint Presentation SlidesFinancial Ratio Analysis PowerPoint Presentation Slides
Financial Ratio Analysis PowerPoint Presentation SlidesSlideTeam
 
Infomedia (IFM) - equity research initiation report
Infomedia (IFM) - equity research initiation reportInfomedia (IFM) - equity research initiation report
Infomedia (IFM) - equity research initiation reportGeorge Gabriel
 
Asset Reconstruction Company
Asset Reconstruction CompanyAsset Reconstruction Company
Asset Reconstruction Companypriteshsawant120
 
Asset Reconstruction Company
Asset Reconstruction CompanyAsset Reconstruction Company
Asset Reconstruction Companyajay suryawanshi
 
Asset Reconstruction Company In India
Asset Reconstruction Company In IndiaAsset Reconstruction Company In India
Asset Reconstruction Company In Indiarachanajagtap54
 
Asset Reconstruction Company
Asset Reconstruction CompanyAsset Reconstruction Company
Asset Reconstruction Companypriteshsawant120
 
Asset Reconstruction Company India
Asset Reconstruction Company IndiaAsset Reconstruction Company India
Asset Reconstruction Company Indiarohinikamble420
 
Merger And Acquisition Companies
Merger And Acquisition CompaniesMerger And Acquisition Companies
Merger And Acquisition Companiesrohinikamble420
 
EISEC - Grauer and weil (India) Ltd_Q2FY15
EISEC - Grauer and weil (India) Ltd_Q2FY15EISEC - Grauer and weil (India) Ltd_Q2FY15
EISEC - Grauer and weil (India) Ltd_Q2FY15Pushkaraj Jamsandekar
 
Financial Analysis Module PowerPoint Presentation Slides
Financial Analysis Module PowerPoint Presentation SlidesFinancial Analysis Module PowerPoint Presentation Slides
Financial Analysis Module PowerPoint Presentation SlidesSlideTeam
 

Similaire à Mindtree 1QFY18 (20)

Persistent 1QFY18
Persistent 1QFY18Persistent 1QFY18
Persistent 1QFY18
 
Mastek 1QFY18
Mastek 1QFY18Mastek 1QFY18
Mastek 1QFY18
 
Sonata IC
Sonata ICSonata IC
Sonata IC
 
Firstsource 1QFY18
Firstsource 1QFY18Firstsource 1QFY18
Firstsource 1QFY18
 
FSOL 1QFY18
FSOL 1QFY18FSOL 1QFY18
FSOL 1QFY18
 
Prabhudas lilladher techmahindra_29june_2015
Prabhudas lilladher techmahindra_29june_2015Prabhudas lilladher techmahindra_29june_2015
Prabhudas lilladher techmahindra_29june_2015
 
Nirmal pi industries_03_aug15
Nirmal pi industries_03_aug15Nirmal pi industries_03_aug15
Nirmal pi industries_03_aug15
 
Stock Market Report For Investors -Sai Proficient
Stock Market Report For Investors -Sai ProficientStock Market Report For Investors -Sai Proficient
Stock Market Report For Investors -Sai Proficient
 
Financial Ratio Analysis PowerPoint Presentation Slides
Financial Ratio Analysis PowerPoint Presentation SlidesFinancial Ratio Analysis PowerPoint Presentation Slides
Financial Ratio Analysis PowerPoint Presentation Slides
 
Infomedia (IFM) - equity research initiation report
Infomedia (IFM) - equity research initiation reportInfomedia (IFM) - equity research initiation report
Infomedia (IFM) - equity research initiation report
 
Bata india
Bata indiaBata india
Bata india
 
Asset Reconstruction Company
Asset Reconstruction CompanyAsset Reconstruction Company
Asset Reconstruction Company
 
Asset Reconstruction Company
Asset Reconstruction CompanyAsset Reconstruction Company
Asset Reconstruction Company
 
Asset Reconstruction Company In India
Asset Reconstruction Company In IndiaAsset Reconstruction Company In India
Asset Reconstruction Company In India
 
Asset Reconstruction Company
Asset Reconstruction CompanyAsset Reconstruction Company
Asset Reconstruction Company
 
Asset Reconstruction Company India
Asset Reconstruction Company IndiaAsset Reconstruction Company India
Asset Reconstruction Company India
 
Merger And Acquisition Companies
Merger And Acquisition CompaniesMerger And Acquisition Companies
Merger And Acquisition Companies
 
EISEC - Grauer and weil (India) Ltd_Q2FY15
EISEC - Grauer and weil (India) Ltd_Q2FY15EISEC - Grauer and weil (India) Ltd_Q2FY15
EISEC - Grauer and weil (India) Ltd_Q2FY15
 
2Q17
2Q172Q17
2Q17
 
Financial Analysis Module PowerPoint Presentation Slides
Financial Analysis Module PowerPoint Presentation SlidesFinancial Analysis Module PowerPoint Presentation Slides
Financial Analysis Module PowerPoint Presentation Slides
 

Dernier

Call Girls in Sarai Kale Khan Delhi 💯 Call Us 🔝9205541914 🔝( Delhi) Escorts S...
Call Girls in Sarai Kale Khan Delhi 💯 Call Us 🔝9205541914 🔝( Delhi) Escorts S...Call Girls in Sarai Kale Khan Delhi 💯 Call Us 🔝9205541914 🔝( Delhi) Escorts S...
Call Girls in Sarai Kale Khan Delhi 💯 Call Us 🔝9205541914 🔝( Delhi) Escorts S...Delhi Call girls
 
Halmar dropshipping via API with DroFx
Halmar  dropshipping  via API with DroFxHalmar  dropshipping  via API with DroFx
Halmar dropshipping via API with DroFxolyaivanovalion
 
Mature dropshipping via API with DroFx.pptx
Mature dropshipping via API with DroFx.pptxMature dropshipping via API with DroFx.pptx
Mature dropshipping via API with DroFx.pptxolyaivanovalion
 
Delhi Call Girls CP 9711199171 ☎✔👌✔ Whatsapp Hard And Sexy Vip Call
Delhi Call Girls CP 9711199171 ☎✔👌✔ Whatsapp Hard And Sexy Vip CallDelhi Call Girls CP 9711199171 ☎✔👌✔ Whatsapp Hard And Sexy Vip Call
Delhi Call Girls CP 9711199171 ☎✔👌✔ Whatsapp Hard And Sexy Vip Callshivangimorya083
 
Introduction-to-Machine-Learning (1).pptx
Introduction-to-Machine-Learning (1).pptxIntroduction-to-Machine-Learning (1).pptx
Introduction-to-Machine-Learning (1).pptxfirstjob4
 
BPAC WITH UFSBI GENERAL PRESENTATION 18_05_2017-1.pptx
BPAC WITH UFSBI GENERAL PRESENTATION 18_05_2017-1.pptxBPAC WITH UFSBI GENERAL PRESENTATION 18_05_2017-1.pptx
BPAC WITH UFSBI GENERAL PRESENTATION 18_05_2017-1.pptxMohammedJunaid861692
 
Call Girls Indiranagar Just Call 👗 7737669865 👗 Top Class Call Girl Service B...
Call Girls Indiranagar Just Call 👗 7737669865 👗 Top Class Call Girl Service B...Call Girls Indiranagar Just Call 👗 7737669865 👗 Top Class Call Girl Service B...
Call Girls Indiranagar Just Call 👗 7737669865 👗 Top Class Call Girl Service B...amitlee9823
 
BigBuy dropshipping via API with DroFx.pptx
BigBuy dropshipping via API with DroFx.pptxBigBuy dropshipping via API with DroFx.pptx
BigBuy dropshipping via API with DroFx.pptxolyaivanovalion
 
Invezz.com - Grow your wealth with trading signals
Invezz.com - Grow your wealth with trading signalsInvezz.com - Grow your wealth with trading signals
Invezz.com - Grow your wealth with trading signalsInvezz1
 
100-Concepts-of-AI by Anupama Kate .pptx
100-Concepts-of-AI by Anupama Kate .pptx100-Concepts-of-AI by Anupama Kate .pptx
100-Concepts-of-AI by Anupama Kate .pptxAnupama Kate
 
Call Girls Hsr Layout Just Call 👗 7737669865 👗 Top Class Call Girl Service Ba...
Call Girls Hsr Layout Just Call 👗 7737669865 👗 Top Class Call Girl Service Ba...Call Girls Hsr Layout Just Call 👗 7737669865 👗 Top Class Call Girl Service Ba...
Call Girls Hsr Layout Just Call 👗 7737669865 👗 Top Class Call Girl Service Ba...amitlee9823
 
Delhi Call Girls Punjabi Bagh 9711199171 ☎✔👌✔ Whatsapp Hard And Sexy Vip Call
Delhi Call Girls Punjabi Bagh 9711199171 ☎✔👌✔ Whatsapp Hard And Sexy Vip CallDelhi Call Girls Punjabi Bagh 9711199171 ☎✔👌✔ Whatsapp Hard And Sexy Vip Call
Delhi Call Girls Punjabi Bagh 9711199171 ☎✔👌✔ Whatsapp Hard And Sexy Vip Callshivangimorya083
 
Edukaciniai dropshipping via API with DroFx
Edukaciniai dropshipping via API with DroFxEdukaciniai dropshipping via API with DroFx
Edukaciniai dropshipping via API with DroFxolyaivanovalion
 
FESE Capital Markets Fact Sheet 2024 Q1.pdf
FESE Capital Markets Fact Sheet 2024 Q1.pdfFESE Capital Markets Fact Sheet 2024 Q1.pdf
FESE Capital Markets Fact Sheet 2024 Q1.pdfMarinCaroMartnezBerg
 
BabyOno dropshipping via API with DroFx.pptx
BabyOno dropshipping via API with DroFx.pptxBabyOno dropshipping via API with DroFx.pptx
BabyOno dropshipping via API with DroFx.pptxolyaivanovalion
 
BDSM⚡Call Girls in Mandawali Delhi >༒8448380779 Escort Service
BDSM⚡Call Girls in Mandawali Delhi >༒8448380779 Escort ServiceBDSM⚡Call Girls in Mandawali Delhi >༒8448380779 Escort Service
BDSM⚡Call Girls in Mandawali Delhi >༒8448380779 Escort ServiceDelhi Call girls
 
Market Analysis in the 5 Largest Economic Countries in Southeast Asia.pdf
Market Analysis in the 5 Largest Economic Countries in Southeast Asia.pdfMarket Analysis in the 5 Largest Economic Countries in Southeast Asia.pdf
Market Analysis in the 5 Largest Economic Countries in Southeast Asia.pdfRachmat Ramadhan H
 
VidaXL dropshipping via API with DroFx.pptx
VidaXL dropshipping via API with DroFx.pptxVidaXL dropshipping via API with DroFx.pptx
VidaXL dropshipping via API with DroFx.pptxolyaivanovalion
 
Cheap Rate Call girls Sarita Vihar Delhi 9205541914 shot 1500 night
Cheap Rate Call girls Sarita Vihar Delhi 9205541914 shot 1500 nightCheap Rate Call girls Sarita Vihar Delhi 9205541914 shot 1500 night
Cheap Rate Call girls Sarita Vihar Delhi 9205541914 shot 1500 nightDelhi Call girls
 
Determinants of health, dimensions of health, positive health and spectrum of...
Determinants of health, dimensions of health, positive health and spectrum of...Determinants of health, dimensions of health, positive health and spectrum of...
Determinants of health, dimensions of health, positive health and spectrum of...shambhavirathore45
 

Dernier (20)

Call Girls in Sarai Kale Khan Delhi 💯 Call Us 🔝9205541914 🔝( Delhi) Escorts S...
Call Girls in Sarai Kale Khan Delhi 💯 Call Us 🔝9205541914 🔝( Delhi) Escorts S...Call Girls in Sarai Kale Khan Delhi 💯 Call Us 🔝9205541914 🔝( Delhi) Escorts S...
Call Girls in Sarai Kale Khan Delhi 💯 Call Us 🔝9205541914 🔝( Delhi) Escorts S...
 
Halmar dropshipping via API with DroFx
Halmar  dropshipping  via API with DroFxHalmar  dropshipping  via API with DroFx
Halmar dropshipping via API with DroFx
 
Mature dropshipping via API with DroFx.pptx
Mature dropshipping via API with DroFx.pptxMature dropshipping via API with DroFx.pptx
Mature dropshipping via API with DroFx.pptx
 
Delhi Call Girls CP 9711199171 ☎✔👌✔ Whatsapp Hard And Sexy Vip Call
Delhi Call Girls CP 9711199171 ☎✔👌✔ Whatsapp Hard And Sexy Vip CallDelhi Call Girls CP 9711199171 ☎✔👌✔ Whatsapp Hard And Sexy Vip Call
Delhi Call Girls CP 9711199171 ☎✔👌✔ Whatsapp Hard And Sexy Vip Call
 
Introduction-to-Machine-Learning (1).pptx
Introduction-to-Machine-Learning (1).pptxIntroduction-to-Machine-Learning (1).pptx
Introduction-to-Machine-Learning (1).pptx
 
BPAC WITH UFSBI GENERAL PRESENTATION 18_05_2017-1.pptx
BPAC WITH UFSBI GENERAL PRESENTATION 18_05_2017-1.pptxBPAC WITH UFSBI GENERAL PRESENTATION 18_05_2017-1.pptx
BPAC WITH UFSBI GENERAL PRESENTATION 18_05_2017-1.pptx
 
Call Girls Indiranagar Just Call 👗 7737669865 👗 Top Class Call Girl Service B...
Call Girls Indiranagar Just Call 👗 7737669865 👗 Top Class Call Girl Service B...Call Girls Indiranagar Just Call 👗 7737669865 👗 Top Class Call Girl Service B...
Call Girls Indiranagar Just Call 👗 7737669865 👗 Top Class Call Girl Service B...
 
BigBuy dropshipping via API with DroFx.pptx
BigBuy dropshipping via API with DroFx.pptxBigBuy dropshipping via API with DroFx.pptx
BigBuy dropshipping via API with DroFx.pptx
 
Invezz.com - Grow your wealth with trading signals
Invezz.com - Grow your wealth with trading signalsInvezz.com - Grow your wealth with trading signals
Invezz.com - Grow your wealth with trading signals
 
100-Concepts-of-AI by Anupama Kate .pptx
100-Concepts-of-AI by Anupama Kate .pptx100-Concepts-of-AI by Anupama Kate .pptx
100-Concepts-of-AI by Anupama Kate .pptx
 
Call Girls Hsr Layout Just Call 👗 7737669865 👗 Top Class Call Girl Service Ba...
Call Girls Hsr Layout Just Call 👗 7737669865 👗 Top Class Call Girl Service Ba...Call Girls Hsr Layout Just Call 👗 7737669865 👗 Top Class Call Girl Service Ba...
Call Girls Hsr Layout Just Call 👗 7737669865 👗 Top Class Call Girl Service Ba...
 
Delhi Call Girls Punjabi Bagh 9711199171 ☎✔👌✔ Whatsapp Hard And Sexy Vip Call
Delhi Call Girls Punjabi Bagh 9711199171 ☎✔👌✔ Whatsapp Hard And Sexy Vip CallDelhi Call Girls Punjabi Bagh 9711199171 ☎✔👌✔ Whatsapp Hard And Sexy Vip Call
Delhi Call Girls Punjabi Bagh 9711199171 ☎✔👌✔ Whatsapp Hard And Sexy Vip Call
 
Edukaciniai dropshipping via API with DroFx
Edukaciniai dropshipping via API with DroFxEdukaciniai dropshipping via API with DroFx
Edukaciniai dropshipping via API with DroFx
 
FESE Capital Markets Fact Sheet 2024 Q1.pdf
FESE Capital Markets Fact Sheet 2024 Q1.pdfFESE Capital Markets Fact Sheet 2024 Q1.pdf
FESE Capital Markets Fact Sheet 2024 Q1.pdf
 
BabyOno dropshipping via API with DroFx.pptx
BabyOno dropshipping via API with DroFx.pptxBabyOno dropshipping via API with DroFx.pptx
BabyOno dropshipping via API with DroFx.pptx
 
BDSM⚡Call Girls in Mandawali Delhi >༒8448380779 Escort Service
BDSM⚡Call Girls in Mandawali Delhi >༒8448380779 Escort ServiceBDSM⚡Call Girls in Mandawali Delhi >༒8448380779 Escort Service
BDSM⚡Call Girls in Mandawali Delhi >༒8448380779 Escort Service
 
Market Analysis in the 5 Largest Economic Countries in Southeast Asia.pdf
Market Analysis in the 5 Largest Economic Countries in Southeast Asia.pdfMarket Analysis in the 5 Largest Economic Countries in Southeast Asia.pdf
Market Analysis in the 5 Largest Economic Countries in Southeast Asia.pdf
 
VidaXL dropshipping via API with DroFx.pptx
VidaXL dropshipping via API with DroFx.pptxVidaXL dropshipping via API with DroFx.pptx
VidaXL dropshipping via API with DroFx.pptx
 
Cheap Rate Call girls Sarita Vihar Delhi 9205541914 shot 1500 night
Cheap Rate Call girls Sarita Vihar Delhi 9205541914 shot 1500 nightCheap Rate Call girls Sarita Vihar Delhi 9205541914 shot 1500 night
Cheap Rate Call girls Sarita Vihar Delhi 9205541914 shot 1500 night
 
Determinants of health, dimensions of health, positive health and spectrum of...
Determinants of health, dimensions of health, positive health and spectrum of...Determinants of health, dimensions of health, positive health and spectrum of...
Determinants of health, dimensions of health, positive health and spectrum of...
 

Mindtree 1QFY18

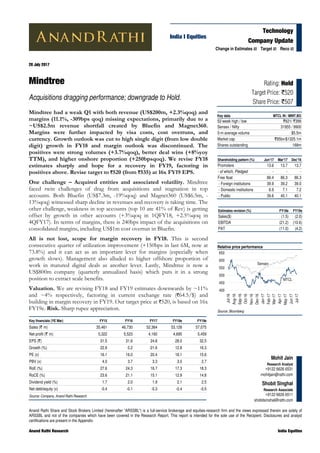
  • 1. Anand Rathi Share and Stock Brokers Limited (hereinafter “ARSSBL”) is a full-service brokerage and equities-research firm and the views expressed therein are solely of ARSSBL and not of the companies which have been covered in the Research Report. This report is intended for the sole use of the Recipient. Disclosures and analyst certifications are present in the Appendix. Anand Rathi Research India Equities Technology Company Update India I Equities Key financials (YE Mar) FY15 FY16 FY17 FY18e FY19e Sales (` m) 35,461 46,730 52,364 53,128 57,075 Net profit (` m) 5,322 5,523 4,160 4,695 5,459 EPS (`) 31.5 31.6 24.8 28.0 32.5 Growth (%) 22.6 0.2 -21.6 12.8 16.3 PE (x) 16.1 16.0 20.4 18.1 15.6 PBV (x) 4.0 3.7 3.3 3.0 2.7 RoE (%) 27.6 24.3 16.7 17.3 18.3 RoCE (%) 23.6 21.1 15.1 12.9 14.8 Dividend yield (%) 1.7 2.0 1.9 2.1 2.5 Net debt/equity (x) -0.4 -0.1 -0.3 -0.4 -0.5 Source: Company, Anand Rathi Research Mohit Jain Research Analyst +9122 6626 6531 mohitjain@rathi.com Shobit Singhal Research Associate +9122 6626 6511 shobitsinghal@rathi.com ` Rating: Hold Target Price: `520 Share Price: `507 Key data MTCL IN / MINT.BO 52-week high / low `621/ `399 Sensex / Nifty 31955 / 9900 3-m average volume $5.5m Market cap `85bn/$1325.1m Shares outstanding 168m Shareholding pattern (%) Jun'17 Mar'17 Dec'16 Promoters 13.6 13.7 13.7 - of which, Pledged - - - Free float 86.4 86.3 86.3 - Foreign institutions 39.9 39.2 39.0 - Domestic institutions 6.9 7.1 7.2 - Public 39.6 40.1 40.1 20 July 2017 Mindtree Acquisitions dragging performance; downgrade to Hold. Mindtree had a weak Q1 with both revenue (US$200m, +2.3%qoq) and margins (11.1%, -309bps qoq) missing expectations, primarily due to a ~US$2.5m revenue shortfall created by Bluefin and Magnet360. Margins were further impacted by visa costs, cost overruns, and currency. Growth outlook was cut to high single digit (from low double digit) growth in FY18 and margin outlook was discontinued. The positives were strong volumes (+3.7%qoq), better deal wins (+8%yoy TTM), and higher onshore proportion (+250bpsqoq). We revise FY18 estimates sharply and hope for a recovery in FY19, factoring in positives above. Revise target to `520 (from `535) at 16x FY19 EPS. One challenge – Acquired entities and associated volatility. Mindtree faced twin challenges of drag from acquisitions and stagnation in top accounts. Both Bluefin (US$7.3m, -19%qoq) and Magnet360 (US$6.5m, - 13%qoq) witnessed sharp decline in revenues and recovery is taking time. The other challenge, weakness in top accounts (top 10 are 41% of Rev) is getting offset by growth in other accounts (+3%qoq in 1QFY18, +2.5%qoq in 4QFY17). In terms of margins, there is 240bps impact of the acquisitions on consolidated margins, including US$1m cost overrun in Bluefin. All is not lost, scope for margin recovery in FY18. This is second consecutive quarter of utilization improvement (+150bps in last 6M, now at 73.8%) and it can act as an important lever for margins (especially when growth slows). Management also alluded to higher offshore proportion of work in matured digital deals as another lever. Lastly, Mindtree is now a US$800m company (quarterly annualized basis) which puts it in a strong position to extract scale benefits. Valuation. We are revising FY18 and FY19 estimates downwards by ~11% and ~4% respectively, factoring in current exchange rate (`64.5/$) and building in margin recovery in FY19. Our target price at `520, is based on 16x FY19e. Risk. Sharp rupee appreciation. Relative price performance Source: Bloomberg MTCL Sensex 400 450 500 550 600 650 Jul-16 Aug-16 Sep-16 Oct-16 Nov-16 Dec-16 Jan-17 Feb-17 Mar-17 Apr-17 May-17 Jun-17 Jul-17 Estimates revision (%) FY18e FY19e Sales($) (1.5) (2.0) EBITDA (21.2) (10.6) PAT (11.0) (4.2) Change in Estimates Target Reco 
  • 2. 20 July 2017 Mindtree – Acquisitions dragging performance; downgrade to Hold. Anand Rathi Research 2 Quick Glance – Financials and Valuations Fig 1 – Income statement (`m) Year-end: Mar FY15 FY16 FY17 FY18e FY19e Net revenues 35,461 46,730 52,364 53,128 57,075 Revenue growth (%) 17.4 31.8 12.1 1.5 7.4 - Oper. expenses 28,455 38,520 45,183 46,473 48,873 EBIDTA 7,006 8,210 7,181 6,655 8,201 EBITDA margins (%) 19.8 17.6 13.7 12.5 14.4 - Interest 2 161 191 101 42 - Depreciation 1,016 1,648 1,848 1,827 1,998 + Other income 876 813 407 1,491 1,174 - Tax 1,542 1,691 1,389 1,523 1,876 Effective tax rate (%) 22.5 23.4 25.0 24.5 25.6 + Associates/(minorities) - - - - - Adjusted PAT 5,322 5,523 4,160 4,695 5,459 + Extraordinary items - - - - - Reported PAT 5,322 5,523 4,160 4,695 5,459 Adj. FDEPS (`/sh) 31.5 31.6 24.8 28.0 32.5 Adj. FDEPS growth (%) 22.6 0.2 -21.6 12.8 16.3 Source: Company, AnandRathi Research Fig 3 – Cash-flow statement (`m) Year-end: Mar FY15 FY16 FY17 FY18e FY19e Adjusted PAT 5,322 5,523 4,160 4,695 5,459 + Non-cash items 1,016 1,648 1,848 1,827 1,998 Cash profit 6,338 7,171 6,008 6,522 7,456 - Incr./(decr.) in WC -213 1,689 -1,031 -1,000 62 Operating cash-flow 6,551 5,482 7,039 7,521 7,395 - Capex 3,012 7,771 420 1,149 1,235 Free cash-flow 3,539 -2,289 6,619 6,372 6,160 - Dividend 1,715 2,087 1,928 2,113 2,456 + Equity raised 378 -537 -636 - - + Debt raised 91 712 -25 - - - Investments -285 -2,770 3,854 2,938 4,406 - Misc. items - - - - - Net cash-flow 2,578 -1,431 176 1,322 -702 + Op. cash & bank bal. 1,185 3,763 2,332 2,508 3,830 Cl. Cash & bank bal. 3,763 2,332 2,508 3,830 3,128 Source: Company, AnandRathi Research Fig 5 – Price movement Source: Bloomberg Fig 2 – Balance sheet (`m) Year-end: Mar FY15 FY16 FY17 FY18e FY19e Share capital 837 1,678 1,680 1,680 1,680 Reserves & surplus 20,443 22,501 24,095 26,677 29,679 Net worth 21,280 24,179 25,775 28,357 31,359 Total debt 178 829 996 996 996 Minority interest - - - - - Def. tax liab. (net) -493 -432 -624 -624 -624 Capital employed 20,965 24,576 26,147 28,729 31,731 Net fixed assets 4,665 4,383 3,991 3,313 2,550 Intangible assets 1,042 7,447 6,411 6,411 6,411 Investments 4,808 2,038 5,892 8,829 13,235 - of which, Liquid 4,790 2,016 5,869 8,804 13,205 Working capital 6,687 8,376 7,345 6,346 6,407 Cash 3,763 2,332 2,508 3,830 3,128 Capital deployed 20,965 24,576 26,147 28,729 31,731 Working capital (days) 69 65 51 44 41 Book value (`/sh) 126.1 138.4 153.5 168.9 186.8 Source: Company, AnandRathi Research Fig 4 – Ratio analysis@ `507 Year-end: Mar FY15 FY16 FY17 FY18e FY19e P/E (x) 16.1 16.0 20.4 18.1 15.6 Cash P/E (x) 13.5 12.3 14.2 13.0 11.4 EV/EBITDA (x) 10.9 9.9 10.8 11.0 8.5 EV/sales (x) 2.2 1.7 1.5 1.4 1.2 P/B (x) 4.0 3.7 3.3 3.0 2.7 RoE (%) 27.6 24.3 16.7 17.3 18.3 RoCE (%) 23.6 21.1 15.1 12.9 14.8 Dividend yield (%) 1.7 2.0 1.9 2.1 2.5 Dividend payout (%) 32.2 37.8 46.4 45.0 45.0 Net debt/equity (x) -0.4 -0.1 -0.3 -0.4 -0.5 Debtor (days) 82 93 76 74 74 Inventory (days) - - - - - Payables (days) 18 15 12 12 12 CFO:PAT% 110.7 76.0 157.1 132.0 114.7 CFO:Sales% 16.6 9.0 12.5 11.7 11.0 Source: Company, AnandRathi Research Fig 6 – EBIT margin Source: Company 100 200 300 400 500 600 700 800 Jul-12 Nov-12 Mar-13 Jul-13 Nov-13 Mar-14 Jul-14 Nov-14 Mar-15 Jul-15 Nov-15 Mar-16 Jul-16 Nov-16 Mar-17 Jul-17 (`) MTCL 0.0 2.0 4.0 6.0 8.0 10.0 12.0 1QFY17 2QFY17 3QFY17 4QFY17 1QFY18 (%)
  • 3. 20 July 2017 Mindtree – Acquisitions dragging performance; downgrade to Hold. Anand Rathi Research 3 Result Highlights Q1FY18 Results at a Glance Fig 8 – Quarterly result Year-end: Mar Q1FY18 % qoq % yoy FY17 FY16 % yoy Sales ($ m) 200 2.3 0.6 780 715 9.0 Sales (`m) 12,895 (2.2) (2.9) 52,364 46,730 12.1 EBITDA (`m) 1,429 (23.5) (26.9) 7,181 8,210 (12.5) EBITDA margin (%) 11.1 -309 bps -364 bps 13.7 17.6 -386 bps EBIT (`m) 979 (30.2) (34.2) 5,333 6,562 (18.7) EBIT margin (%) 7.6 -304 bps -361 bps 10.2 14.0 -386 bps PBT (`m) 1,590 26.3 (2.5) 5,549 7,214 (23.1) Tax (`m) (373) 30.4 (11.6) (1,389) (1,691) (17.9) Tax rate (%) (23.5) -74 bps 243 bps (25.0) (23.4) -159 bps Net Income (`m) 1,217 25.1 0.7 4,160 5,523 (24.7) Source: Company Fig 7 – Segment-wise results Q1FY17 Q2FY17 Q3FY17 Q4FY17 Q1 FY 18 QoQ YoY% Revenues ($m) 199 193 192 196 200 2.3% 1% Growth YoY % 28% 7% 4% 0% 1% 55bps -2792bps Volume growth % 2.4% -1.8% -3.0% 2.2% 3.7% 151bps 129bps Revenues (Rsm) 13,276 12,954 12,953 13,181 12,895 -2% -3% Eff. exchange rate 66.7 67.1 67.4 67.4 64.4 -4% -3% Employees (EoP) 16,110 16,219 16,099 16,470 16,561 Revenue Productivity ($ ‘000/employee) 12.4 11.9 11.9 11.9 12.1 2% -2.2% Gross Utilization (IT services) 72.0% 73.1% 72.3% 72.7% 73.8% 110bps 180bps Attrition 16.5% 16.4% 16.1% 15.1% 14.0% -110bps -250bps CoR (excluding D&A) (8,660) (8,659) (8,516) (8,817) (8,937) 1% 3% As % of Revenues -65% -67% -66% -67% -69% -241bps -408bps SG&A (2,661) (2,677) (2,697) (2,496) (2,529) 1% -5% As % of Revenues -20% -21% -21% -19% -20% -68bps 43bps EBITDA 1,955 1,618 1,740 1,868 1,429 -24% -27% EBITDA margins % 15% 12% 13% 14% 11% -309bps -364bps EBIT 1,487 1,161 1,283 1,402 979 -30% -34% EBIT margins % 11% 9% 10% 11% 8% -304bps -361bps Other Income 106 195 110 132 632 379% 496% Forex gain/loss 88 (28) 32 (228) 19 -108% -78% PBT 1,630 1,281 1,379 1,259 1,590 26.3% -2% PBT margins % 12% 10% 11% 10% 12% 278bps 5bps Taxes (422) (332) (349) (286) (373) -30.4% -12% ETR % -26% -26% -25% -23% -23% -74bps 243bps PAT 1,208 949 1,030 973 1,217 25.1% 1% PAT Margin % 9% 7% 8% 7% 9% 206bps 34bps Source: Company, Anand Rathi Research
  • 4. 20 July 2017 Mindtree – Acquisitions dragging performance; downgrade to Hold. Anand Rathi Research 4 Conference call highlights Business  Revenue growth was impacted owing to volatility among few clients, slower ramp up of the deals, and ramp-down of few projects in Bluefin and Magnet 360.  EBITDA margins impacted due to visa cost (-150 bps), currency headwinds (-90 bps) and losses in Bluefin and Magnet 360 (-70bps).  Bluefin quarterly revenue run rate stood at USD 7.3m, while Magnet 360 revenue run rate stood at USD 6.5m. Both the entitiesare expected to face volatility in revenues. Within the two, Magnet360 is expected to recover faster as it is only facing delays in project closures. Bluefin is facing execution challenges – including cost overruns in fixed rice project.  Ex subsidiaries and currency movements, Mindtree expects to improve its EBITDA margins in FY18.  Out of 2 large deals won in Q3 FY 17 one customer is progressing as per plan and has started contributing to revenues in this quarter. But the other customer is a quarter behind schedule due to evolving regulatory environment in the US.  70% of employees will receive salary hike in Q2.Average salary hike in offshore would be 5.5%, while onshore it would be 1.8%. This will be absorbed in 2Q as visa expenses will not be there.  There is a churn in top accounts and hence, top 2-10 accounts look stagnant. However, with new clients coming in the top 10 category, company believes that growth will return in top accounts in FY18.  The Company entered into a payment resolution agreement with the erstwhile shareholders of one of the subsidiaries. Consequently, `374m representing liability no longer required and written back has been recognised under other income.   Business Outlook  Company has revised revenue growth guidance for FY18 to high single digit from low double digit and expects organic business to perform well.  Margin guidance was discontinued for the consolidated entity due to extreme volatility in the two subsidiaries. (7% of Revenues)
  • 5. 20 July 2017 Mindtree – Acquisitions dragging performance; downgrade to Hold. Anand Rathi Research 5 Factsheet Fig 9 – Revenue-split, by industry (%) Q1FY17 Q2FY17 Q3FY17 Q4FY17 Q1FY18 BFSI 24.9 24.7 24.1 24.7 25.1 Manufacturing - Includes Retail and CPG 24.1 24.2 24.1 23.0 22.7 Hi-Tech/PES 36.1 36.7 36.7 37.5 37.9 Travel and Hospitability 15.0 14.4 15.1 14.9 14.3 Others 0.0 0.0 0.0 0.0 0.0 Source: Company Fig 10 – Revenue-split, by services (%) Q1FY17 Q2FY17 Q3FY17 Q4FY17 Q1FY18 ADM 40 39.8 39.9 39.7 41.6 Enterprise Solutions 18 16.9 16.3 16.6 14.9 Assurance Solutions / Testing 12.8 12.4 12.6 12.5 11.8 Engineering & Industrial Services 9.8 9.8 9.5 9.5 9.6 IMS 18.4 19.9 20.3 20.4 21 Asset Leveraged Solutions 1 1.2 1.4 1.3 1.1 Source: Company Fig 11 – Revenue-split, by region (%) Q1FY17 Q2FY17 Q3FY17 Q4FY17 Q1FY18 North America 66.7 67.6 68.7 69.8 69.6 Continental Europe 23.1 21.4 20.8 20.8 21.1 India 3.1 3.5 3.1 2.8 3 APAC 7.1 7.5 7.4 6.6 6.3 Source: Company Fig 12 – Operational Performance (%) Q2FY17 Q3FY17 Q4FY17 Q1FY18 Top-five verticals growth (yoy) BFSI 3 (3) 1 1 Manufacturing (1) (0) (3) (5) Travel and Hospitability 9 (0) (9) (4) Hi-Tech 15 15 6 6 Top-five horizontals growth (yoy) ADM (4) (4) (3) 5 Enterprise Solutions 12 10 (6) (17) Assurance Solutions / Testing 4 3 (1) (7) Engineering & Industrial Services 22 19 (3) (1) IMS 25 17 17 15 Key geographical growth (yoy) North America 14 13 6 5 Europe (14) (18) (15) (8) Source: Company
  • 6. 20 July 2017 Mindtree – Acquisitions dragging performance; downgrade to Hold. Anand Rathi Research 6 Fig 13 – Operational Performance Q1FY17 Q2FY17 Q3FY17 Q4FY17 Q1FY18 Client profiling $1m+ 98 107 106 111 113 $5m+ 31 30 30 30 33 $10m+ 16 16 17 16 16 $20m+ 5 6 4 4 3 $50m+ 2 2 1 1 1 Client Addition (LTM) $1m+ 10 15 13 10 15 $5m+ 3 1 1 (1) 2 $10m+ 3 3 4 1 - $20m+ (1) - (1) (2) (2) $50m+ - - (1) (1) (1) Source: Company Fig 14 – Employee movement Q1FY17 Q2FY17 Q3FY17 Q4FY17 Q1FY18 Employees (EoP) 16,110 16,219 16,099 16,470 16,561 Gross Addition 210 744 470 914 645 Attrition 675 663 650 615 578 Net Addition -513 109 -120 371 91 Attrition % - LTM 17% 16% 16% 15% 14% Utilization % (cum trainees) 71% 71% 71% 71% 73% Utilization % (ex trainees) 72% 73% 72% 73% 74% Source: Company
  • 7. 20 July 2017 Mindtree – Acquisitions dragging performance; downgrade to Hold. Anand Rathi Research 7 Valuations The stock trades at 15.6x FY19e EPS of`32.4. This, we think, is fair, given that Mindtree is one of the better mid-sized IT companies with the potential to touch $1bn by 2020. Also, it enjoys a strong balance sheet and has strong free-cash-flow generation. It is currently exhibiting volatility on account of weaknesses in its top clients but the deal wins in the last six months suggest its ability to compete in a tough environment and return to industry-level growth. Also, it has margin levers in the business, primarily the employee-pyramid correction and utilisation to absorb headwinds in margins. At present, acquisitions are dragging down the performance but are expected to recover in FY18. Fig 15 – Change in estimates FY18 FY19 New Old Chg % New Old Chg % Revenues ($m) 824 837 (1.5) 885 903 (2.0) Revenues (`m) 53,128 56,052 (5.2) 57,075 60,510 (5.7) EBITDA (`m) 6,655 8,441 (21.2) 8,201 9,172 (10.6) EBITDA Margin % 12.5% 15.1% -253 bps 14.4% 15.2% -79 bps EBIT (`m) 4,828 6,530 (26.1) 6,204 7,082 (12.4) EBIT Margin % 9.1% 11.7% -256 bps 10.9% 11.7% -83 bps PBT 6,217 7,090 (12.3) 7,335 7,744 (5.3) Net profit 4,695 5,273 (11.0) 5,459 5,698 (4.2) Source: Anand Rathi Research We expect Mindtree to recoup in FY18 some of the margin erosion it suffered in 1QFY18, leading to FY18 margins trending toward 12.5%. We value it based on a target PE of 16x FY19e EPS, similar to other companies in Indian IT, which we like due to their quality management, business and corporate governance (Persistent, Cyient). Fig 16 – PE band Source: Bloomberg, Anand Rathi Research Risks  Sharp rupee appreciation. 0.0 5.0 10.0 15.0 20.0 25.0 30.0 Apr-13 Jul-13 Oct-13 Jan-14 Apr-14 Jul-14 Oct-14 Jan-15 Apr-15 Jul-15 Oct-15 Jan-16 Apr-16 Jul-16 Oct-16 Jan-17 Apr-17 Jul-17 PERatio(1yearforward)
  • 8. Appendix Analyst Certification The views expressed in this Research Report accurately reflect the personal views of the analyst(s) about the subject securities or issuers and no part of the compensation of the research analyst(s) was, is, or will be directly or indirectly related to the specific recommendations or views expressed by the research analyst(s) in this report. The research analysts are bound by stringent internal regulations and also legal and statutory requirements of the Securities and Exchange Board of India (hereinafter “SEBI”) and the analysts’ compensation are completely delinked from all the other companies and/or entities of Anand Rathi, and have no bearing whatsoever on any recommendation that they have given in the Research Report. Important Disclosures on subject companies Rating and Target Price History (as of 19 July 2017) Date Rating TP (`) Share Price (`) 1 11-Feb-14 Buy 463 365 2 01-Apr-14 Buy 438 339 3 04-Jun-14 Buy 450 390 4 12-Jun-14 Buy 475 432 5 04-Jul-14 Hold 475 426 6 18-Jul-14 Buy 500 441 7 20-Aug-14 Sell 500 508 8 01-Oct-14 Sell 575 589 9 16-Oct-14 Hold 585 518 10 05-Jan-15 Sell 640 636 11 20-Jan-15 Sell 680 706 12 09-Apr-15 Sell 655 733 13 17-Jul-15 Sell 640 615 14 19-Jan-16 Sell 690 735 15 19-Apr-16 Sell 710 731 16 19-Jul-16 Hold 650 614 17 06-Sep-16 Buy 630 525 18 24-Oct-16 Hold 550 479 19 20-Jan-17 Hold 535 485 20 21-Apr-17 Buy 535 443 Anand Rathi Ratings Definitions Analysts’ ratings and the corresponding expected returns take into account our definitions of Large Caps (>US$1bn) and Mid/Small Caps (<US$1bn) as described in the Ratings Table below: Ratings Guide (12 months) Buy Hold Sell Large Caps (>US$1bn) >15% 5-15% <5% Mid/Small Caps (<US$1bn) >25% 5-25% <5% Research Disclaimer and Disclosure inter-alia as required under Securities and Exchange Board of India (Research Analysts) Regulations, 2014 Anand Rathi Share and Stock Brokers Ltd. (hereinafter refer as ARSSBL) (Research Entity) is a subsidiary of Anand Rathi Financial Services Ltd. ARSSBL is a corporate trading and clearing member of Bombay Stock Exchange Ltd, National Stock Exchange of India Ltd. (NSEIL), Multi Stock Exchange of India Ltd (MCX- SX), United Stock Exchange and also depository participant with National Securities Depository Ltd (NSDL) and Central Depository Services Ltd. ARSSBL is engaged in the business of Stock Broking, Depository Participant and Mutual Fund distributor. The research analysts, strategists, or research associates principally responsible for the preparation of Anand Rathi research have received compensation based upon various factors, including quality of research, investor client feedback, stock picking, competitive factors and firm revenues. General Disclaimer: This Research Report (hereinafter called “Report”) is meant solely for use by the recipient and is not for circulation. This Report does not constitute a personal recommendation or take into account the particular investment objectives, financial situations, or needs of individual clients. The recommendations, if any, made herein are expression of views and/or opinions and should not be deemed or construed to be neither advice for the purpose of purchase or sale of any security, derivatives or any other security through ARSSBL nor any solicitation or offering of any investment /trading opportunity on behalf of the issuer(s) of the respective security (ies) referred to herein. These information / opinions / views are not meant to serve as a professional investment guide for the readers. No action is solicited based upon the information provided herein. Recipients of this Report should rely on information/data arising out of their own investigations. Readers are advised to seek independent professional advice and arrive at an informed trading/investment decision before executing any trades or making any investments. This Report has been prepared on the basis of publicly available information, internally developed data and other sources believed by ARSSBL to be reliable. ARSSBL or its directors, employees, affiliates or representatives do not assume any responsibility for, or warrant the accuracy, completeness, adequacy and reliability of such information / opinions / views. While due care has been taken to ensure that the disclosures and opinions given are fair and reasonable, none of the directors, employees, affiliates or representatives of ARSSBL shall be liable for any direct, indirect, special, incidental, consequential, punitive or exemplary damages, including lost profits arising in any way whatsoever from the information / opinions / views contained in this Report. The price and value of the investments referred to in this Report and the income from them may go down as well as up, and investors may realize losses on any investments. Past performance is not a guide for future performance. ARSSBL does not provide tax advice to its clients, and all investors are strongly advised to consult with their tax advisers regarding taxation aspects of any potential investment. Opinions expressed are our current opinions as of the date appearing on this Research only. We do not undertake to advise you as to any change of our views expressed in this Report. Research Report may differ between ARSSBL’s RAs and/ or ARSSBL’s associate companies on account of differences in research methodology, personal judgment and difference in time horizons for which recommendations are made. User should keep this risk in mind and not hold ARSSBL, its employees and associates responsible for any losses, damages of any type whatsoever. MindTree 20 1 2 3 8 4 5 6 7 9 10 11 12 13 14 15 16 17 18 19 - 100 200 300 400 500 600 700 800 900 Jan-14 Mar-14 May-14 Jul-14 Sep-14 Nov-14 Jan-15 Mar-15 May-15 Jul-15 Sep-15 Nov-15 Jan-16 Mar-16 May-16 Jul-16 Sep-16 Nov-16 Jan-17 Mar-17 May-17 Jul-17
  • 9. ARSSBL and its associates or employees may; (a) from time to time, have long or short positions in, and buy or sell the investments in/ security of company (ies) mentioned herein or (b) be engaged in any other transaction involving such investments/ securities of company (ies) discussed herein or act as advisor or lender / borrower to such company (ies) these and other activities of ARSSBL and its associates or employees may not be construed as potential conflict of interest with respect to any recommendation and related information and opinions. Without limiting any of the foregoing, in no event shall ARSSBL and its associates or employees or any third party involved in, or related to computing or compiling the information have any liability for any damages of any kind. Details of Associates of ARSSBL and Brief History of Disciplinary action by regulatory authorities & its associates are available on our website i.e. www.rathionline.com Disclaimers in respect of jurisdiction: This report is not directed to, or intended for distribution to or use by, any person or entity who is a citizen or resident of or located in any locality, state, country or other jurisdiction where such distribution, publication, availability or use would be contrary to law or regulation or which would subject ARSSBL to any registration or licensing requirement within such jurisdiction(s). No action has been or will be taken by ARSSBL in any jurisdiction (other than India), where any action for such purpose(s) is required. Accordingly, this Report shall not be possessed, circulated and/or distributed in any such country or jurisdiction unless such action is in compliance with all applicable laws and regulations of such country or jurisdiction. ARSSBL requires such recipient to inform himself about and to observe any restrictions at his own expense, without any liability to ARSSBL. Any dispute arising out of this Report shall be subject to the exclusive jurisdiction of the Courts in India. Statements on ownership and material conflicts of interest, compensation - ARSSBL and Associates Answers to the Best of the knowledge and belief of ARSSBL/ its Associates/ Research Analyst who is preparing this report ARSSBL/its Associates/ Research Analyst/ his Relative have actual/beneficial ownership of one per cent or more securities of the subject company, at the end of the month immediately preceding the date of publication of the research report? No ARSSBL/its Associates/ Research Analyst/ his Relative have actual/beneficial ownership of one per cent or more securities of the subject company No ARSSBL/its Associates/ Research Analyst/ his Relative have any other material conflict of interest at the time of publication of the research report? No ARSSBL/its Associates/ Research Analyst/ his Relative have received any compensation from the subject company in the past twelve months No ARSSBL/its Associates/ Research Analyst/ his Relative have managed or co-managed public offering of securities for the subject company in the past twelve months No ARSSBL/its Associates/ Research Analyst/ his Relative have received any compensation for investment banking or merchant banking or brokerage services from the subject company in the past twelve months No ARSSBL/its Associates/ Research Analyst/ his Relative have received any compensation for products or services other than investment banking or merchant banking or brokerage services from the subject company in the past twelve months No ARSSBL/its Associates/ Research Analyst/ his Relative have received any compensation or other benefits from the subject company or third party in connection with the research report No ARSSBL/its Associates/ Research Analyst/ his Relative have served as an officer, director or employee of the subject company. No Other Disclosures pertaining to distribution of research in the United States of America This report was prepared, approved, published and distributed by the Anand Rathi Share and Stock Brokers Limited (ARSSBL) located outside of the United States (a “non- US Group Company”). This report is distributed in the U.S. by Enclave Capital LLC, a U.S. registered broker dealer, on behalf of ARSSBL only to major U.S. institutional investors (as defined in Rule 15a-6 under the U.S. Securities Exchange Act of 1934 (the “Exchange Act”)) pursuant to the exemption in Rule 15a-6 and any transaction effected by a U.S. customer in the securities described in this report must be effected through Enclave Capital. ARSSBL accepts responsibility for its contents. Any US customer wishing to effect transactions in any securities referred to herein or options thereon should do so only by contacting a representative of Enclave Capital LLC at 646- 454-8600 Neither the report nor any analyst who prepared or approved the report is subject to U.S. legal requirements or the Financial Industry Regulatory Authority, Inc. (“FINRA”) or other regulatory requirements pertaining to research reports or research analysts. No non-US Group Company is registered as a broker-dealer under the Exchange Act or is a member of the Financial Industry Regulatory Authority, Inc. or any other U.S. self-regulatory organization. This material was produced by ARSSBL, solely for information purposes and for the use of the recipient. It is not to be reproduced under any circumstances and is not to be copied or made available to any person other than the recipient. It is distributed in the United States of America by Enclave Capital LLC (19 West 44th Street, Suite 1700, New York, NY 10036) and elsewhere in the world by ARSSBL or an authorized affiliate of ARSSBL (such entities and any other entity, directly or indirectly, controlled by ARSSBL, the “Affiliates”). This document does not constitute an offer of, or an invitation by or on behalf of ARSSBL or its Affiliates or any other company to any person, to buy or sell any security. The information contained herein has been obtained from published information and other sources, which ARSSBL or its Affiliates consider to be reliable. None of ARSSBL or its Affiliates accepts any liability or responsibility whatsoever for the accuracy or completeness of any such information. All estimates, expressions of opinion and other subjective judgments contained herein are made as of the date of this document. Emerging securities markets may be subject to risks significantly higher than more established markets. In particular, the political and economic environment, company practices and market prices and volumes may be subject to significant variations. The ability to assess such risks may also be limited due to significantly lower information quantity and quality. By accepting this document, you agree to be bound by all the foregoing provisions. 1. ARSSBL or its Affiliates may or may not have been beneficial owners of the securities mentioned in this report. 2. ARSSBL or its affiliates may have or not managed or co-managed a public offering of the securities mentioned in the report in the past 12 months. 3. ARSSBL or its affiliates may have or not received compensation for investment banking services from the issuer of these securities in the past 12 months and do not expect to receive compensation for investment banking services from the issuer of these securities within the next three months. 4. However, one or more of ARSSBL or its Affiliates may, from time to time, have a long or short position in any of the securities mentioned herein and may buy or sell those securities or options thereon, either on their own account or on behalf of their clients. 5. As of the publication of this report, ARSSBL does not make a market in the subject securities. 6. ARSSBL or its Affiliates may or may not, to the extent permitted by law, act upon or use the above material or the conclusions stated above, or the research or analysis on which they are based before the material is published to recipients and from time to time, provide investment banking, investment management or other services for or solicit to seek to obtain investment banking, or other securities business from, any entity referred to in this report. Enclave Capital LLC is distributing this document in the United States of America. ARSSBL accepts responsibility for its contents. Any US customer wishing to effect transactions in any securities referred to herein or options thereon should do so only by contacting a representative of Enclave Capital LLC. © 2016. This report is strictly confidential and is being furnished to you solely for your information. All material presented in this report, unless specifically indicated otherwise, is under copyright to ARSSBL. None of the material, its content, or any copy of such material or content, may be altered in any way, transmitted, copied or reproduced (in whole or in part) or redistributed in any form to any other party, without the prior express written permission of ARSSBL. All trademarks, service marks and logos used in this report are trademarks or service marks or registered trademarks or service marks of ARSSBL or its affiliates, unless specifically mentioned otherwise. Additional information on recommended securities/instruments is available on request. ARSSBL registered address: 4th Floor, Silver Metropolis, Jaicoach Compound, Opposite Bimbisar Nagar, Goregaon (East), Mumbai - 400 063. Tel No: +91 22 4001 3700 | Fax No: +91 22 4001 3770 | CIN: U67120MH1991PLC064106.