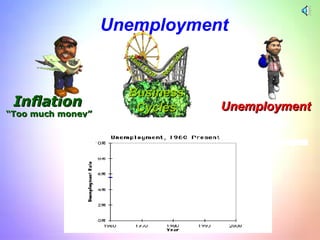
1. . Inflation “ Too much money” Real GDP Real GDP Unemployment Business Cycles Unemployment
2. UNEMPLOYMENT Measurement of Unemployment, 2004 Total Population 293,400,000 Labor force 146,800,000 84,200,000 76,000,000 8,200,000 138,600,000 Employed Not in labor force Under 16 and/or institutionalized Unemployed
3. Dollar Figures From Different Times Babe Ruth made $80,000 in 1931. That would be equivalent to $1 million today. [B arry Bonds gets $18 million a year] P resident Herbert H oover’s salary in 1931 was $ 75,000 . That would be equivalent to $900,000 today. George Bush is being paid $400,000 a year. Who is the Richest American Ever? John D. Rockefeller’s [1839-1937] wealth would be worth $200 billion in today’s money, or 4 times that of Bill Gates. Although Rockefeller was worth $200 billion, he could not watch TV, play video games, surf the internet, or send email to his grandkids. For most of his life, he could not use AC, travel by car or plane, use a telephone to call friends, or take advantage of antibiotics to prolong & enhance life. Perhaps the average American today is richer than the richest American a century ago. $ 80, 000= $ 1 M
4.
5. 1920 2002 Watchmakers 100,000 5,000 Professional jocks 5,000 80,000 Railroad employees 2 mil [1910] 215,000 Blacksmiths 238, 000 [1910] 5,000 Farm workers 12 M [1910] 851,000 Engineers 38,000 [1900] 2 mil. A uto M echanics 0 in 1900 1 mil. C omputer programmers 5,000 [1960] 2 mil. Creative Destruction
6.
7. 2. Structural Unemployment Structural – Skills do not match current jobs. There are basic changes in the “structure” of the labor force which make certain “skills obsolete” . Automation may result in job losses. Consumer taste may make a good “obsolete”. The auto reduced the need for carriage makers . Farm machinery reduced the need for farm laborers. “ Creative destruction” means as jobs are created, other jobs are lost. Jobs of the future destroy jobs of today. Frictional and Structural make up the “natural rate of unemployment” . “ These jobs do not come back.” “ Non-transferable skills” – choice is prolonged unemployment or retraining.
8. 3. C yclical U nemployment Cyclical – “ economic downturns” in the business cycle . “ Cyclical unemployment” is “real unemployment”. “ These jobs do come back.”
13. Unemployment Falls from 6.4% to 6.2% Because the Labor Force Shrinks by 556,000 July, 2003 9 million were unemployed in July, compared to 9.4 million in June.
16. Unemployment Report for 2004 There were 1,000 created but 309,000 dropped out so unemployment looked better (5.9% to 5.7% but it really wasn’t) Recession
18. Who Were the Unemployed in 2000 when Unemployment was 4 %? Unemployment Rates vary . . . White Black Hispanic White Black Hispanic White Black Hispanic National average High school dropouts High school graduates College dropouts College graduates Master's degree Doctoral degree 3.2 3.7 5.9 3.5 5.4 5.3 16.7 11.4 Adult Males Adult Females Teenagers 24.7 4.0 6.4 3.5 2.7 1.8 1.6 0.9 40 36 32 28 24 20 16 12 8 4 0 . . . by race, sex, age . . . by education
19. The More You Learn, The More You Earn 1998 Overall Unemployment Rate = 4.4% [Unemployment Rate & Median Earnings by Education] 8% 7% 6% 5% 4% 3% 2% 1% 0 4.1% $ 28K High School Grad 3.2% $ 31K Some College Grad Unemployment Rate - 1998 Mediun Earnings 2.5% $33K Associates Degree 1.9% $ 51K C ollege $80,000 $70,000 $60,000 $50,000 $40,000 $30,000 $20,000 $10,000 0 1.6% $60K Master’s 1.3% $75K Advanced Degree 7.1% $19K Less Than High S choo l D iploma