

Recommandé
Contenu connexe
Tendances
Tendances (20)
En vedette
Similaire à 03 analytical geometry
Similaire à 03 analytical geometry (20)
Dernier
Dernier (20)
03 analytical geometry
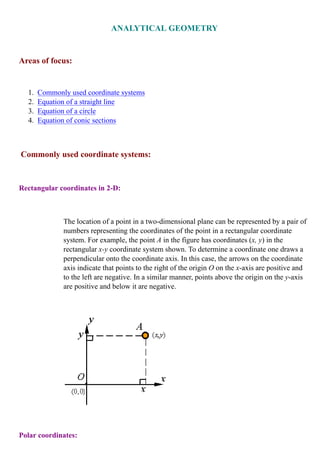
- 1. Commonly used coordinate systems1. Equation of a straight line2. Equation of a circle3. Equation of conic sections4. Rectangular coordinates in 2-D: The location of a point in a two-dimensional plane can be represented by a pair of numbers representing the coordinates of the point in a rectangular coordinate system. For example, the point in the figure has coordinates ( ) in the rectangular coordinate system shown. To determine a coordinate one draws a perpendicular onto the coordinate axis. In this case, the arrows on the coordinate axis indicate that points to the right of the origin on the -axis are positive and to the left are negative. In a similar manner, points above the origin on the -axis are positive and below it are negative. Polar coordinates:
- 2. The location of a point in a two dimensional plane can be represented by a pair of numbers representing the coordinates of the point in a polar coordinate system. For example, the point in the figure has coordinates in the polar coordinate system shown. In this coordinate system represents the radial distance from the reference point to the point and represents the angle the line makes with the reference line . As indicated by the arrow, the angle is positive if measured counter clockwise from and negative if measured clockwise. Rectangular coordinates in 3-D: The location of a point in three-dimensional space can be represented by a triplet of numbers representing the coordinates of the point in a rectangular coordinate system. For example, point in the figure has coordinates ( ) in the rectangular coordinate system shown. To get these coordinates one can drop a perpendicular line from onto the plane to get point and then draw perpendiculars onto the and -axes.
- 3. Cylindrical Coordinates: The coordinates of a point in three-dimensional space can be represented in cylindrical coordinates by the triplet ( ) as shown in the figure. Spherical Coordinates: The coordinates of a point in three-dimensional space can be represented in spherical coordinates by the triplet as shown in the figure.
- 4. The equation of a straight line in a plane is given in the coordinate system by the set of points ( ) that satisfy the equation where, as shown in the figure, represents the slope of the line in terms of its rise divided by its run, and is the -coordinate of the point of intercept of the line and the -axis. One can evaluate the equation of a line from any two points on it. For example, consider points and shown in the figure with coordinates (x1 ,y1 ) and (x2 ,y2 ), respectively. Since ACD and ABE are similar triangles, we have
- 5. This can be put in the above format by selecting If x1 = 0, then, as can be seen from the figure,
- 6. The circle centered at the origin of a rectangular coordinate system is given by the set of all points ( ) that satisfy the equation where, as can be seen in the figure, is the radius of the circle. In polar coordinates the equation of a circle is given by specifying the radial coordinate to be constant. For a circle centered at point ( 1 , 1 ) and of radius , the equation of the points on the circle is given by
- 7. The ellipse, parabola, and hyperbola are conic sections. Their curves have the distinct characteristic that each point on the curve is such that the ratio of its distance from a line known as the directrix and a point known as the focus is a given constant. In the figure, is the focus, is the directrix and, the constant , known as the eccentricity, defines the conic section and is given by The value of the eccentricity defines the conic shape. < 1 gives an ellipse e = 1 gives a parabola e > 1 gives a hyperbola Equation of an ellipse: The equation of an ellipse in the rectangular coordinate system is given by
- 8. where and are half the lengths, respectively, of the major and minor axis. Equations of parabolas: The basic equation of a parabola in a rectangular coordinate system is given by Depending on the sign of , this equation will result in one of the two following graphs.
- 9. A parabola that is rotate 90o can be represented by the equation The graph of this is shown in the following figure. The equation for parabolas moved from the origin to another point is given in the following figures.
- 10. Equations of hyperbolas: The equation of a hyperbola centered at the origin with its major axis on the -axis is given by
- 11. The figure shows the graph of this equation, where F1 and F2 are the focal points and the major axis is the line that passes through these points. The lengths of the major and minor axis of the hyperbola are given by and , respectively, as shown in the following figure. If the center of the hyperbola is moved from the origin to a point with coordinates ( 1 , 1 ), then the equation of the hyperbola becomes To get a hyperbola with major axis parallel to the vertical axis, one can change and in the equations.
- 12. A hyperbola with equal major and minor axis and with axis rotated 45o from the axes has an equation where the major and minor axes each have a length of . The figure shows this hyperbola.