SlideShare une entreprise Scribd logo
1  sur  5
Statistics – Lab Week 2

Name:_______________________
Math221

Statistical Concepts:
    Using MINITAB
    Graphics
    Shapes of Distributions
    Descriptive Statistics
    Empirical Rule


Data in MINITAB

 MINITAB is a powerful, yet user-friendly, data analysis software package. You can
  launch MINITAB by finding the icon and double clicking on it. After a moment you
  will see two windows, the Session Window in the top half of the screen and the
  Worksheet or Data Window in the bottom half.

 Data have already been formatted and entered into a MINITAB worksheet. Go to the
  eCollege Doc sharing site to download this data file. The names of each variable from
  the survey are in the first row of the Worksheet. This row has a background color of
  gray to identify it as the variable names. All other rows of the MINITAB Worksheet
  represent a certain students‟ answers to the survey questions. Therefore, the rows are
  called observations and the columns are called variables. Included with this lab, you
  will find a code sheet that identifies the correspondence between the variable names
  and the survey questions.

 Complete the answers below and paste the answers from MiniTab below each
  question. Type your answers to the questions where noted. Therefore, your response
  to the lab will be this ONE document submitted to the dropbox.


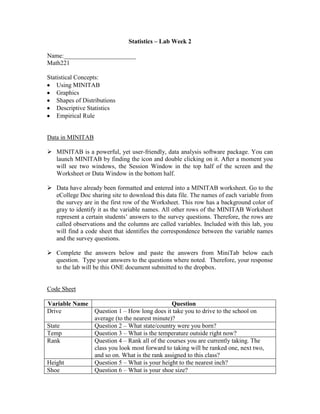
Code Sheet

Variable Name                                    Question
Drive             Question 1 – How long does it take you to drive to the school on
                  average (to the nearest minute)?
State             Question 2 – What state/country were you born?
Temp              Question 3 – What is the temperature outside right now?
Rank              Question 4 – Rank all of the courses you are currently taking. The
                  class you look most forward to taking will be ranked one, next two,
                  and so on. What is the rank assigned to this class?
Height            Question 5 – What is your height to the nearest inch?
Shoe              Question 6 – What is your shoe size?
Sleep             Question 7 – How many hours did you sleep last night?
Gender            Question 8 – What is your gender?
Race              Question 9 – What is your race?
Car               Question 10 – What color of car do you drive?
TV                Question 11 – How long (on average) do you spend a day watching
                  TV?
Money             Question 12 – How much money do you have with you right now?
Coin              Question 13 – Flip a coin 10 times. How many times did you get tails?
Die1              Question 14 – Roll a six-sided die 10 times and record the results.
Die2
Die3
Die4
Die5
Die6
Die7
Die8
Die9
Die10


Creating Graphs

1. Create a Pie Chart for the variable Car – Pull up Graph > Pie Chart and click in the
   categories variables box so that the list of variables will show up on the left. Now
   double click on the variable name „Car” in the box at the left of the window. Include a
   title by clicking on the “Labels…” button and typing it in the correct text area (put
   your name in as the title) and click OK. Click OK again to create graph. Click on the
   graph and use Ctrl+C to copy and come back here, click below this question and use
   Ctrl+V to paste it in this Word document.


2. Create a histogram for the variable Height – Pull up Graph > Histograms and
   choose “Simple”. Then set the graph variable to “height”. Include a title by clicking
   on the “Labels…” button and typing it in the correct text area (put your name in as
   the title) and click OK. Copy and paste the graph here.
3. Create a stem and leaf chart for the variable Money – Pull up Graph > Stem-and
   Leaf and set Variables: to “Money”. Enter 10 for the Increment: and click OK.
   The leaves of the stem-leaf plot will be the one’s digits of the values in the “Money”
   variable. Note: the first column of the stem-leaf plot that you create is the count. The
   row with the count in parentheses includes the median. The counts below the median
   cumulate from the bottom of the plot.
   Copy and paste the graph here.


Calculating Descriptive Statistics

4. Calculate descriptive statistics for the variable Height by Gender – Pull up Stat >
   Basic Statistics > Display Descriptive Statistics and set Variables: to Height.
   Check By variable: and enter Gender into this text box. Click OK. Type the mean
   and the standard deviation for both males and females in the space below this
   question.

                                 Mean                          Standard deviation
   Females
   Males
 Select File > Save Worksheet As to save the data set. You must either keep a copy
  of this data or download it again off the web site for future labs.


Short Answer Writing Assignment

All answers should be complete sentences.

5. What is the most common color of car for students who participated in this survey?
   Explain how you arrived at your answer.


6. What is seen in the histogram created for the heights of students in this class (include
   the shape)? Explain your answer.


7. What is seen in the stem and leaf plot for the money variable (include the shape)?
   Explain your answer.


8. Compare the mean for the heights of males and the mean for the heights of females in
   these data. Compare the values and explain what can be concluded based on the
   numbers.


9. Compare the standard deviation for the heights of males and the standard deviation
   for the heights of females in the class. Compare the values and explain what can be
   concluded based on the numbers.
10. Using the empirical rule, 95% of female heights should be between what two values?
    Either show work or explain how your answer was calculated.


11. Using the empirical rule, 68% of male heights should be between what two values?
    Either show work or explain how your answer was calculated.

Contenu connexe

En vedette

Math 221 week 6 lecture april 2015
Math 221 week 6 lecture april 2015Math 221 week 6 lecture april 2015
Math 221 week 6 lecture april 2015Katherine Applegarth
 
Week 4 lab_examples_mini_tab_2011
Week 4 lab_examples_mini_tab_2011Week 4 lab_examples_mini_tab_2011
Week 4 lab_examples_mini_tab_2011Brent Heard
 
Normal Distribution
Normal DistributionNormal Distribution
Normal Distributiondheard3
 
Strength of Materials iLab
Strength of Materials iLabStrength of Materials iLab
Strength of Materials iLabBabatunde Ishola
 
Assignment 6 tv channal analysis
Assignment 6   tv channal analysisAssignment 6   tv channal analysis
Assignment 6 tv channal analysisjodiefoster96
 
Blood test for detecting fetal abnormalities gaining interest
Blood test for detecting fetal abnormalities gaining interestBlood test for detecting fetal abnormalities gaining interest
Blood test for detecting fetal abnormalities gaining interestBest care Lab
 
7 myths of business innovation
7 myths of business innovation7 myths of business innovation
7 myths of business innovationBryan Cassady
 
Docxpresso presentation Document Management
Docxpresso presentation Document ManagementDocxpresso presentation Document Management
Docxpresso presentation Document ManagementLink to WhatsApp
 
Software Development Craftsmanship
Software Development CraftsmanshipSoftware Development Craftsmanship
Software Development Craftsmanshipmike dunn
 
Forms & conventions for documentary jodie
Forms & conventions for documentary jodieForms & conventions for documentary jodie
Forms & conventions for documentary jodiejodiefoster96
 
Scratch 1112
Scratch 1112Scratch 1112
Scratch 1112Seok Lee
 
Preliminary posters
Preliminary postersPreliminary posters
Preliminary postersmarwasaroya
 

En vedette (16)

Ssrn id2170508
Ssrn id2170508Ssrn id2170508
Ssrn id2170508
 
Math 221 week 6 lecture april 2015
Math 221 week 6 lecture april 2015Math 221 week 6 lecture april 2015
Math 221 week 6 lecture april 2015
 
Week 4 lab_examples_mini_tab_2011
Week 4 lab_examples_mini_tab_2011Week 4 lab_examples_mini_tab_2011
Week 4 lab_examples_mini_tab_2011
 
Normal Distribution
Normal DistributionNormal Distribution
Normal Distribution
 
Strength of Materials iLab
Strength of Materials iLabStrength of Materials iLab
Strength of Materials iLab
 
Assignment 6 tv channal analysis
Assignment 6   tv channal analysisAssignment 6   tv channal analysis
Assignment 6 tv channal analysis
 
Blood test for detecting fetal abnormalities gaining interest
Blood test for detecting fetal abnormalities gaining interestBlood test for detecting fetal abnormalities gaining interest
Blood test for detecting fetal abnormalities gaining interest
 
7 myths of business innovation
7 myths of business innovation7 myths of business innovation
7 myths of business innovation
 
Docxpresso presentation Document Management
Docxpresso presentation Document ManagementDocxpresso presentation Document Management
Docxpresso presentation Document Management
 
Software Development Craftsmanship
Software Development CraftsmanshipSoftware Development Craftsmanship
Software Development Craftsmanship
 
Forms & conventions for documentary jodie
Forms & conventions for documentary jodieForms & conventions for documentary jodie
Forms & conventions for documentary jodie
 
RT 2014
RT 2014RT 2014
RT 2014
 
Scratch 1112
Scratch 1112Scratch 1112
Scratch 1112
 
Merakit pc 2
Merakit pc 2Merakit pc 2
Merakit pc 2
 
Preliminary posters
Preliminary postersPreliminary posters
Preliminary posters
 
Evaluation
EvaluationEvaluation
Evaluation
 

Similaire à Math221 w2 lab your_name_here

De vry math 399 all ilabs latest 2016 november
De vry math 399 all ilabs latest 2016 novemberDe vry math 399 all ilabs latest 2016 november
De vry math 399 all ilabs latest 2016 novemberlenasour
 
1.MATH 221 Statistics for Decision MakingWeek 2 iLabName.docx
1.MATH 221 Statistics for Decision MakingWeek 2 iLabName.docx1.MATH 221 Statistics for Decision MakingWeek 2 iLabName.docx
1.MATH 221 Statistics for Decision MakingWeek 2 iLabName.docxAlyciaGold776
 
De vry math 221 all discussion+ilbs latest 2016 november 1
De vry math 221 all discussion+ilbs latest 2016 november 1De vry math 221 all discussion+ilbs latest 2016 november 1
De vry math 221 all discussion+ilbs latest 2016 november 1lenasour
 
As mentioned earlier, the mid-term will have conceptual and quanti.docx
As mentioned earlier, the mid-term will have conceptual and quanti.docxAs mentioned earlier, the mid-term will have conceptual and quanti.docx
As mentioned earlier, the mid-term will have conceptual and quanti.docxfredharris32
 
Chapter 4 Problem 31. For problem three in chapter four, a teac.docx
Chapter 4 Problem 31. For problem three in chapter four,   a teac.docxChapter 4 Problem 31. For problem three in chapter four,   a teac.docx
Chapter 4 Problem 31. For problem three in chapter four, a teac.docxrobertad6
 
Week 6 lecture_math_221_apr_2012
Week 6 lecture_math_221_apr_2012Week 6 lecture_math_221_apr_2012
Week 6 lecture_math_221_apr_2012Brent Heard
 
Apperson benchmark tm 3000
Apperson benchmark tm 3000Apperson benchmark tm 3000
Apperson benchmark tm 3000qhenderson
 
Week 6 lecture_math_221_dec_2012
Week 6 lecture_math_221_dec_2012Week 6 lecture_math_221_dec_2012
Week 6 lecture_math_221_dec_2012Brent Heard
 
Math 221 Massive Success / snaptutorial.com
Math 221 Massive Success / snaptutorial.comMath 221 Massive Success / snaptutorial.com
Math 221 Massive Success / snaptutorial.comStephenson164
 
Since the instructions for the final project are standardized and .docx
Since the instructions for the final project are standardized and .docxSince the instructions for the final project are standardized and .docx
Since the instructions for the final project are standardized and .docxedgar6wallace88877
 

Similaire à Math221 w2 lab your_name_here (12)

De vry math 399 all ilabs latest 2016 november
De vry math 399 all ilabs latest 2016 novemberDe vry math 399 all ilabs latest 2016 november
De vry math 399 all ilabs latest 2016 november
 
1.MATH 221 Statistics for Decision MakingWeek 2 iLabName.docx
1.MATH 221 Statistics for Decision MakingWeek 2 iLabName.docx1.MATH 221 Statistics for Decision MakingWeek 2 iLabName.docx
1.MATH 221 Statistics for Decision MakingWeek 2 iLabName.docx
 
De vry math 221 all discussion+ilbs latest 2016 november 1
De vry math 221 all discussion+ilbs latest 2016 november 1De vry math 221 all discussion+ilbs latest 2016 november 1
De vry math 221 all discussion+ilbs latest 2016 november 1
 
As mentioned earlier, the mid-term will have conceptual and quanti.docx
As mentioned earlier, the mid-term will have conceptual and quanti.docxAs mentioned earlier, the mid-term will have conceptual and quanti.docx
As mentioned earlier, the mid-term will have conceptual and quanti.docx
 
Chapter 4 Problem 31. For problem three in chapter four, a teac.docx
Chapter 4 Problem 31. For problem three in chapter four,   a teac.docxChapter 4 Problem 31. For problem three in chapter four,   a teac.docx
Chapter 4 Problem 31. For problem three in chapter four, a teac.docx
 
Week 6 lecture_math_221_apr_2012
Week 6 lecture_math_221_apr_2012Week 6 lecture_math_221_apr_2012
Week 6 lecture_math_221_apr_2012
 
Dataanalysis
DataanalysisDataanalysis
Dataanalysis
 
Apperson benchmark tm 3000
Apperson benchmark tm 3000Apperson benchmark tm 3000
Apperson benchmark tm 3000
 
Week 6 lecture_math_221_dec_2012
Week 6 lecture_math_221_dec_2012Week 6 lecture_math_221_dec_2012
Week 6 lecture_math_221_dec_2012
 
Qnt275 qnt 275
Qnt275 qnt 275Qnt275 qnt 275
Qnt275 qnt 275
 
Math 221 Massive Success / snaptutorial.com
Math 221 Massive Success / snaptutorial.comMath 221 Massive Success / snaptutorial.com
Math 221 Massive Success / snaptutorial.com
 
Since the instructions for the final project are standardized and .docx
Since the instructions for the final project are standardized and .docxSince the instructions for the final project are standardized and .docx
Since the instructions for the final project are standardized and .docx
 

Dernier

Vertex AI Gemini Prompt Engineering Tips
Vertex AI Gemini Prompt Engineering TipsVertex AI Gemini Prompt Engineering Tips
Vertex AI Gemini Prompt Engineering TipsMiki Katsuragi
 
Commit 2024 - Secret Management made easy
Commit 2024 - Secret Management made easyCommit 2024 - Secret Management made easy
Commit 2024 - Secret Management made easyAlfredo García Lavilla
 
H2O.ai CEO/Founder: Sri Ambati Keynote at Wells Fargo Day
H2O.ai CEO/Founder: Sri Ambati Keynote at Wells Fargo DayH2O.ai CEO/Founder: Sri Ambati Keynote at Wells Fargo Day
H2O.ai CEO/Founder: Sri Ambati Keynote at Wells Fargo DaySri Ambati
 
Powerpoint exploring the locations used in television show Time Clash
Powerpoint exploring the locations used in television show Time ClashPowerpoint exploring the locations used in television show Time Clash
Powerpoint exploring the locations used in television show Time Clashcharlottematthew16
 
Unleash Your Potential - Namagunga Girls Coding Club
Unleash Your Potential - Namagunga Girls Coding ClubUnleash Your Potential - Namagunga Girls Coding Club
Unleash Your Potential - Namagunga Girls Coding ClubKalema Edgar
 
Gen AI in Business - Global Trends Report 2024.pdf
Gen AI in Business - Global Trends Report 2024.pdfGen AI in Business - Global Trends Report 2024.pdf
Gen AI in Business - Global Trends Report 2024.pdfAddepto
 
Leverage Zilliz Serverless - Up to 50X Saving for Your Vector Storage Cost
Leverage Zilliz Serverless - Up to 50X Saving for Your Vector Storage CostLeverage Zilliz Serverless - Up to 50X Saving for Your Vector Storage Cost
Leverage Zilliz Serverless - Up to 50X Saving for Your Vector Storage CostZilliz
 
Artificial intelligence in cctv survelliance.pptx
Artificial intelligence in cctv survelliance.pptxArtificial intelligence in cctv survelliance.pptx
Artificial intelligence in cctv survelliance.pptxhariprasad279825
 
Human Factors of XR: Using Human Factors to Design XR Systems
Human Factors of XR: Using Human Factors to Design XR SystemsHuman Factors of XR: Using Human Factors to Design XR Systems
Human Factors of XR: Using Human Factors to Design XR SystemsMark Billinghurst
 
SIP trunking in Janus @ Kamailio World 2024
SIP trunking in Janus @ Kamailio World 2024SIP trunking in Janus @ Kamailio World 2024
SIP trunking in Janus @ Kamailio World 2024Lorenzo Miniero
 
Tampa BSides - Chef's Tour of Microsoft Security Adoption Framework (SAF)
Tampa BSides - Chef's Tour of Microsoft Security Adoption Framework (SAF)Tampa BSides - Chef's Tour of Microsoft Security Adoption Framework (SAF)
Tampa BSides - Chef's Tour of Microsoft Security Adoption Framework (SAF)Mark Simos
 
Story boards and shot lists for my a level piece
Story boards and shot lists for my a level pieceStory boards and shot lists for my a level piece
Story boards and shot lists for my a level piececharlottematthew16
 
How to write a Business Continuity Plan
How to write a Business Continuity PlanHow to write a Business Continuity Plan
How to write a Business Continuity PlanDatabarracks
 
Advanced Computer Architecture – An Introduction
Advanced Computer Architecture – An IntroductionAdvanced Computer Architecture – An Introduction
Advanced Computer Architecture – An IntroductionDilum Bandara
 
"LLMs for Python Engineers: Advanced Data Analysis and Semantic Kernel",Oleks...
"LLMs for Python Engineers: Advanced Data Analysis and Semantic Kernel",Oleks..."LLMs for Python Engineers: Advanced Data Analysis and Semantic Kernel",Oleks...
"LLMs for Python Engineers: Advanced Data Analysis and Semantic Kernel",Oleks...Fwdays
 
CloudStudio User manual (basic edition):
CloudStudio User manual (basic edition):CloudStudio User manual (basic edition):
CloudStudio User manual (basic edition):comworks
 
"Subclassing and Composition – A Pythonic Tour of Trade-Offs", Hynek Schlawack
"Subclassing and Composition – A Pythonic Tour of Trade-Offs", Hynek Schlawack"Subclassing and Composition – A Pythonic Tour of Trade-Offs", Hynek Schlawack
"Subclassing and Composition – A Pythonic Tour of Trade-Offs", Hynek SchlawackFwdays
 
New from BookNet Canada for 2024: BNC CataList - Tech Forum 2024
New from BookNet Canada for 2024: BNC CataList - Tech Forum 2024New from BookNet Canada for 2024: BNC CataList - Tech Forum 2024
New from BookNet Canada for 2024: BNC CataList - Tech Forum 2024BookNet Canada
 
The Ultimate Guide to Choosing WordPress Pros and Cons
The Ultimate Guide to Choosing WordPress Pros and ConsThe Ultimate Guide to Choosing WordPress Pros and Cons
The Ultimate Guide to Choosing WordPress Pros and ConsPixlogix Infotech
 

Dernier (20)

Vertex AI Gemini Prompt Engineering Tips
Vertex AI Gemini Prompt Engineering TipsVertex AI Gemini Prompt Engineering Tips
Vertex AI Gemini Prompt Engineering Tips
 
Commit 2024 - Secret Management made easy
Commit 2024 - Secret Management made easyCommit 2024 - Secret Management made easy
Commit 2024 - Secret Management made easy
 
H2O.ai CEO/Founder: Sri Ambati Keynote at Wells Fargo Day
H2O.ai CEO/Founder: Sri Ambati Keynote at Wells Fargo DayH2O.ai CEO/Founder: Sri Ambati Keynote at Wells Fargo Day
H2O.ai CEO/Founder: Sri Ambati Keynote at Wells Fargo Day
 
Powerpoint exploring the locations used in television show Time Clash
Powerpoint exploring the locations used in television show Time ClashPowerpoint exploring the locations used in television show Time Clash
Powerpoint exploring the locations used in television show Time Clash
 
Unleash Your Potential - Namagunga Girls Coding Club
Unleash Your Potential - Namagunga Girls Coding ClubUnleash Your Potential - Namagunga Girls Coding Club
Unleash Your Potential - Namagunga Girls Coding Club
 
Gen AI in Business - Global Trends Report 2024.pdf
Gen AI in Business - Global Trends Report 2024.pdfGen AI in Business - Global Trends Report 2024.pdf
Gen AI in Business - Global Trends Report 2024.pdf
 
Leverage Zilliz Serverless - Up to 50X Saving for Your Vector Storage Cost
Leverage Zilliz Serverless - Up to 50X Saving for Your Vector Storage CostLeverage Zilliz Serverless - Up to 50X Saving for Your Vector Storage Cost
Leverage Zilliz Serverless - Up to 50X Saving for Your Vector Storage Cost
 
Artificial intelligence in cctv survelliance.pptx
Artificial intelligence in cctv survelliance.pptxArtificial intelligence in cctv survelliance.pptx
Artificial intelligence in cctv survelliance.pptx
 
Human Factors of XR: Using Human Factors to Design XR Systems
Human Factors of XR: Using Human Factors to Design XR SystemsHuman Factors of XR: Using Human Factors to Design XR Systems
Human Factors of XR: Using Human Factors to Design XR Systems
 
SIP trunking in Janus @ Kamailio World 2024
SIP trunking in Janus @ Kamailio World 2024SIP trunking in Janus @ Kamailio World 2024
SIP trunking in Janus @ Kamailio World 2024
 
DMCC Future of Trade Web3 - Special Edition
DMCC Future of Trade Web3 - Special EditionDMCC Future of Trade Web3 - Special Edition
DMCC Future of Trade Web3 - Special Edition
 
Tampa BSides - Chef's Tour of Microsoft Security Adoption Framework (SAF)
Tampa BSides - Chef's Tour of Microsoft Security Adoption Framework (SAF)Tampa BSides - Chef's Tour of Microsoft Security Adoption Framework (SAF)
Tampa BSides - Chef's Tour of Microsoft Security Adoption Framework (SAF)
 
Story boards and shot lists for my a level piece
Story boards and shot lists for my a level pieceStory boards and shot lists for my a level piece
Story boards and shot lists for my a level piece
 
How to write a Business Continuity Plan
How to write a Business Continuity PlanHow to write a Business Continuity Plan
How to write a Business Continuity Plan
 
Advanced Computer Architecture – An Introduction
Advanced Computer Architecture – An IntroductionAdvanced Computer Architecture – An Introduction
Advanced Computer Architecture – An Introduction
 
"LLMs for Python Engineers: Advanced Data Analysis and Semantic Kernel",Oleks...
"LLMs for Python Engineers: Advanced Data Analysis and Semantic Kernel",Oleks..."LLMs for Python Engineers: Advanced Data Analysis and Semantic Kernel",Oleks...
"LLMs for Python Engineers: Advanced Data Analysis and Semantic Kernel",Oleks...
 
CloudStudio User manual (basic edition):
CloudStudio User manual (basic edition):CloudStudio User manual (basic edition):
CloudStudio User manual (basic edition):
 
"Subclassing and Composition – A Pythonic Tour of Trade-Offs", Hynek Schlawack
"Subclassing and Composition – A Pythonic Tour of Trade-Offs", Hynek Schlawack"Subclassing and Composition – A Pythonic Tour of Trade-Offs", Hynek Schlawack
"Subclassing and Composition – A Pythonic Tour of Trade-Offs", Hynek Schlawack
 
New from BookNet Canada for 2024: BNC CataList - Tech Forum 2024
New from BookNet Canada for 2024: BNC CataList - Tech Forum 2024New from BookNet Canada for 2024: BNC CataList - Tech Forum 2024
New from BookNet Canada for 2024: BNC CataList - Tech Forum 2024
 
The Ultimate Guide to Choosing WordPress Pros and Cons
The Ultimate Guide to Choosing WordPress Pros and ConsThe Ultimate Guide to Choosing WordPress Pros and Cons
The Ultimate Guide to Choosing WordPress Pros and Cons
 

Math221 w2 lab your_name_here

  • 1. Statistics – Lab Week 2 Name:_______________________ Math221 Statistical Concepts: Using MINITAB Graphics Shapes of Distributions Descriptive Statistics Empirical Rule Data in MINITAB  MINITAB is a powerful, yet user-friendly, data analysis software package. You can launch MINITAB by finding the icon and double clicking on it. After a moment you will see two windows, the Session Window in the top half of the screen and the Worksheet or Data Window in the bottom half.  Data have already been formatted and entered into a MINITAB worksheet. Go to the eCollege Doc sharing site to download this data file. The names of each variable from the survey are in the first row of the Worksheet. This row has a background color of gray to identify it as the variable names. All other rows of the MINITAB Worksheet represent a certain students‟ answers to the survey questions. Therefore, the rows are called observations and the columns are called variables. Included with this lab, you will find a code sheet that identifies the correspondence between the variable names and the survey questions.  Complete the answers below and paste the answers from MiniTab below each question. Type your answers to the questions where noted. Therefore, your response to the lab will be this ONE document submitted to the dropbox. Code Sheet Variable Name Question Drive Question 1 – How long does it take you to drive to the school on average (to the nearest minute)? State Question 2 – What state/country were you born? Temp Question 3 – What is the temperature outside right now? Rank Question 4 – Rank all of the courses you are currently taking. The class you look most forward to taking will be ranked one, next two, and so on. What is the rank assigned to this class? Height Question 5 – What is your height to the nearest inch? Shoe Question 6 – What is your shoe size?
  • 2. Sleep Question 7 – How many hours did you sleep last night? Gender Question 8 – What is your gender? Race Question 9 – What is your race? Car Question 10 – What color of car do you drive? TV Question 11 – How long (on average) do you spend a day watching TV? Money Question 12 – How much money do you have with you right now? Coin Question 13 – Flip a coin 10 times. How many times did you get tails? Die1 Question 14 – Roll a six-sided die 10 times and record the results. Die2 Die3 Die4 Die5 Die6 Die7 Die8 Die9 Die10 Creating Graphs 1. Create a Pie Chart for the variable Car – Pull up Graph > Pie Chart and click in the categories variables box so that the list of variables will show up on the left. Now double click on the variable name „Car” in the box at the left of the window. Include a title by clicking on the “Labels…” button and typing it in the correct text area (put your name in as the title) and click OK. Click OK again to create graph. Click on the graph and use Ctrl+C to copy and come back here, click below this question and use Ctrl+V to paste it in this Word document. 2. Create a histogram for the variable Height – Pull up Graph > Histograms and choose “Simple”. Then set the graph variable to “height”. Include a title by clicking on the “Labels…” button and typing it in the correct text area (put your name in as the title) and click OK. Copy and paste the graph here.
  • 3. 3. Create a stem and leaf chart for the variable Money – Pull up Graph > Stem-and Leaf and set Variables: to “Money”. Enter 10 for the Increment: and click OK. The leaves of the stem-leaf plot will be the one’s digits of the values in the “Money” variable. Note: the first column of the stem-leaf plot that you create is the count. The row with the count in parentheses includes the median. The counts below the median cumulate from the bottom of the plot. Copy and paste the graph here. Calculating Descriptive Statistics 4. Calculate descriptive statistics for the variable Height by Gender – Pull up Stat > Basic Statistics > Display Descriptive Statistics and set Variables: to Height. Check By variable: and enter Gender into this text box. Click OK. Type the mean and the standard deviation for both males and females in the space below this question. Mean Standard deviation Females Males
  • 4.  Select File > Save Worksheet As to save the data set. You must either keep a copy of this data or download it again off the web site for future labs. Short Answer Writing Assignment All answers should be complete sentences. 5. What is the most common color of car for students who participated in this survey? Explain how you arrived at your answer. 6. What is seen in the histogram created for the heights of students in this class (include the shape)? Explain your answer. 7. What is seen in the stem and leaf plot for the money variable (include the shape)? Explain your answer. 8. Compare the mean for the heights of males and the mean for the heights of females in these data. Compare the values and explain what can be concluded based on the numbers. 9. Compare the standard deviation for the heights of males and the standard deviation for the heights of females in the class. Compare the values and explain what can be concluded based on the numbers.
  • 5. 10. Using the empirical rule, 95% of female heights should be between what two values? Either show work or explain how your answer was calculated. 11. Using the empirical rule, 68% of male heights should be between what two values? Either show work or explain how your answer was calculated.