
Recommandé
Contenu connexe
Tendances
Tendances (20)
Similaire à Mangroves Swamp Profile - Nelson Perez-Jacome
Similaire à Mangroves Swamp Profile - Nelson Perez-Jacome (20)
Dernier
Dernier (20)
Mangroves Swamp Profile - Nelson Perez-Jacome
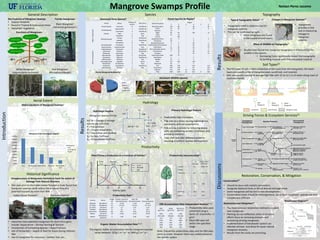
- 1. Mangrove Swamps ProfileIntroduction 220 181 24 18 Florida Mangrove Biodiversity9 Fish Birds Reptiles Mammal 0.00% 5.00% 10.00% 15.00% 20.00% 25.00% 30.00% 35.00% 40.00% 45.00% Asia The Americas West Africa Australia Africa & Mid- East Mangrove Area Coverage by Region5 Mangrove Area Coverage by Region General Description Functions of Mangroves Key Features of Mangrove Swamps • Coastal Wetlands • Found in Tropical & Subtropical Areas • Halophytic Vegetation Disappearance of Mangroves Partially at Fault for extent of Damage from Natural Disasters Indian Ocean Tsunami6 Hurricane Katrina7 • Industries have exploited mangroves for short-term gains include: Aquaculture – Shrimp Farming & Tourism • Introduction of Competing Species – Nypa Fruticans • Use of herbacides – largely at fault for losses during Vietnam War • Use of mangroves for resources – lumber, fuel, etc… Red Mangrove3 (Rhizophora Mangle) Florida Mangroves Black Mangrove1 (Avicennia germinans ) White Mangrove2 (Laguncularia racemosa) Species Results Discussions Topography Dominant Flora Species8 Fauna Species by Region8 Typical Topographic Relief17, 18 Hydrologic Regime Productivity Rate15 Organic Matter Accumulation Rate16, 24 Family Genus Number of species Plant form Majorcomponents Avicenniaceae Avicennia 8 Tree/Shrub Combretaceae Laguncularia 1 Tree/Shrub Lumnitzera 2 Tree/Shrub Palmae Nypa 1 Palm Rhizophoraceae Bruguiera 6 Tree Ceriops 2 Tree/Shrub Kandelia 1 Tree/Shrub Rhizophora 8 Tree Sonneratiaceae Sonneratia 5 Tree/Shrub MinorComponents Bombacaceae Camptostemon 2 Tree Euphorbiaceae Excoecaria 2 Tree/Shrub Lythraceae Pemphis 1 Shrub/Tree Meliaceae Xylocarpus 2 Tree Myrsinaceae Aegiceras 2 Shrub/Tree Myrtaceae Osbornia 1 Tree/Shrub Pellicieraceae Pelliciera 1 Tree Plumbaginaceae Aegialitis 2 Shrub Pteridaceae Acrostichum 3 Fern Rubiaceae Scyphiphora 1 Tree/Shrub Sterculiaceae Heritiera 3 Tree Taxonomic group Region 1 2 3 4 5 6 Flowering plants 110 80 - 28 - 20 Palms 73 42 - 20 - 8 Bacteria 10 - - - - - Algae 65 93 - 105 - 12 Fungi 25 14 - - - - Lichens 105 - - - - Bryophytes/Ferns 35 5 - 2 - 2 Protozoans 18 - - 3 - - Sponges/Bryozoans 5 7 - 36 - 1 Coelenterates/Ctenophores 3 6 - 42 - 12 Polychaetes 11 35 - 33 - 72 Non-polychaete worms 13 74 - 13 - 3 Echinoderms 1 10 - 29 - 23 Ascidians 8 - 30 - 13 Insects/Arachnids 500 72 - - - - Amphibians 2 - - 2 - - Reptiles 22 3 - 3 - - Birds 177 244 - 138 - - Mammals 36 7 - 5 - - Fish 283 156 - 212 - 114 Crustaceans 229 128 - 87 - 163 Molluscs 211 145 32 124 - 117 Total 1829 1234 32 912 0 560 Regions: 1 = Asia, 2 = Oceania, 3 = West Coast of the Americas, 4 = East Coast of the Americas, 5 =West Coast of Africa, 6 = East Coast of Africa and the Middle East. P 121 108 ET T S0 In = 1228 Out = 1177∆V/ ∆t = -54 G0 28 90 ∆V/ ∆t = Change in storage volume per unit time P = Precipitation ET = Evapotranspiration T = Tidal Inflow and Outflow S0= Surface Outflows G0= Groundwater Outflows Country Genus Height (m) Growth Increment (tonnes/ha/year) Litter Fall (tonnes/ha/year) NPP (tonnes/ha/year) Malaysia Rhizophora 21 12.38 11.26 23.64 Sri Lanka Rhizophora 3.5 4.3-6.8 4.4-6.2 8.7-13.0 Sri Lanka Avicennia 3.5 1.4 3.74 5.14 Thailand Rhizophora 11 20 6.7 26.7 Puerto Rico Rhizophora 8.6 3.07 9.49 12.56 Mexico Avicennia 20 12.06 12.52 24.58 Mexico Rhizophora + Avicennia 6 1.99 4.96 6.95 Plant Primary Production as a Function of Salinity13 • The first layer of soil is often comprised of the roots from the mangroves; the lower layers are usually a mix of mangrove peat, sand/mud, and limerock • Soils are usually covered at average high tide with 15 cm to 1 m of water along coast of southern Florida • Topographic relief is relatively low for mangrove systems. • This can be confirmed by sight. • Most mangroves are found in flat coastal environments Changes in Mangrove Swamps19 • Topography provides a vital tool in measuring changes in mangrove systems. • Studies have found that mangrove topography is influenced by the wildlife in the system. • Burrowing Crabs significantly impact the topography by building mounds with their excavated material • Predictable tidal inundation • Tide acts as a stress causing submergence, saline soils, and soil anaerobiosis • Tide acts as a subsidy by removing excess salts, reestablishing aerobic conditions, and providing nutrients. • Tides shift and alter sediment patterns resulting in uniform surface development Primary Hydrologic Feature Mangrove Swamp Florida Dominant Wildlife Species Mangrove Periwinkle10 Mangrove Terrapin11 Proboscis Monkey11Madagascar Teal11 Aerial Extent Global Locations of Mangrove Swamps4 Historical Significance • One year prior to the Indian ocean Tsunami a study found that mangrove swamps could reduce the pressure flow of a potential tsunami by more than 90% Hydrology Productivity Results Soil Types21 Driving Forces & Ecosystem Services21 Restoration, Conservation, & Mitigation Productivity Deconstructed14 The organic matter accumulation rate for mangrove swamps varies between: 107g C m-2 yr-1 to 1404 g C m-2 yr-1 Effect of Wildlife on Topography19 Conservation22 • Should be done with realistic parameters • Designate National Parks or World Natural Heritage Areas • Some mangroves will be lost to new developments • Conservation areas should be heterogeneous, since most mangroves swamps are very complex and different. Restoration and Mitigation23 • The most common restoration method is to plant new mangroves • Planting can be ineffective; other restoration efforts focus on removing stressors and recovering existing mangroves. • Implementation of breakwater system can alleviate stresses and allow for quasi-natural mangrove recovery. • Results from the study are promising. Breakwater Diagram23 OM Accumulation Rate Independent Analysis15,25 • Productivity rates were converted using a factor of: 1tonne/ha = 1 g/m2 • Most OM rates fall within the specified range. Note: Overall the productivity rates and the OM rates seem accurate. However these vary widely based on the specific system NPP (g/m2 /yr) Decay (g/m2 /yr) OM Accum (g/m2 /yr) 2364 1126 1238 870-1300 440-620 430-680 514 374 140 2670 670 2000 1256 949 307 2458 1252 1206 695 496 199 Nelson Perez-Jacome