Design and Analysis of Crankshaft for Internal Combustion Engine
Dissertation.1
1. 1
Experimental Investigation of a
Dual Crankshaft Engine
Nestoras Rose, Prof. Richard Stobart
18 May 2016
Summary
This report details a computational and experimental investigation of the dual crankshaft
engine. It aims to identify the effect a second crankshaft has on the side thrust force.
A test rig has been developed which can be operated with respectively one and two
crankshafts. It also allows speed and torque control while acquiring data regarding the side
thrust force at specified time intervals.
The experiment includes tests with a non-sealed and sealed combustion chamber with
compression ratio𝑟𝑟𝑐𝑐 = 2, while utilising a conventional piston design. Additional experiments
have also been conducted with a spaceball piston design with a non-sealed chamber.
Analysis of the data acquired from the tests, has repeatedly revealed that the dual crankshaft
configuration eliminates side thrust forces. Furthermore the torque required to motor the
engine with two crankshafts was found to be less, which in turn suggests better mechanically
efficiency.
Furthermore the comparisons between the conventional and spaceball piston show that the
latter design requires less force to travel through the cylinder and also decreases vibrations.
This in turn suggests that a decrease in sticking and scuffing occurs when the spaceball
shaped piston travels within the bore, further improving the mechanical efficiency of the dual
crankshaft configuration.
It is important that the configuration is further investigated is terms of combustion in order to
identify its thermodynamic characteristics. Hence a plan has been formed involving a model
dual crankshaft engine and it test bed for future examination.
2. MEng Stage 2 Final Year Report
Experimental Investigation of a Dual Crankshaft Engine
2
INTRODUCTION
The dual crankshaft engine’s geometry offers a reduction in sidewall thrust forces compared to a
conventional inline engine design. This phenomenon is due to a theoretical elimination of the resolving
forces acting onto the side of the cylinder liner. This is caused by the single crankshaft’s connection rod in
an inline engine which at all crank-positions except TDC and BTD is at an angle. It is expected that due to
this occurrence in a dual crankshaft design would reduce significantly the mechanical losses compared to a
single connection rod configuration engine. Given that the mechanical losses are accountable for a
significant portion of the overall losses of an engine, a substantial increase in thermal efficiency could be
expected.
Other advantages of this design include a better utilisation of the expanding gasses. Studies carried out
previously found that the piston motion created by a dual crank engine with a crankshaft offset from the
cylinder centre line offers a down stroke which occurs over a longer crank angle than the upstroke. This
potentially offers improvements in torque output and cylinder charge filling.
This mechanism has already been employed in internal combustion engines and fluid pumps. However the
advantages this configuration offers have yet to be experimentally quantified.
This project has been carried out to measure the magnitude of the side thrust force through an experiment
on a test rig which has been designed and manufactured to allow single and twin crankshaft operation.
Furthermore it also looks to compare the conventional and spaceball piston designs for a dual crankshaft
engine.
Figure 1– Neander Spaceball Piston Design for Twin Crankshaft Engine Application [1]
3. MEng Stage 2 Final Year Report
Experimental Investigation of a Dual Crankshaft Engine
3
Contents
1. LITERATURE REVIEW.................................................................................................................................6
1.1 Previous Work...............................................................................................................................6
1.2 Fuel Energy Distribution................................................................................................................8
1.3 Effect of Crankshaft Offset............................................................................................................9
1.4 Effect of Crankshaft Offset on Piston Friction Force...................................................................10
1.5 Theoretical Performance Comparison between Inline, Offset and Twin Crankshaft ICE...........11
1.6 Piston Friction Measurement .....................................................................................................12
1.6.1 Indicated Mean Effective Pressure .....................................................................................13
1.6.2 Floating liner to quantify the FMEP ....................................................................................13
1.6.3 Set up of a piston friction measuring device by the technical university of Munich..........14
1.6.4 Strip Down Method [12] .....................................................................................................15
1.7 Experimental Testing ..................................................................................................................15
1.8 Various Twin Crank Engine Designs ............................................................................................17
1.8.1 Arced Connecting Rods.......................................................................................................17
1.8.2 Spaceball Piston (Shark. Neander)......................................................................................18
1.8.3 Variable Compression Ratio Dual Crankshaft Engine .........................................................18
1.8.4 Contra-Rotating Dual Crankshaft with Dual Gudgeon Pins ................................................19
1.9 Crankshaft Design Optimization to Improve Dynamic Balancing ...............................................20
2. Computational Analysis ......................................................................................................................22
2.1 Nomenclature .............................................................................................................................22
2.2 Overview.....................................................................................................................................22
2.3 Computational Analysis for the Single Connection-rod Experiment of the Test Rig..................23
2.4 Liner-Piston Friction and Side Thrust Force Relation..................................................................25
2.4.1 Single Crankshaft Test.........................................................................................................25
2.4.2 Dual Crankshaft Test...........................................................................................................26
2.5 In-Cylinder Pressure and Side Thrust Force Relation – Single & Dual Crnakshaft Tests.............27
2.5.1 Simulation Data Analysis Single Crankshaft Test ................................................................27
2.6 Combining Pressure and Friction Effects for the Single Crankshaft Engine Test........................31
Conclusion...........................................................................................................................................31
3. TEST RIG DESIGN.................................................................................................................................32
3.1 Overview.....................................................................................................................................32
3.2 Piston Drive Operation Strategy .................................................................................................33
3.3 Instantaneous Side Thrust Force Calculating Strategy ...............................................................33
4. MEng Stage 2 Final Year Report
Experimental Investigation of a Dual Crankshaft Engine
4
3.4 Test Rigs’ Component .................................................................................................................34
3.4.1 Piston ..................................................................................................................................34
3.4.2 Cylinder Head......................................................................................................................35
3.4.3 Bore.....................................................................................................................................35
3.4.4 Solenoid Valve.....................................................................................................................36
3.4.5 Crankshafts..........................................................................................................................37
3.4.6 Con Rods .............................................................................................................................38
3.4.7 Electric Motor .....................................................................................................................39
3.4.8 Gears ...................................................................................................................................39
3.4.9 Load Cell..............................................................................................................................39
3.5 Electrical Hardware.....................................................................................................................40
3.5.1 Power Supply ......................................................................................................................40
3.5.2 Load Cell..............................................................................................................................40
3.5.3 Servo Motor ........................................................................................................................41
3.5.4 Test Rig Control Software ...................................................................................................41
3.5.5 Motor Control and Data Logging Interface.........................................................................44
3.5.6 Interface Instructions..........................................................................................................44
3.6 Test Rig Assembly .......................................................................................................................45
4. DUAL CRANKSHAFT ENGINE TESTING.................................................................................................46
4.1 Overview.....................................................................................................................................46
4.2 Calibrating the System................................................................................................................46
4.3 Geometry Calibration..................................................................................................................46
4.4 Test Rig Beta Testing Issue..........................................................................................................46
4.5 Test Description ..........................................................................................................................47
5. Data Analysis.......................................................................................................................................48
5.1 Analysis Overview .......................................................................................................................48
5.2 Part I – Investigating the effect of the piston friction on the side thrust force..........................48
5.2.1 Non- Sealed Chamber - Conclusion.....................................................................................50
5.3 Part II – Investigating the effect of in-cylinder pressure on the side thrust force......................51
5.3.1 Sealed Chamber - Conclusion .............................................................................................52
5.4 Part III – Investigating the Effect of a Spaceball Piston on a Dual Crankshaft Engine ................53
5.4.1 Overview - Operation Issue.................................................................................................53
5.4.2 Analysis – Spaceball Piston .................................................................................................53
5.5 Spaceball Piston - Conclusion .....................................................................................................55
5. MEng Stage 2 Final Year Report
Experimental Investigation of a Dual Crankshaft Engine
5
6. Future Work........................................................................................................................................56
6.1 Controlled In-Cylinder Pressure Experiment (Solenoid Valve) ...................................................56
6.2 Firing Dual Crankshaft Engine.....................................................................................................56
6.2.1 Introduction ........................................................................................................................56
6.2.2 Engine Development...........................................................................................................56
6.2.3 Test Bed Development........................................................................................................58
6.3 Future Work Conclusion .............................................................................................................60
7. Conclusion...........................................................................................................................................61
8. Bibliography ........................................................................................................................................62
6. MEng Stage 2 Final Year Report
Experimental Investigation of a Dual Crankshaft Engine
6
1. LITERATURE REVIEW
1.1 Previous Work
An investigation into the dual crank engine has been carried out by Jamie Thom in 2012 initially. Through
the utilisation of simulation and data analysis software it has been proven that a twin crank engine offers
more power and thermal efficiency in comparison to a conventional single crank engine.
The simulations identified a reduction in the piston’s side forces caused by the reactive forces from the
connection rod. This reduction leads to a decrease in friction amplitude between the piston and the bore.
However anomalies where identified within the simulation of the side forces for the dual crank engine at
BDC.
Figure 2 - Piston Side Force (red) vs. Piston Position (blue) - Single Crank Engine [2]
Figure 3 - Piston Side Force (red) vs. Piston Position (blue) - Dual Crank Engine [2]
7. MEng Stage 2 Final Year Report
Experimental Investigation of a Dual Crankshaft Engine
7
In addition Jamie Thom’s simulations also investigated friction forces at different crankshaft positions. The
findings suggested that small distance differences between the two crankshafts allowed the piston to
move within the cylinder thus affecting piston stability which caused an increase in frictional losses. [2]
In order to improve understanding of the behaviour of this design, Adam Clayton in 2013 designed a dual
crank test rig. The model has been equipped with electric motors which provide speed control and enough
torque to operate the test rig. Furthermore the rig has also been equipped with a load cell to measure side
thrust forces.
Figure 4 – Adam Clayton’s Test Rig Design [3]
As seen in Figure 4 the test rig has been designed to allow crankshaft and connection rod position
adjustments. Thus engine geometry calibrations can be carried out in order to achieve perfect symmetry.
However the experiments carried out have indicated that the dual crank engine’s piston side forces were
significantly higher in comparison to the single crank test. An overlay of multiple cycles confirmed that a
spike in piston forces was just before 270° crank angle. [3]
Further work has been carried out by Ashley Carter in 2015 on the dual crank test rig design. A spring had
been introduced at the top of the cylinder which exerted vertical force on the piston in order to simulate
combustion. A more realistic simulation had been developed as the system was not just motored by the
output but also by the piston. Although some tests were carried out comparing the dual crank to a single
crank configuration which indicated an average of 18% reduction in side thrust forces, the data gathered
were not consistent. The reason for this phenomenon is a mechanical issue with the model’s geometry.
Due to this inconsistency the data collected by Ashley are unsuitable for further analysis. [4]
8. MEng Stage 2 Final Year Report
Experimental Investigation of a Dual Crankshaft Engine
8
Figure 5 - Typical Distribution of the Fuel's Energy in an Internal Combustion Engine
Figure 6 – Mechanical Losses
1.2 Fuel Energy Distribution
An investigation into the fuel’s energy distribution in a typical internal combustion engine identifies the
extent of potential improvements in the thermal efficiency that a dual crankshaft design can create in
comparison to a conventional single crankshaft design. The distribution of the fuel’s energy differs as it
depends on many variables such as the engine’s design feature’s geometry and fuel type. However it can
be assumed that typically 15% of the fuel’s energy is consumed by the mechanical losses of an engine. [5] A
typical distribution of an IC engine can be seen in Figure 5.
Figure 6 reveals that half of the mechanical losses are due to the piston ring assembly, which results to
typically 7% of the fuel’s energy to be consumed by the piston in order to overcome the frictional force
between its rings and the bore. [6] Therefore a significant part of the energy supplied to petrol and diesel
engines is dissipated by the piston ring assembly’s frictional losses. Thus an investigation into methods
which reduce these losses could potentially improve the thermal efficiency of the new generation of IC
engines.
30%
30%
15%
25%
Exhaust
Cylinder Cooling
Mechanical Losses
Brake Power
50%
10%
20%
20%
Piston Ring Assembly
Valve Train
Pumping Losses
Bearing
9. MEng Stage 2 Final Year Report
Experimental Investigation of a Dual Crankshaft Engine
9
1.3 Effect of Crankshaft Offset
The Dual Crankshaft Engine’s geometry features the two crankshafts at an offset from the centreline of the
piston motion. The offset crankshaft design features an extended expansion stroke and a shorter
compression stroke when the crankshaft rotates clockwise and vice versa when it rotates anticlockwise
(Figure 7).
Figure 7 – Piston Crankshaft Configuration with an Offset Geometry [7]
The utilization of this geometry allows a longer intake stroke, which in turn allows increased time for
breathing thus providing higher volumetric efficiency. Also the expansion stroke is longer thus allowing a
more complete combustion due to the extra time it ensures to burn the fuel/air mixture. [7]
However the compression and exhaust strokes are smaller in terms of crank angle. Starting from the
compression the phenomenon mentioned reduces the time the piston moves from BDC to TDC, this
creates more turbulence for better fuel/air mixing and less time for blow by. Furthermore although the
exhaust would benefit from a longer stroke, having a smaller stroke is not a significant compromise, since
generally recycling some of the exhaust gases is anyway required to control NOx emissions. [7]
10. MEng Stage 2 Final Year Report
Experimental Investigation of a Dual Crankshaft Engine
10
1.4 Effect of Crankshaft Offset on Piston Friction Force
While the offset crankshaft has evident advantages in terms of the dynamics of the combustion, it is
important to investigate the effects it has on the piston side thrust forces.
The Musashi Institute of technology have published a report were they modified a single cylinder engine in
order to measure this effect through the utilization of the floating liner technique (Section 2.5.2). Tests
were conducted at various offset distances from the centerline. A data analysis has also been carried out in
order to measure the instantaneous side thrust force and friction force (Figure 8 and 9).
Figure 8 – Piston Side force at each Crankshaft Offset (2000RPM) [8]
Figure 9 – Effect of the Crankshaft Offset on Piston Friction (2000RPM) [8]
11. MEng Stage 2 Final Year Report
Experimental Investigation of a Dual Crankshaft Engine
11
As can be seen in Figure 8 the thrust force decreases during the expansion stroke as the offset becomes
larger, however it increases during the compression stroke. This phenomenon is largely dependent by the
angle of the connection rod at the various offsets.
Figure 9 indicates the frictional force through a complete rotation of the crankshaft and it is clear that by
offsetting the crankshaft 15 mm towards the thrust side, the piston frictional force indeed decreases
during the expansion stroke. During the compression stroke the piston frictional force only slightly
increased near TDC and did not significantly change despite the fact that the piston side force was
increased by more than double. [8]
1.5 Theoretical Performance Comparison between Inline, Offset and Twin
Crankshaft ICE
Computational work has been carried out by Dr Taj Elssir Hassan for the World Congress of Engineers in
2008 in order to identify the theoretical differences in performance between three engine configurations,
the conventional (inline crankshaft), the offset crankshaft and the twin crankshaft engine. The engines
compared had identical cylinder bore, speed, crank arm, piston mass and heat addition. The only variable
between the configurations is the amount of connection rods and the crankshaft offset.
Figure 10 shows the torque comparison between a twin, inline and offset crankshaft layout engines. It can
be seen that the twin crankshaft layout is superior to the other layouts in terms of torque output. It has
been found that this increase in torque is because TDC for a twin crankshaft engine is at 20° ATDC thus
expansion occurs at an advance crank angle. Hence the cylinder pressure is higher in the expansion stroke.
In other words a twin crankshaft engine utilises cylinder pressure more efficiently than the inline
crankshaft engine.
Figure 10 - Torque comparison of a Twin, an Offset and an Inline Crankshaft [22]
12. MEng Stage 2 Final Year Report
Experimental Investigation of a Dual Crankshaft Engine
12
Figure 11 shows how the piston’s side thrust force changes between the three layouts. It can be seen that
the side force in the offset crankshaft design is lower than the inline design. However for the twin
crankshaft design theoretically there are no side forces.
The findings of the computational comparison have shown that the dual crankshaft engine increases toque
hence the efficiency. It has been found that this is due to the elimination of side forces and the in-cylinder
pressure utilisation. In addition it has also been found that the offset crankshaft engine decreases the side
thrust force compared to the conventional inline engine but its torque output is less.
Hence Dr Taj Elssir Hassan computationally verified that the dual crank engine is superior to other engine
design in terms of performance and efficiency. (13) The same conclusion Jamie Thom had derived back in
2012 when he developed the computational simulation comparing a dual and a single crankshaft engine.
1.6 Piston Friction Measurement
In order to develop a high quality piston friction measurement strategy, research has been carried out into
the various methods of quantification of the magnitude of this force.
Studies have shown that the friction between the cylinder and the piston is responsible for up to 15 % of
the losses in an engine’s thermal efficiency. The two most used techniques which measure the friction
forces between the cylinder liner and the piston are the IMEP and the floating liner methods. [9]
Figure 11 – Side thrust force comparison of a Twin, an Offset and an Inline Crankshaft [22]
13. MEng Stage 2 Final Year Report
Experimental Investigation of a Dual Crankshaft Engine
13
1.6.1 Indicated Mean Effective Pressure
IMEP requires very accurate measurements of cylinder pressure, connecting rod force and exact
calculations of inertial forces. [10]
• A grasshopper (V – Shaped) linkage is usually used to transmit connecting rod force [𝐹𝐹𝑐𝑐] data through a
strain gauge bridge.
• In addition for the calculations of the inertial force[𝐹𝐹𝑖𝑖] it is assumed that the connecting rod mass is
distributed.
• The force caused by the pressure cylinder is calculated by a gauge in the cylinder which records in
cylinder pressure [𝑃𝑃𝑔𝑔] values. Then those values are multiplied by the surface area of the piston[𝑎𝑎𝑐𝑐].
𝐹𝐹𝐹𝐹𝐹𝐹𝐹𝐹𝐹𝐹𝐹𝐹𝐹𝐹𝐹𝐹𝐹𝐹𝐹𝐹 𝐹𝐹𝐹𝐹𝐹𝐹𝐹𝐹𝐹𝐹𝐹𝐹 = �𝑃𝑃𝑔𝑔 × 𝑎𝑎𝑐𝑐� − 𝐹𝐹𝑖𝑖 − 𝐹𝐹𝑐𝑐 (1)
Figure 12 – Schematic of the Forces Acting on a Piston [11]
Two additional measurements are required to calculate IMEP, Crank Angle and Engine Speed which are
used to quantify the inertial force and the connecting rod force.
1.6.2 Floating liner to quantify the FMEP
The advantage of the “floating liner” method is that it can directly measure the friction force of the piston
assembly while the engine is operating. It’s also more precise than the IMEP method, however the method
requires a custom engine design [12]
In conventional “floating-liner” friction force measurement systems the liner is fabricated separately from
the cylinder block, which is supported by piezo and pressure transducers. The friction due to the piston
causes a small displacement of the liner in the direction perpendicular to the surface of the piston. This
shift is sensed by the load cell installed between the lower part of the liner.
14. MEng Stage 2 Final Year Report
Experimental Investigation of a Dual Crankshaft Engine
14
Figure 13 – Single Cylinder Engine Equipped with the Floating Liner Piston Friction Measuring Technique [8]
1.6.3 Set up of a piston friction measuring device by the technical university of Munich
For the high-precision measurement of the friction forces between the piston assembly and liner, a gas
balancing device had to be utilized. The strategy incorporates two or four load cells. However when four
load cells are employed the system is more rigid and becomes less sensitive to vibrations. In addition a
radial support is used in order to retain the side forces, which feature a very low axial rigidity and high
radial.
Due to its additional volume caused by the floating components the gas balance device alters the
compression ratio in order to create a smoother combustion which results to more precise measurement.
Figure 14 - Single Cylinder Engine Equipped with the Munich Universities’ Friction Measuring Technique [13]
15. MEng Stage 2 Final Year Report
Experimental Investigation of a Dual Crankshaft Engine
15
1.6.4 Strip Down Method [12]
Friction losses in Figure 15 are measured using the strip-down method. It’s a very popular method due to
its convenient layout. However, because this system doesn’t allow the friction to be measured with respect
to the crank angle, some friction characteristics related with wear cannot be understood.
Figure 15 – FMEP vs Engine Speed [12]
1.7 Experimental Testing
Figure 16 shows this and indicates a percentage increase in frictional losses as the engine speed rises or
power output at a given engine speed is being decreased. It can also be seen that these losses have greater
significance in diesel engines aswell as Figure 16 (b) delineates. [14]
Figure 16 Friction Losses in Automobile Engines a) Petrol Engine (1300 cm3 ), b) Diesel Engine (1500 cm3 ) [14]
16. MEng Stage 2 Final Year Report
Experimental Investigation of a Dual Crankshaft Engine
16
Losses in the piston assembly make the most significant contribution to the overall frictional losses in a
conventional internal combustion engine. Figure 17 shows that the piston assembly frictional losses rise
linearly from just 0.05MPa at 1000RPM to 0.2MPA at 6000RPM. In addition at 1000RPM the piston losses
make up just 20% of the overall mechanical losses, where at 6000RPM they make 50% of the overall
friction losses.
Figure 17 Contributions of the Components,, Automobile Petrol Engine 4 cylinder, 1300 cm 3, OHV, 3 Metal Bearings, Lubricating Oil:SAE30,
Oil Temperature: 90°C [14]
Until the 1980s it had been difficult to determine the contribution of each part experimentally and to
assess quantitatively the roles played by the various components. [14]However, sophisticated
experimental work has been carried out which made it possible to estimate the contributions with
sufficient accuracy. The experimental work was on a single cylinder diesel engine and its cylinder liner was
flexibly supported where the axial force acting on it was directly measured by piezo transducers. The solid
curve in Figure 18 shows one of the results as a function of crank angle where it’s clear that the increase in
engine speed increases friction between the piston and the cylinder. Furthermore as the load was
increased friction increased particularly at the last half of the compression stroke and in the first half of the
expansion stroke. [15]
17. MEng Stage 2 Final Year Report
Experimental Investigation of a Dual Crankshaft Engine
17
Figure 18 Example of Piston Friction Measurement; Diesel Engine 1 Cylinder D -- 0.137m, r=0.0675 m, Engine Speed = lOOO r/min 1 Furuhama's
Experimental Result at Full Load 2 Author's Calculated Result at Full Load 3 Author's Calculated Result, No Pressure at Cylinder [15]
1.8 Various Twin Crank Engine Designs
1.8.1 Arced Connecting Rods
An engine with two crankshafts and two straight connecting rods attached to a piston is impractical for
high engine speeds. This is because a twin crank engine’s crankshaft is not in the centreline as a
conventional single crank engine, but at an offset from the centreline thus the rods need to avoid the
cylinder resulting to a design with a big bore diameter. In order to make this design feasible a large and
heavy piston needs to be utilised thus making it impractical for high speed operation.The same problem
was encountered in U.S. Pat 5,435,232 by Ian R.Hammerton. [16]
Figure 19 – Twin Crankshaft Engine with arked connection rods, R. Hammerton invention [17]
18. MEng Stage 2 Final Year Report
Experimental Investigation of a Dual Crankshaft Engine
18
The arced connection rods were invented in order to counter the problem explained above. This design
allows high speed engine operation as it utilises a smaller bore to stroke ratio. Therefore due to the test
rig’s constrains this connection rod design has been incorporated into the test rig development. [17]
1.8.2 Spaceball Piston (Shark. Neander)
Due to the piston being constrained by two connection rods in a dual crankshaft engine, the design is
provided with relatively high tolerances. These can lead to off-design positions of the piston in its cylinder
bore and unfavourable mechanical effects like scuffing, sticking and higher frictional losses.(10)
Shark Neander is a company located in Germany who specialise in dual crankshaft boat engines who have
invented and introduced a space ball piston design. This invention has resolved these unwanted
phenomena due to the additional degree of freedom of rotational adjustment around the two pins it
provides to the piston. [1] Due to these claims, this piston design has been experimentally investigated on
the test rig designed.
Figure 20 – Neander Spaceball Piston Design for Twin Crankshaft Engine Application [1]
1.8.3 Variable Compression Ratio Dual Crankshaft Engine
A synchronized, dual crankshaft engine uses a phase- shifting device to alter the angular position of one
crankshaft relative to the other crankshaft in order to vary the engines developed compression ratio. Each
crankshaft drives its respective connecting rod which is connected to a piston in an individual cylinder.
Movable exhaust valves are located above the piston whose phase shifted orientation is retarded or
lagging dead centre conditions, whereas movable intake valves are located above the piston that are
leading or advanced in its phase displacement relative to the top or bottom dead centre.
19. MEng Stage 2 Final Year Report
Experimental Investigation of a Dual Crankshaft Engine
19
However the variable compression ratio dual crankshaft engine has not been invented in order to decrease
piston side thrust forces but in order to achieve efficient combustion at all throttle positions and inlet
mixture pressures at all times. This invention is optimum when used in conjunction with forced induction
because of the fact that if the engine is already operating with combustion pressures near the knock limit.
If more power is required, the phase of the crankshaft can change resulting to a lower compression ratio
which will allow the engine to work at higher inlet mixture pressures which in turn will result to a higher
power output. [18]
1.8.4 Contra-Rotating Dual Crankshaft with Dual Gudgeon Pins
The design of a dual crank engine with the utilisation of two gudgeon pins was first mentioned by James
J.Feuling where he explained how the typical arrangement constrained the movement of the piston. The
typical dual crank design requires complex linkages to allow connection of two connecting rods to a single
wrist and achieve the required linear motion. Thus in order to deal with these design defects a dual
gudgeon pin has been invented. It is said that this arrangement provides more linear, balanced, piston
movement and sidewall thrust is reduced. However, very close machining tolerances are required when
Figure 21 - Variable Compression Ratio Dual Crankshaft Engine. H.Berger, Alvin Invention [18]
20. MEng Stage 2 Final Year Report
Experimental Investigation of a Dual Crankshaft Engine
20
the arrangement is being manufactured. This is because the design is sensitive to tolerance “stack up”. Due
to the lack of experimental work of such piston design, it has been chosen for development for further
testing in Project Stage 2. [19]
1.9 Crankshaft Design Optimization to Improve Dynamic Balancing
A crankshaft can be defined as balanced when there is equal distribution of mass around it’s rotating
centerline.
The amount of unbalanced within a rotating body is expressed as the product of the remaining unbalanced
mass and its distance from the centerline. Therefore a general unit for expressing unbalance is g.m.
These forces are centrifugal and they pull the crankshaft towards the bearing causing wear, power loss and
damaging vibrations. The rotating centerline which is defined as the axis about which the rotor would
rotate if not constrained by the bearings should coincide with the geometric centerline which is the
physical centerline in order to achieve a state of balance. [20]
During the balancing process of a crankshaft, the aim is to reduce the uneven mass distribution around the
geometric centerline.
The amplitude of the force created by the unbalances depends on the rotating speed and the amount of
unbalanced. Force generated by the unbalance can be calculated by the formula. [20]
𝐹𝐹 = 𝑚𝑚 × 𝑟𝑟 × 𝜔𝜔2
(2)
𝐹𝐹 = 𝐹𝐹𝐹𝐹𝐹𝐹𝐹𝐹𝐹𝐹
𝑚𝑚 = 𝑈𝑈𝑈𝑈𝑈𝑈𝑈𝑈𝑈𝑈𝑈𝑈𝑈𝑈𝑈𝑈𝑈𝑈 𝑀𝑀𝑀𝑀𝑀𝑀𝑀𝑀
𝑟𝑟 = 𝑅𝑅𝑅𝑅𝑅𝑅𝑅𝑅𝑅𝑅𝑅𝑅 𝑓𝑓𝑓𝑓𝑓𝑓𝑓𝑓 𝐺𝐺𝐺𝐺𝐺𝐺𝐺𝐺𝐺𝐺𝐺𝐺𝐺𝐺𝐺𝐺𝐺𝐺𝐺𝐺𝐺𝐺 𝐶𝐶𝐶𝐶𝐶𝐶𝐶𝐶𝐶𝐶𝐶𝐶𝐶𝐶𝐶𝐶𝐶𝐶𝐶𝐶 𝑜𝑜𝑜𝑜 𝐼𝐼𝐼𝐼𝐼𝐼𝐼𝐼𝐼𝐼𝐼𝐼𝐼𝐼𝐼𝐼𝐼𝐼𝐼𝐼 𝑀𝑀𝑀𝑀𝑀𝑀𝑀𝑀
𝜔𝜔 = 𝑅𝑅𝑅𝑅𝑅𝑅𝑅𝑅𝑅𝑅𝑅𝑅𝑅𝑅𝑅𝑅 𝑆𝑆𝑆𝑆𝑆𝑆𝑆𝑆𝑆𝑆
Figure 22 – Contra Rotating Twin Crankshaft and Gudgeon Pin Internal Combustion Engine [19]
21. MEng Stage 2 Final Year Report
Experimental Investigation of a Dual Crankshaft Engine
21
The unbalanced forces caused by the eccentricities of the rotating mass, can be balanced by adding
counterweights to the crankshaft so that [21]:
𝑀𝑀𝑎𝑎 × 𝑅𝑅𝑎𝑎 × 𝜔𝜔2
= 𝑀𝑀𝑏𝑏 × 𝑅𝑅𝑏𝑏 × 𝜔𝜔2
(3)
𝑀𝑀𝑎𝑎 = 𝑈𝑈𝑈𝑈𝑈𝑈𝑈𝑈𝑈𝑈𝑈𝑈𝑈𝑈𝑈𝑈𝑈𝑈𝑈𝑈 𝑀𝑀𝑀𝑀𝑀𝑀𝑀𝑀
𝑅𝑅𝑎𝑎 = 𝐷𝐷𝐷𝐷𝐷𝐷𝐷𝐷𝐷𝐷𝐷𝐷𝐷𝐷𝐷𝐷 𝑜𝑜𝑜𝑜 𝑚𝑚𝑎𝑎𝑎𝑎𝑎𝑎 𝑀𝑀𝑎𝑎 𝑓𝑓𝑓𝑓𝑓𝑓𝑓𝑓 𝑡𝑡ℎ𝑒𝑒 𝑎𝑎𝑎𝑎𝑎𝑎𝑎𝑎 𝑟𝑟𝑟𝑟𝑟𝑟𝑟𝑟𝑟𝑟𝑟𝑟𝑟𝑟𝑟𝑟
𝑀𝑀𝑏𝑏 = 𝑈𝑈𝑈𝑈𝑈𝑈𝑈𝑈𝑈𝑈𝑈𝑈𝑈𝑈𝑈𝑈𝑈𝑈𝑈𝑈 𝑀𝑀𝑀𝑀𝑀𝑀𝑀𝑀
𝑅𝑅𝑏𝑏 = 𝐷𝐷𝐷𝐷𝐷𝐷𝐷𝐷𝐷𝐷𝐷𝐷𝐷𝐷𝐷𝐷 𝑜𝑜𝑜𝑜 𝑚𝑚𝑚𝑚𝑚𝑚𝑚𝑚 𝑀𝑀𝑎𝑎 𝑓𝑓𝑓𝑓𝑓𝑓𝑓𝑓 𝑡𝑡ℎ𝑒𝑒 𝑎𝑎𝑎𝑎𝑎𝑎𝑎𝑎 𝑟𝑟𝑟𝑟𝑟𝑟𝑟𝑟𝑟𝑟𝑟𝑟𝑟𝑟𝑟𝑟
Figure 23- Crankshaft Balancing [21]
22. MEng Stage 2 Final Year Report
Experimental Investigation of a Dual Crankshaft Engine
22
2. Computational Analysis
2.1 Nomenclature
2.2 Overview
This section details the computational analysis that has been carried out for the various geometries that
the test rig allows to investigate for a single and a dual crankshaft. The results of the simulation have been
utilized to select the most beneficial geometries for the experimentation phase.
The computational analysis has been carried out in Matlab R2015a, the code written can be found in the
second booklet provided.
𝑇𝑇𝑇𝑇𝑇𝑇 = 𝑇𝑇𝑇𝑇𝑇𝑇 𝐷𝐷𝐷𝐷𝐷𝐷𝐷𝐷 𝐶𝐶𝐶𝐶𝐶𝐶𝐶𝐶𝐶𝐶𝐶𝐶
𝐵𝐵𝐵𝐵𝐵𝐵 = 𝐵𝐵𝐵𝐵𝐵𝐵𝐵𝐵𝐵𝐵𝐵𝐵 𝐷𝐷𝐷𝐷𝐷𝐷𝐷𝐷 𝐶𝐶𝐶𝐶𝐶𝐶𝐶𝐶𝐶𝐶𝐶𝐶
𝐹𝐹 = 𝐹𝐹𝐹𝐹𝐹𝐹𝐹𝐹𝐹𝐹 𝑎𝑎𝑎𝑎𝑎𝑎𝑎𝑎𝑎𝑎𝑎𝑎 𝑝𝑝𝑝𝑝𝑝𝑝𝑝𝑝𝑝𝑝𝑝𝑝𝑝𝑝𝑝𝑝𝑝𝑝𝑝𝑝𝑝𝑝𝑝𝑝𝑝𝑝𝑝𝑝𝑝𝑝 𝑜𝑜𝑜𝑜 𝑡𝑡ℎ𝑒𝑒 𝑝𝑝𝑝𝑝𝑝𝑝𝑝𝑝𝑝𝑝𝑛𝑛′
𝑠𝑠 𝑠𝑠𝑠𝑠𝑠𝑠𝑠𝑠𝑠𝑠𝑠𝑠𝑠𝑠 (𝑁𝑁)
𝑎𝑎 = 𝐶𝐶𝐶𝐶𝐶𝐶𝐶𝐶𝐶𝐶𝐶𝐶ℎ𝑎𝑎𝑎𝑎𝑎𝑎 𝐴𝐴𝐴𝐴𝐴𝐴𝐴𝐴𝐴𝐴 (𝐷𝐷𝐷𝐷𝐷𝐷)
𝜃𝜃 = 𝐶𝐶𝐶𝐶𝐶𝐶𝐶𝐶𝐶𝐶𝐶𝐶𝐶𝐶𝐶𝐶𝐶𝐶𝐶𝐶 𝑟𝑟𝑟𝑟𝑟𝑟 𝑎𝑎𝑎𝑎𝑎𝑎𝑎𝑎𝑎𝑎 (𝐷𝐷𝐷𝐷𝐷𝐷)
𝑥𝑥0 = 𝐶𝐶𝐶𝐶𝐶𝐶𝐶𝐶𝐶𝐶𝐶𝐶ℎ𝑎𝑎𝑎𝑎𝑎𝑎 𝑂𝑂𝑂𝑂𝑂𝑂𝑂𝑂𝑂𝑂𝑂𝑂 (𝑚𝑚𝑚𝑚)
𝑥𝑥 = 𝑉𝑉𝑉𝑉𝑉𝑉𝑉𝑉𝑉𝑉𝑉𝑉𝑉𝑉 𝐶𝐶𝐶𝐶𝐶𝐶𝐶𝐶𝐶𝐶𝐶𝐶 − 𝐶𝐶𝐶𝐶𝐶𝐶𝐶𝐶𝐶𝐶𝐶𝐶ℎ𝑎𝑎𝑎𝑎𝑎𝑎 𝐵𝐵𝐵𝐵𝐵𝐵𝐵𝐵𝐵𝐵𝐵𝐵𝐵𝐵 𝑂𝑂𝑂𝑂𝑂𝑂𝑂𝑂𝑂𝑂𝑂𝑂 (𝑚𝑚𝑚𝑚)
𝑦𝑦 = 𝑣𝑣𝑣𝑣𝑣𝑣𝑣𝑣𝑣𝑣𝑣𝑣𝑣𝑣𝑣𝑣 𝑑𝑑𝑑𝑑𝑑𝑑𝑑𝑑𝑑𝑑𝑑𝑑𝑐𝑐𝑐𝑐 𝑓𝑓𝑓𝑓𝑓𝑓𝑓𝑓 𝑡𝑡ℎ𝑒𝑒 𝑐𝑐𝑐𝑐𝑐𝑐𝑐𝑐𝑐𝑐𝑐𝑐 𝑜𝑜𝑜𝑜 𝑡𝑡ℎ𝑒𝑒 𝑐𝑐𝑐𝑐𝑐𝑐𝑐𝑐𝑐𝑐𝑐𝑐ℎ𝑎𝑎𝑎𝑎𝑡𝑡′
𝑠𝑠 𝑏𝑏𝑏𝑏𝑏𝑏𝑏𝑏𝑏𝑏𝑏𝑏𝑏𝑏 𝑎𝑎𝑎𝑎𝑎𝑎 𝑡𝑡ℎ𝑒𝑒 𝑡𝑡𝑡𝑡𝑡𝑡 𝑜𝑜𝑜𝑜 𝑡𝑡ℎ𝑒𝑒 𝑝𝑝𝑝𝑝𝑝𝑝𝑝𝑝𝑝𝑝𝑛𝑛′
𝑠𝑠 𝑠𝑠𝑠𝑠𝑠𝑠𝑠𝑠𝑠𝑠𝑠𝑠𝑠𝑠
𝑅𝑅𝑅𝑅 = 𝑉𝑉𝑉𝑉𝑉𝑉𝑉𝑉𝑉𝑉𝑉𝑉𝑉𝑉𝑉𝑉 𝑅𝑅𝑅𝑅𝑅𝑅𝑅𝑅𝑅𝑅𝑅𝑅𝑅𝑅𝑅𝑅 𝐹𝐹𝐹𝐹𝐹𝐹𝐹𝐹𝐹𝐹
𝑅𝑅𝑅𝑅 = 𝑆𝑆𝑆𝑆𝑆𝑆𝑆𝑆 𝑇𝑇ℎ𝑟𝑟𝑟𝑟𝑟𝑟𝑟𝑟 𝐹𝐹𝐹𝐹𝐹𝐹𝐹𝐹𝐹𝐹
𝑃𝑃𝑎𝑎𝑎𝑎𝑎𝑎 = 𝐴𝐴𝐴𝐴𝐴𝐴𝐴𝐴𝐴𝐴𝐴𝐴ℎ𝑒𝑒𝑟𝑟𝑖𝑖𝑖𝑖 𝑃𝑃𝑃𝑃𝑃𝑃𝑃𝑃𝑃𝑃𝑃𝑃𝑃𝑃𝑃𝑃
𝑉𝑉𝐶𝐶𝐶𝐶−𝑃𝑃𝑃𝑃 = 𝐼𝐼𝐼𝐼 𝑐𝑐𝑐𝑐𝑐𝑐𝑐𝑐𝑐𝑐𝑐𝑐𝑐𝑐𝑐𝑐 𝑣𝑣𝑣𝑣𝑣𝑣𝑣𝑣𝑣𝑣𝑣𝑣
𝑉𝑉𝐶𝐶𝐶𝐶−𝐵𝐵𝐵𝐵𝐵𝐵 = 𝐼𝐼𝐼𝐼 𝑐𝑐𝑐𝑐𝑐𝑐𝑐𝑐𝑐𝑐𝑐𝑐𝑐𝑐𝑐𝑐 𝑣𝑣𝑣𝑣𝑣𝑣𝑣𝑣𝑣𝑣𝑣𝑣 𝑤𝑤ℎ𝑒𝑒𝑒𝑒 𝑡𝑡ℎ𝑒𝑒 𝑝𝑝𝑝𝑝𝑝𝑝𝑝𝑝𝑝𝑝𝑝𝑝 𝑖𝑖𝑖𝑖 𝑎𝑎𝑎𝑎 𝐵𝐵𝐵𝐵𝐵𝐵
𝑃𝑃 = 𝐼𝐼𝐼𝐼 𝑐𝑐𝑐𝑐𝑐𝑐𝑐𝑐𝑐𝑐𝑐𝑐𝑐𝑐𝑐𝑐 𝑅𝑅𝑅𝑅𝑅𝑅𝑅𝑅𝑅𝑅𝑅𝑅𝑅𝑅𝑅𝑅 𝑃𝑃𝑃𝑃𝑃𝑃𝑃𝑃𝑃𝑃𝑃𝑃𝑃𝑃𝑃𝑃
𝑆𝑆𝑆𝑆𝑝𝑝𝑝𝑝𝑝𝑝𝑝𝑝𝑝𝑝𝑝𝑝 = 𝑃𝑃𝑃𝑃𝑃𝑃𝑃𝑃𝑃𝑃𝑛𝑛′
𝑠𝑠 𝑡𝑡𝑡𝑡𝑡𝑡 𝑠𝑠𝑠𝑠𝑠𝑠𝑠𝑠𝑠𝑠𝑠𝑠𝑠𝑠 𝑎𝑎𝑎𝑎𝑎𝑎𝑎𝑎
𝑑𝑑 = 𝑃𝑃𝑃𝑃𝑃𝑃𝑃𝑃𝑃𝑃𝑛𝑛′
𝑠𝑠 𝑑𝑑𝑑𝑑𝑑𝑑𝑑𝑑𝑑𝑑𝑑𝑑𝑑𝑑𝑑𝑑
𝐹𝐹𝐹𝐹 = 𝐹𝐹𝐹𝐹𝐹𝐹𝐹𝐹𝐹𝐹 𝑎𝑎𝑎𝑎𝑎𝑎𝑎𝑎𝑎𝑎𝑎𝑎 𝑝𝑝𝑝𝑝𝑝𝑝𝑝𝑝𝑝𝑝𝑝𝑝𝑝𝑝𝑝𝑝𝑝𝑝𝑝𝑝𝑝𝑝𝑝𝑝𝑝𝑝 𝑜𝑜𝑜𝑜 𝑡𝑡ℎ𝑒𝑒 𝑝𝑝𝑝𝑝𝑝𝑝𝑝𝑝𝑝𝑝𝑝𝑝 𝑑𝑑𝑑𝑑𝑑𝑑 𝑡𝑡𝑡𝑡 𝑡𝑡ℎ𝑒𝑒 𝑖𝑖𝑖𝑖 − 𝑐𝑐𝑐𝑐𝑐𝑐𝑐𝑐𝑐𝑐𝑐𝑐𝑐𝑐𝑐𝑐 𝑝𝑝𝑝𝑝𝑝𝑝𝑝𝑝𝑝𝑝𝑝𝑝𝑝𝑝𝑝𝑝
23. MEng Stage 2 Final Year Report
Experimental Investigation of a Dual Crankshaft Engine
23
2.3 Computational Analysis for the Single Connection-rod Experiment of the Test Rig
Due to the changes of the test rig’s geometry a simulation had to be carried out in order to predict the
expected characteristics of the experiment.
A computational analysis has been carried out to predict the magnitude of the side thrust force acting on
the inner surface of the bore in respect to the in-cylinder pressure when the test rig is operating on a single
connection rod.(Fx)
The offset of the crankshaft as mentioned previously is variable on the current dual crankshaft design with
a range from 75mm - 105mm. However by varying the Crankshaft offset subsequentelly the test rig’s
geometry changes thus analysis was carried out for each case in crankshaft offset intervals of 1mm.
Figure 24 indigates the basic geometry of the rig. The crankshaft offset (x) which varies from 75mm to
105mm, the conrod’s length from the engines centreline to the centre of the big end bearing which is
245mm and the distance from the crankshaft bearing to the big end bearing (r) which can be set at 30mm,
40mm and 50mm.
In order to calculate the resolving forces from the in cylinder pressure initially the conrod angle(𝜃𝜃) has to
be obtained. However (𝜃𝜃) depends on the varying distance between the centreline and the bearing which
connects the conrod to the crankshaft(x). Thus equation(4) has been utilised to identify distance (x) at each
crank angle in intervals of 1° and then substituded in equation(5) to find the angle (𝜃𝜃).
𝑥𝑥(𝑖𝑖) = 𝑥𝑥0 + sin(𝑎𝑎(𝑖𝑖)) × 45 (4)
𝜃𝜃(𝑖𝑖) = 𝑠𝑠𝑠𝑠𝑠𝑠−1
�
𝑥𝑥(𝑖𝑖)
245
� (5)
Figure 24 – Test Rig’s Geometry
24. MEng Stage 2 Final Year Report
Experimental Investigation of a Dual Crankshaft Engine
24
Furthermore Newton’s 3rd
Law states that the vertical reaction force (Ry) is equal to the force caused by
the expanding gasesequation (6). Thus it is substituded in equation (7) together with the conrod angle(𝜃𝜃)
in order to predict the side thrust force.
𝑅𝑅𝑅𝑅(𝑖𝑖) = 𝐹𝐹 (6)
𝑅𝑅𝑅𝑅(𝑖𝑖) = tan(𝜃𝜃(𝑖𝑖)) × 𝑅𝑅𝑅𝑅(𝑖𝑖) (7)
The investigation has been broken down into two sections, the first predicts the side thrust force taking
into account just the friction force and the second section considers the pressure for the prediction of the
side thrust force. If the investigation intended to measure all variables together it would have been
detrimental to the analysis as it would be difficult to identify the magnitude of each effect.
Figure 25 – Portion of the Force Created by the In-Cylinder Pressure Translated Into Side Thrust Force over a Two Stroke Cycle
Figure 25 indicates the relation of the side force in respect to the force acting perpendicular to the piston’s
top surface. The computational simulation that has been carried out is for the test rig when running on one
connection rod.
It can be seen from Figure 25, that the larger the crankshaft’s positional offset is, the higher the side force
is for the single crankshaft configuration. This phenomenon is due to the connection rod being at a larger
angle(𝜃𝜃) at all crank angles.
However the behaviour of the curves along the various crankshaft angles is identical due to the rest of the
charasteristics of the geometry not changing along with the offset. This is due to the radial distance of the
big end bearing staying constant even though the offset is changed. In case of a variation it would have
significantely altered the behavour of the side thrust force.
0
0.2
0.4
0.6
0.8
1
1.2
1.4
1.6
-180
-164
-148
-132
-116
-100
-84
-68
-52
-36
-20
-4
12
28
44
60
76
92
108
124
140
156
172
Rx/F
Crank Angle (Deg)
75mm Crankshaft Offset
90mm Crankshaft Offset
105mm Crankshaft Offset
TDC
BDC
Represents the
Piston’s Position
25. MEng Stage 2 Final Year Report
Experimental Investigation of a Dual Crankshaft Engine
25
Within Figure 25 there is a line indication the piston’s position. Thus it can be identified that the lowest
side thrust force is during compression just before TDC due to the connection rod having a small angle(𝜃𝜃).
Hence the largest side thrust force is experience just before BDC during expansion due to the connection
rod angle(𝜃𝜃) being the largest.
2.4 Liner-Piston Friction and Side Thrust Force Relation
2.4.1 Single Crankshaft Test
In order to conduct the simulation considering just the friction force, a strain gauge had to be used in order
to aquire the magnitude of it. The strain gauge has been connected to one of the gudgeon pins and
elongated until the piston started moving to simulate a single connection rod effect. Due to the
inconsistency of the data a rough value had to be utilised of 100N due to the convinience of visualisation in
regards to the magnitude of the friction force translated into the side thrust force.
Figure 26 – Side Thrust Force at Crankshaft Offsets 75-105mm over a Two Stroke Cycle- Single Connection Rod
The relation between the friction force and the side thrust force has been linked through substituding in
equation(3), variable F with 100N and thus attain from equation(4) the side thrust force. Initially the graph
for the side thrust force, took into account the direction of the vector of the friction force which changes
180° at TDC and BDC, which is vital for the accuracy of the simulation when the two sections are combined
together. However in order to visualise the effect of the friction force on the side thrust force, the vector of
the friction force has been kept positive for this section of the analysis.
Due to the initial testing of the test rig being at r=30mm it has been decided to conduct this investigation
at also 30mm big end bearing radial distance. Hence a comparison of the computational simulation and
experimenta testing data can be conducted and the simulation can also be assessed in regards of accuracy.
26. MEng Stage 2 Final Year Report
Experimental Investigation of a Dual Crankshaft Engine
26
The realistic side thrust force graph can be found on the top right of Figure 26 and the side thrust force
magnitude is represented by the main graph. It can be seen that the side thrust force at 105 mm is up to
65N which is 65% of the friction force chosen of 100N. Taking into account however that the direction of
the side thrust force changes and the direction of the force produced by the in-cylinder pressure remains
the same when the two section’s are combined together, the side thrust force will in conjustion increase at
piston upstrokes and decrease in downstrokes.
2.4.2 Dual Crankshaft Test
For the dual crankshaft simulation theoretically the friction between the piston and the surface of the bore
is caused only by the force created by the piston rings as they are compressed by the bore. Thus as Dr Taj
Elssir Hassan has also pointed out in the “Theoretical Performance Comparison between Inline, Offset and
Twin Crankshaft ICE” [22] due to the geometry of the dual crankshaft engine the side thrust force is
eliminated for a perfectly manufactured dual crankshaft engine.
27. MEng Stage 2 Final Year Report
Experimental Investigation of a Dual Crankshaft Engine
27
2.5 In-Cylinder Pressure and Side Thrust Force Relation – Single & Dual
Crnakshaft Tests
In this section of the simulation the in cylinder pressure behaviour along different crank angles, is
combined with the relationship of the force acting on the piston and the side force. The outcome is the
predicted side force at each crank position in intervals of 1mm for an air sealed chamber where the piston
is motored assuming pressure at BDC is atm.
Equation(8) enables the acquacision of (y) at the various crankshaft angles. This parameter represents the
variable vertical distance between the top surface of the piston and the main crankshaft bearing.
𝑦𝑦(𝑖𝑖) = cos(𝜃𝜃(𝑖𝑖)) × 245 + cos(𝛼𝛼(𝑖𝑖)) × 45 (8)
The vertical distance from the cylinder head to the main crankshaft bearing is 295mm, thus by subtracting
this distance with parameter (y) , the variable vertical distance between the piston’s top surface and the
cylinder head is attained. Therefore through equiation(10) the variable in cylinder volume in intervals of 1°
crank angle is aquired by multiplying that height with the cross sectional area of the bore(equation (9)).
𝑆𝑆𝑆𝑆𝑝𝑝𝑝𝑝𝑝𝑝𝑝𝑝𝑝𝑝𝑝𝑝 = 𝜋𝜋 ×
𝑑𝑑2
4
(9)
𝑉𝑉𝐶𝐶𝐶𝐶−𝑃𝑃𝑃𝑃(𝑖𝑖) = (295 − 𝑦𝑦(𝑖𝑖)) × 𝑆𝑆𝑆𝑆𝑝𝑝𝑝𝑝𝑝𝑝𝑝𝑝𝑝𝑝𝑝𝑝 (10)
As the crankshaft offset increases the compression ratio of the test rig is decreased. This phenomenon occurs
because the distance from the cylinder head to the top surface of the piston increases due to the increase of angle(𝜃𝜃)
which is related to the crankshaft offset. The relationship can be seen in equations (4) and (5).
Nevertheless, with the variable in cylinder volume(𝑉𝑉𝐶𝐶𝐶𝐶−𝑃𝑃𝑃𝑃) now found, the variable relative in-cylinder pressure(𝑃𝑃)
can in turn be attained. It is assumed the the pressure within the cylinder is atmospheric, thus Patm is multiplied by
the instantenious compression ratio to aquire the instantenious in cylinder pressure at crankshaft angle intervals of 1°
which can be seen in equation(11)
Furthermore the approach to calculate the compression ratio used is through dividing the highest in-cylinder
volume(𝑉𝑉𝐶𝐶𝐶𝐶−𝐵𝐵𝐵𝐵𝐵𝐵 ) of each geometry with the instantenious in cylinder volume(𝑉𝑉𝐶𝐶𝐶𝐶−𝑃𝑃𝑃𝑃(𝑖𝑖)).
𝑃𝑃(𝑖𝑖) =
𝑃𝑃𝑎𝑎𝑎𝑎𝑎𝑎
(𝑉𝑉𝐶𝐶𝐶𝐶−𝑃𝑃𝑃𝑃(𝑖𝑖)/𝑉𝑉𝐶𝐶𝐶𝐶−𝐵𝐵𝐵𝐵𝐵𝐵 )
− 𝑃𝑃𝑎𝑎𝑎𝑎𝑎𝑎 (11)
With the instantenious pressure aquired, when multiplied by the cross sectional area of the bore, it is
possible to attain the instantenious force acting perpendiculour on the surface of the piston.equation(12)
𝐹𝐹𝐹𝐹(𝑖𝑖) = 𝑃𝑃(𝑖𝑖) × 𝑆𝑆𝑆𝑆𝑝𝑝𝑝𝑝𝑝𝑝𝑝𝑝𝑝𝑝𝑝𝑝 (12)
In order to calculate the instantenious side thrust force, the instantenious perpendicular force on the
piston’s surface found in equation(13) is multipled by the instantenious tan(𝜃𝜃(𝑖𝑖)) of the conrod.
𝑆𝑆𝑆𝑆(𝑖𝑖) = 𝐹𝐹𝐹𝐹(𝑖𝑖) ∗ tan(𝜃𝜃(𝑖𝑖)) (13)
2.5.1 Simulation Data Analysis Single Crankshaft Test
The aim of the simulation has been to predict the forces the test rig will be exposed to in order to assess
the risks involved prior to the conduction of the testing.
28. MEng Stage 2 Final Year Report
Experimental Investigation of a Dual Crankshaft Engine
28
Because the dual crankshaft test rig’s development has been based on an existing test rig which has been
redesigned, some components had to be recycled such as the load cell(strain gauge) which can only be
exposed to up to 250N. Furthermore the electric motor’s torque limitations are also to be considered for
the testing preparation which is 10Nm at the crankshaft. Thus an analysis to predict the expected side
thrust force and in-cylinder pressured during the various test rig geometries and conditions had to be
carried out in order to choose the right conditions for the experimentations.
A 3D analysis of the data has been adopted in order to visualise the dynamic characteristics and further
implement the conditions which would deliver consistently data while increasing the reliability and
durability of the hardware during the tests.
Figure 27 – In-cylinder Pressure for Different Crankshaft over a Two Stroke Cycle- Single Connection Rod
([r=30mm] crankshaft radius)
Figure 27 represents the expected in-cylinder pressure over a motored cycle for crankshaft offsets from
75mm to 105mm. Retrieving these results enables the calculation of the resultant force on the piston
within the cycle at all crankangles. Figure 27 that as the crankshaft offset increases the In-cylinder
pressure reduces within the cycle. This phenomenon is due to the compression ratio reduction which is
caused by the top and bottom dead centre of the piston to increase in terms of distance for the cylinder
head as crankshaft offset increases.
29. MEng Stage 2 Final Year Report
Experimental Investigation of a Dual Crankshaft Engine
29
Figure 28 – Piston Thrust Force for Different Crankshaft Offsets Over a Two Stroke Cycle- Single Connection Rod
(30mm crankshaft radius)
Figure 28 represent the predicted force caused by the in-cylinder pressure while the rig is motored over a
two stroke cycle at crankshaft offsets from 75mm to 105mm, has also been produced. The findings of this
part of the investigation have been primarly produced to identify the peak forces at different crankshaft
offsets the test rig can experience in order to assess the structural rigitidy required for the component’s
development.
Figure 28 indicates the peak force acting on the piston created by the in-cylinder pressure is 2500N at
75mm offset and 2000N at 105mm offset. The data produced have been important for the cylinder head
assembly design. Knowing the force on the piston’s top surface, translates to also the force on the cylinder
head as it has the same area. Thus the cylinder head has been designed to withstand the forces that it
experiences at this geometry.
Furthemore through the utilisation of the data gathered from Figure 28 it has been possible to estimate
the side thrust force under the conditions delinated which can be observed in Figure 29.
The analysis for the side thrust force has contributed important information for the Test Description
Development. As mentioned previously the load cell which will recognise the side force is the one utilised
on the previous test rig design, model OEP PS2126 which has a capacity of 250N. Given that the peak side
30. MEng Stage 2 Final Year Report
Experimental Investigation of a Dual Crankshaft Engine
30
thrust force can be up to 330N at 105mm offset when operating under theoretical conditions were blow-
by or gasket air escape does not occur, the magnitude of the side thrust force when running at maximum
80RPM is expected to be of the order of the maximum load of the strain gauge.
Figure 29 - Piston side thrust force for different crankshaft offsets over a Two Stroke Cycle- Single Connection Rod
(30mm crankshaft radius)
Furthermore it can be observed that even though the pressure is smaller at larger offsets as can be seen
in Figure 29, the peak side thrust force over the different offsets in Figure 28 is relatively linear along the
crankshaft offsets. This is because the angle of the conrod increases at larger offsets thus increasing the
portion of the force translated into side thrust force (Figure 25).
31. MEng Stage 2 Final Year Report
Experimental Investigation of a Dual Crankshaft Engine
31
2.6 Combining Pressure and Friction Effects for the Single Crankshaft Engine
Test
In order to attain the side thrust force while considering both the effects of the friction created by the
piston rings and the in cylinder pressure the results from equation(12) and the measured friction force
were united together.
𝐹𝐹 = 𝑆𝑆𝑆𝑆 + 𝐹𝐹𝐹𝐹𝐹𝐹𝐹𝐹𝐹𝐹𝐹𝐹𝐹𝐹𝐹𝐹 𝐹𝐹𝐹𝐹𝐹𝐹𝐹𝐹𝐹𝐹 (14)
As mentioned previously 100N is used for the friction force and SF is attained from equation(9). The result
of F is then substituted in equation(6) and then to equation(7) to acquire the side thrust force. The friction
force utilized however considered the direction of the vector, thus the negative values pre 50° of crank
angle. Negative values represent side thrust force, from the center of the cylinder towards the crankshaft’s
location.
Figure 30 Piston side thrust force for different crankshaft offsets over a Two Stroke Cycle- Single Connection Rod
(30mm crankshaft radius)
The test rig would be operating at speeds under 100RPM, if blowby is taken into account, potentially all
crankshaft offsets can be exploited. As can be seen in Figure 30the full 250N capacity of the load cell can
be exploited with the geometry that has been selected for the Dual Crankshaft Test Rig(5.4 Test
Description).
Conclusion
Other than the pressure and side thrust force expected magnitudes of the experiment, the computational
simulation developed has also provided important data regarding the stresses the components are
exposed to during the test rig experimentations. Thus the behaviour of the side thrust force could be
compared to the theoretical model. Furthermore knowing the stresses the test rig’s components could be
developed to withstand the expected peak forces they would potentially be exposed to in the real test.
32. MEng Stage 2 Final Year Report
Experimental Investigation of a Dual Crankshaft Engine
32
3. TEST RIG DESIGN
3.1 Overview
As mentioned previously the aim of the investigation has been to examine the impact a dual crankshaft
design has on the side thrust force’s magnitude. Thus a series of tests had to be carried out on an engine
with one and then two crankshafts while attaining information of the side thrust force in respect to the
crank angle. The method that has been chosen to attain data regarding the side force is through a load cell
which is linked with to the combustion chamber. The load cell would then translate strain measurements
into force measurements. Furthermore, data regarding the crank position are also attained through the in-
build electric motor encoders.
In addition a National Instrument kit has been used to achieve an interface between the computer, the
load cell and the electric motors. Through the utilization of LabVIEW various operating aspects of the
electric motors can be controlled thus providing the user the ability to investigate different operating
speeds while choosing his preferred number of cycles and acceleration. While the test rig is in operation
data are also gathered through the electric motor’s encoder and the load cell providing the user with data
regarding motor torque, crank position and the magnitude of the side thrust force every 5 milliseconds.
Figure 31 – Test Rig Operation Strategy
Power Supply
NI cRIO 9024
NI 9201 NI 9514
Temna Digital
Control DC
Power Supply
Computer
Load Cell Kollmorgen
AKD Drive
Kollmorgen
Servo Motor
Combustion
Chamber
Crankshafts and
Connection RodsPiston
33. MEng Stage 2 Final Year Report
Experimental Investigation of a Dual Crankshaft Engine
33
3.2 Piston Drive Operation Strategy
The components highlighted with light grey in Figure 32 are the components responsible for the drive of
the piston assembly. They include the electric motors, gears, crankshaft, connection rods and piston.
The test rigs’ crankshafts movement is constrained by gears which synchronize them and those gears are
linked to electric motors which provide the torque to rotate them. The Electric motors are connected to a
NI 9514 1 Axis Servo Drive Module which is slotted onto the cRIO-9113 4 Slot Chassis. The cRIO-9024 Real
Time Controller interacts with a computer through LabVIEW. Through software developed in LabVIEW by
Ed Windward it is possible to control the electric motors in terms of speed, acceleration and number of
revolutions. Furthermore it also logs data regarding position and torque every 5 milliseconds.
Figure 32 - Side Thrust Force Measurement Strategy
3.3 Instantaneous Side Thrust Force Calculating Strategy
Within Figure 32 the components that are highlighted in dark grey are allowed to move in the direction of
the side thrust forces .These components are fixed together and create the combustion chamber of the
test rig and also includes the load cell. The chamber is allowed to float in the directions of the side thrust
force, however it is constrained by path-restrictors on the top plate, thus restricting into moving in other
directions.
As previously mentioned the chamber is connected to the load cell, which is then also linked to a rigid
beam. The Load Cell (Section 4.5.2) which is a stain gauge type, translates then the elongation into voltage
as it is connected to a 12V DC 0.4A Power Supply. A NI9201 8-Channel +/- 10V Analogue Module receives
the voltage which is slotted in a cRIO-9113 4 Slot Chassis which is then connected to the computer. The
computer software developed translates the signal received to the actual side thrust force.
34. MEng Stage 2 Final Year Report
Experimental Investigation of a Dual Crankshaft Engine
34
Although measurements could have been more precise if only the bore was allowed to move, it has been
decided that it would be better if the whole chamber components moved along with the bore in order to
preserve compression within the chamber. The drawbacks of the utilized design have been derived to be
significantly less as the calibration of the results to take into account the losses is marginally more precise.
3.4 Test Rigs’ Component
3.4.1 Piston
3.4.1.1 Design
Because the test rig allows movement of the whole chamber there is a need to decrease constrains within
the combustion chamber. Therefore numerous techniques had to be introduced to the piston assembly in
order to achieve a suitable design.
3.4.1.2 Gudgeon Pin
Initially a dual gudgeon pin geometry has been implemented for the piston design. This specific type of
geometry proved to decrease complexity as mentioned previously in James J.Feuling report “Contra-
Rotating Twin Crankshaft and Gudgeon Pin Internal Combustion Engine” as it doesn’t require complex
linkages to connect the connection rods to a single pin.
3.4.1.3 Piston-Bore Clearances
In addition it was mentioned by Jamie Thom that the radial clearance of the rings inside their grooves must
be sufficient that the play in the gears does not allow the thrust to be transferred to the second crankshaft
via the second con-rod via the cylinder wall. Furthermore a sufficient gap had to be created in order to
avoid sticking within the cylinder. Thus the radial clearance inside the groove has been design to be 0.2
mm.
Figure 33 – Conventional Dual Gudgeon Pin Piston
3.4.1.4 Piston Rings
For the piston ring cavity design, although a one piston ring design would have made the test rig less
constrained, a dual piston ring design was selected in order to achieve more stability in the axial motion of
the piston and also decrease the amount of blow-by the chamber experiences during operation.
The Selection of the piston ring geometry was constrained by the Loughborough machine shop capabilities.
A distance of 3mm was the smallest available grooving height achievable for the piston. However through
the selection of these specifications there has been a reduction of the overall price of the piston assembly
as only the piston ring has been required to be attained from an outside source.
35. MEng Stage 2 Final Year Report
Experimental Investigation of a Dual Crankshaft Engine
35
It has been decided however that a coating would have been unnecessary as a combustion will not be
taking place thus there will not be enough heat transfer inside the combustion chamber for it to be
effective.
3.4.1.5 Connection Rod Clearance
Furthermore the gap inside the piston where the gudgeon pin links to the small end of the connection rod
had to be design to accommodate the movement of the connection rod within the piston caused by the
rotation of the crankshaft.
3.4.1.6 Spaceball Piston Design(Figure 34)
After the tests have been carried out with the conventional shaped piston, the piston has been redesigned
into a spaceball shape. The purpous for the redesign has been to investigate the claims Shark Neander have
made regarding this shape. This shape is said to decrease sticking and scuffing as previously descussed in
section 2.7.2.
Figure 34 - Spaceball Dual Gudgeon Pin Piston
3.4.2 Cylinder Head
As mentioned previously it has been very important during the development of the test rig to create a
combustion chamber which would retain the pressure within the chamber. Thus various techniques have
been implemented into the design of the cylinder head to achieve the requirements. The main feature
utilized to ensure an air-tight chamber is the bore slotting into the cylinder head as it was not possible to
use the conventional method with a gaskets.
Furthermore the head has only one valve instead of two, where a 3 way solenoid valve is tightened on.
Thus further decreasing potential pressure escape from the chamber hence increasing data consistency
and precision.
It is also important to note that the bore is constrained onto the head by two bolts opposite each other on
the cylinder head which grab the bore. Thus eliminating unnecessary holes on the bore which could assist
air escape from the chamber.
3.4.3 Bore
During the redesign although a lubrication system was something that would be beneficial for the
investigation, it was eventually found impractical to introduce to the chamber. In order to increase the
reliability of the test rig it was decided instead of trying to deal with the friction by adding a mechanical
lubrication system, it would be more beneficial to reduce the friction by introducing through specialized
machining a very fine bore surface and also prior to each test a lubricant is manually added on the inside
surface of the bore.
36. MEng Stage 2 Final Year Report
Experimental Investigation of a Dual Crankshaft Engine
36
A cylinder which is suitable for the test rig’s available space has been attained from Westwood Cylinder’s.
The cylinder provided had a 74mm bored diameter with a rough finish. Thus the cylinder was shipped out
to Grinding Solutions in Leicester for machining. The finish chosen for the cylinder is ±5nm roughness and
75mm bore diameter thus ensuring smooth operation and further reducing potential blow-by.
Figure 35 - Cylinder Head and Bore
3.4.4 Solenoid Valve
The test rig is also equipped with a 3/2 solenoid valve [Figure 17-4.] which can be utilized to direct the
airflow in and out of the cylinder, thus providing the user with the ability to simulate realistic in-cylinder
pressure characteristics across a cycle. The solenoid valve equipped on the test rig is also known as a 2-
Way valve (Figure 36), with 3 air ports. For the test rig application Port 1 is utilized as the inlet manifold
which is connected to a constant pressurized air supply, port 3 is connected to an exhaust manifold and
port 2 is where enters and escapes form the chamber. The diameter of the ports chosen is 3/8 inches≈9.5
mm which is the largest options, thus providing the highest volumetric efficiency possible.
Table 1 - Omega 3/2 valve description
Omega Solenoid Valve
Low Power Consumption with 24 Vdc Operation
High Flow Rate
Manual Overrides
Operates Under Pressure of up to 8 Bar (116 psi)
Temperature Range of -10 to 50°C (14 to 122°F)
37. MEng Stage 2 Final Year Report
Experimental Investigation of a Dual Crankshaft Engine
37
Figure 36 – Omega 3/2 Solenoid Valve Drawing
Figure 37 - Omega 3/2 Solenoid Valve
3.4.5 Crankshafts
The crankshafts that are used on the test rig were developed by Jamie Thom during the first test rig design
in 2013. There are four crankshafts overall, two crankshafts at each offset in order to achieve better overall
stability while the test rig is operating. However the crankshafts are not balanced hence the test rig is
unable to work at high operating speeds due to excess vibration.
Also the crankshafts have been designed in a way that there distance from the centerline of the piston is
adjustable. They can be positioned anywhere between 75mm and 105mm offset thus allowing the
operator to examine various engine geometries.
Furthermore the crankshafts also have 3 positions were the big end bearing of the connection rod can be
attached at, 30 mm, 40 mm and 50 mm radius from the main crankshaft bearing.
38. MEng Stage 2 Final Year Report
Experimental Investigation of a Dual Crankshaft Engine
38
Figure 38 – Crankshafts, Gears and Connection Rods Linked Together
3.4.6 Con Rods
The development of the connection rods was constrained by the existing test rig geometry thus numerous
features needed to be implemented to their design for a more effective utilisation of the available space.
The main feature which has been introduced is their arced geometry. The implementation of this
characteristic introduces a longer piston travel for more precise measurements. In addition it provides
more clearance between the connection rod and the bore thus allowing for more crankshaft offsets to be
investigated.
Each connection rod is comprised by four parts assembled together with M5 bolts. Two of those parts are
linked to the two crankshafts and at the same time united by a third part. Then there is finally one more
component which links the other components to the piston’s gudgeon-pin. The piece which is connected
to the piston assembly has been manufactured at a 20° angle thus providing the arced geometry
mentioned previously.
Figure 39 - Connection Rod
39. MEng Stage 2 Final Year Report
Experimental Investigation of a Dual Crankshaft Engine
39
3.4.7 Electric Motor
The motor used in the dual test rig design is a AKM24D-ANBNC-00 Servo Motor and it has been selected by
Jamie Thom during the initial design of the test rig. The main motives for the selection is the suitability with
the NI Hardware, its suitable speed and torque range (Figure 40), it’s rotational adjustability of small
increments and its in-built position encoder with ≅ 8.4 × 10⁶
counts per revolution. Furthermore the
National Instrument kit allows motor speed control, data logging from the motor and rotation count
control, additional parameters that could be required such as data from the side force sensor.
In addition a Compact Rio controller was selected for the setup which allows interface with the computer
allowing user control. The cRio then operates a Servo Drive Interface through a NI 9514 1 Axis Servo Drive
Module which in turn controls the analogue Servo Drive. Furthermore the cRio also receives motor
feedback as mentioned previously.
Figure 40 - AKM24D-ANBNC-00 Servo Motor (Torque vs Speed)
3.4.8 Gears
After the motor there is a 2:1 step gear thus up to 10Nm (figure ?) of continuous torque can be provided to
the Crankshaft assuming no mechanical losses. As can be seen in figure? The motor can operate at an
excess of 5000 RPM however the operating speed of the rig does not surpass the 500 RPM mark dew to
the components not being balanced. Furthemore the torque output of the motors decreases significantly
as the operating speed increases.
3.4.9 Load Cell
The measurement design used on the test rig is a strain gauge type. This device has the ability to measure
both tension and compression. The capacity of the specific strain gauge used has a capacity near the peak
forces thus providing good accuracy and responsiveness. However with a maximum load capacity of 250N
it has a safety factor of 5 as the maximum load that it is exposed to is roughly 50N thus it ensures a
sufficient safety margin from any potential higher than typical forces caused by failures. It is also important
to note that the force measurement device selected by Jamie Thom is sufficiently sensitive to detect the
forces involved.
As mentioned previously the whole combustion chamber is only constrained to move along the direction
of the side forces caused by the piston. The load cell is attached on the chamber and can be compressed in
the direction of the side thrust force. Because the load cell is connected to a 12 V 0.4A DC supply it sends a
voltage signal to the NI9201 8-Channel +/- 10V Analogue Module which is then connected to a computer
40. MEng Stage 2 Final Year Report
Experimental Investigation of a Dual Crankshaft Engine
40
and through a LabView software developed for the test rig is translated into the actual instantaneous force
measurement. This operation is within a loop which occurs every 5 milliseconds
Figure 41 – S- type Load Cell
3.5 Electrical Hardware
3.5.1 Power Supply
The power supply Jamie Thom selected for the servo motor drive and the load cell are products of
RS Components, there specifications can be found in Table 2.
Table 2 – Power Supply Components
Power Supply Specification Part Description
Load Cell +12V/-12V, 400mA, 9.6 Watt OEP PS2126
Servo Motor Drive 24V, 5A, 120W Traco Power TXL 120-24S
3.5.2 Load Cell
The load cell is connected to the OEP PS2126 and NI9201 8-Channel +/- 10V Analogue Module. The module
which is found on the CompactRio Chassis measures voltage between +10V and -10V which is the same as
the inbuilt amplifier signal. The relationship between the output voltage sent by the load cell amplifier and
the Load acted on was found to be y=24.993x by Adam Clayton during the development of the initial
software. The method that has been used is adding a known force on the load cell and dependent on the
voltage signal a relationship between the two is derived. (Figure 42)
The accuracy of this relationship has been further improved for the new set up by setting up a known force
on the strain gauge and dependent on the voltage output by the analogue module it has been calibrated in
the LabView structure by optimizing the Gain and Offset.
41. MEng Stage 2 Final Year Report
Experimental Investigation of a Dual Crankshaft Engine
41
Figure 42- Voltage and Actual Load on the Strain Gauge Corelation
3.5.3 Servo Motor
In LabVIEW a motion axis was created by Jamie Thom to describe the motor properties, to set the initial
control function parameters and the safety Limits. The encoder is configured to suit the 8000 quadrature
counts per revolution that are transmitted to the controller through the servo drive. However axis limits
have not been set due to the character of the rigs rotational operation. The recommended PID control
function values suggested by NI have been used, 50 proportional, 0 integral and 1000 derivative terms.
The motor instructions are carried out through an analogue signal by the cRIO which is sent to the servo
motor drive. The emulated encoder output that is sent to the cRIO controller has been configured to match
the previously set encoder settings on the host computer. Thus the servo motor drive has been set to
operate at 2000 points per revolution.
3.5.4 Test Rig Control Software
LabVIEW was utilized for the Test Rig control program were a program has been created for the operation
and the data extraction. The program is operated by the cRIO instead of the host computer in order to
have control over the servo motor. However in order to extract data the LabVIEW program needs to run on
the host computer.
The data collected from the test rig are combined into an array and then exported into a “shared variable”
acquired from the motor control program. A data acquisition program then reads the data passed to the
“shared variable” which then builds an array of the variables gathered in regards to the time they were
taken and last saves the data as a comma separate variable (CSV) file (Figure 43). Data can also be
extracted from the figure into the user’s preference file type from the Side thrust force graph (Figure 44).
-300
-200
-100
0
100
200
300
-10 -8 -6 -4 -2 0 2 4 6 8 10
Load(N)
Voltage (V)
42. MEng Stage 2 Final Year Report
Experimental Investigation of a Dual Crankshaft Engine
42
Figure 43 - LabVIEW Motor Control and Data Acquisition Main Interface
Figure 44 - LabVIEW Motor Control and Real Time Side thrust Force Graph (Load Cell vs Time)
For the servo motor to operate the motor control program needs to acquire the amount of revolutions, the
revolving speed and the rotational acceleration required to reach the speed which has been indicated.
Experimentations carried out by Jamie Thom have shown that 5 revolutions/s2
was the best acceleration
value for the tests.
The data which are acquired from the motor control program are motor position, speed, torque, load cell
voltage and time. They are gathered inside a while loop which only stops if the straight line move has been
completed or the stopped button is pressed. The input values for the motor speed and number of rotations
to be completed are multiplied by 2 to account for the gear ratio between the motor and crankshafts. The
number of rotations is also multiplied by a negative to set the correct direction of motion for the rig.
43. MEng Stage 2 Final Year Report
Experimental Investigation of a Dual Crankshaft Engine
43
Figure 45 - LabVIEW Block Diagram
44. MEng Stage 2 Final Year Report
Experimental Investigation of a Dual Crankshaft Engine
44
3.5.5 Motor Control and Data Logging Interface
The program and interface for the motor control can be seen on the left side of Figure 43 and Figure 44,
where the user can input the process he chooses the motor will carry out. The interface also includes the
ability to activate the motor and to begin the test or stop it in case of an emergency.
The data logging program and interface can be seen in the right side of Figure 43 and Figure 44. As
mentioned previously the software for this also operates within a while loop and also features a stop
logging button as does the motor control program. Initially an array is shaped the same as the shared
variable where data are inputted in each row in intervals of 5 milliseconds.
The motor speed is transmitted as pulses per revolution and then converted as revolutions per second.
Furthermore the motor speed is then multiplied by 2 in order to translate it into test rig revolutions. For
the side force data as previously mentioned the analogue voltage received acquires a gain of 24.993 in
order to turn it into force. After the processes discussed are finish, they are then input into the final array.
The block diagram for the software can be seen in Figure 45.
3.5.6 Interface Instructions
The motor control can be opened and the motor activated before the data logging but motion should not
be commenced until the logging has started.
The user has the ability to enter the name and location where the file is to be saved to on the main control
screen shown in Figure 43. The user interface also shows displays live information about the data being
measured. The number of rotations completed, rig speed and torque are displayed on rotary counters
whilst the load cell force is displayed on scope.
Data logging begins as soon as the program is in progress, and ends when the stop button is pressed at the
bottom right of the user interface. The logging program should be activated prior to the rig being set into
motion.
45. MEng Stage 2 Final Year Report
Experimental Investigation of a Dual Crankshaft Engine
45
3.6 Test Rig Assembly
The assembly of the test rig can be found in the second booklet provided. Detailed instructions regarding
the assembly, bolts used and torque applied have been delineated in order to assist future work and
prevent any potential damages by students in the future. The assembled test rig can be seen in Figure 46.
Figure 46 - Assembled Test Rig
46. MEng Stage 2 Final Year Report
Experimental Investigation of a Dual Crankshaft Engine
46
4. DUAL CRANKSHAFT ENGINE TESTING
4.1 Overview
This section details the approach taken for the calibration of the system and the description of the testing
carried out. It looks at the problems encountered during this stage and the methods taken to resolve them.
4.2 Calibrating the System
The testing has been carried out at a crankshaft radius of 30mm(Crankshaft bearing to big end bearing) in
order to decrease the load on the electric motors. This decision in turn reduced risk of damaging hardware
as the load within the gears and motor was decreased.
Initially in order to achieve smooth test rig operation beta testing has been conducted. Thus before the
tests began beta testing allowed all hardware to be aliened and all issues regarding geometry to be solved.
4.3 Geometry Calibration
As mentioned previously the crankshaft radius for the tests is 30mm, the offset for both crankshafts is 90
mm as it is the smallest offset possible before the two connection rods encounter each other during the
expansion stroke (Figure 47). The compression ratio the geometry chosen for investigation provides is
𝑟𝑟𝑐𝑐 = 2. A more detailed analysis of this geometry can be found in section Computational Analysis (Pages.
[22-31]).
Figure 47 – Test Rig Crankshaft Motion
4.4 Test Rig Beta Testing Issue
Although the piston has been designed with dual gudgeon pins in order to decrease constrains, while the
test rig is operating the same problem Neander Shark with piston sticking and scuffing [1] encountered in
there dual crankshaft engine design has also arisen within the test rig during the first and second section of
the tests. Especially at low operating speeds the chamber produces excessive vibrations and it is believed
that is due to the gears which synchronize the two crankshafts and the over-constrained design of the
piston.
Thus after the first two sections, the piston geometry has been modified into a spaceball piston in order to
assess the effect of this specific design regarding the sticking and scuffing and the potential decrease in
vibration of the test rig.
47. MEng Stage 2 Final Year Report
Experimental Investigation of a Dual Crankshaft Engine
47
4.5 Test Description
The initial test conducted aims to assess the magnitude of the effect the friction between the piston
assembly and the cylinder liner has on the side thrust force. The second test however investigates the
effect of in-cylinder pressure has on the magnitude of the side thrust force.
Then both tests are conducted again, with a spaceball piston in order to assess the claimed decrease in
sticking and scuffing, Shark Neander claims to have achieved with this piston geometry. This is identified
through the magnitude of the vibration of the test rig and the scattering of the data collected.
Table 3 – Test Description
Operating Speed
20 RPM 40RPM 60 RPM 80RPM
Conventional
Piston
No In-Cylinder pressure
(Friction Examination)
Single Crankshaft
Dual Crankshaft
Seal Chamber (Pressure
Examination 𝑟𝑟𝑐𝑐 = 2)
Single Crankshaft
Dual Crankshaft
Spaceball
Piston
No In-Cylinder pressure
(Friction and Vibration
Examination)
Single Crankshaft
Dual Crankshaft
Seal Chamber (Pressure and
Vibration Examination 𝑟𝑟𝑐𝑐 = 2)
Single Crankshaft
Dual Crankshaft
As can be seen form Table 3the maximum operating speed for the seal chamber test is 40 RPM. This is due
to the torque limitations of the servo motor(Traco Power TXL 120-24S) Adam Clayton has specified for the
test rig which is 10Nm. Although higher RPM is possible , when the test rig is operating as it enters the
compression stroke the speed decreases rapidly and then in turns increases rapidly at the expansion
stroke. This is because during compression the motor has not got sufficient torque to compress the air in
the chamber. Thus blow by takes into effect more significantly, decreasing the pressure within the cylinder
allowing the piston to move to TDC hence the reduction in speed.
48. MEng Stage 2 Final Year Report
Experimental Investigation of a Dual Crankshaft Engine
48
5. Data Analysis
5.1 Analysis Overview
This segment of the report looks at the analysis of the data gathered during the experimental testing of the
dual crankshaft test rig detailed within Table 3. It includes the examination of the tree different test rig
configuration at compares the data gathered when one and two connection rods are utilized.
5.2 Part I – Investigating the effect of the piston friction on the side thrust
force
The first stage of the tests examines the effects on the side thrust force caused by the opposing friction
force to the piston’s movement. The cylinder head for this section was not sealed in order to investigate
the delineated interest. Eight tests in total have been contacted, investigating the two engine
configurations (Single and Dual Crankshaft) at four different operating speeds. For each test the data
regarding the instantaneous side thrust force and motor torque output, are in time intervals of 5
milliseconds.
As can be seen in Figure 48, Figure 49 and Figure 50 data regarding the side thrust force and motor torque
gathered were analysed comparing the two designs at 20, 40 and 60 RPM. As the speed of the rig is
increased the data gathered per revolution are reduced as the factor for data gathering is a time interval as
mentioned previously (5ms). Thus the number of averaged points selected has been reduces as engine
speed is increases.
Figure 48 - 20RPM/ No In-Cylinder Pressure
0
1
2
3
4
5
6
7
8
9
10
11
12
13
14
-7
-6
-5
-4
-3
-2
-1
0
1
2
3
4
5
6
7
MotorTorque(Nm)
LoadCell(N)
50 per. Mov. Avg. (Side Thrust Force - Single Crankshaft)
50 per. Mov. Avg. (Side Thrust Force - Dual Crank)
50 per. Mov. Avg. (Motor Torque - Single Crankshaft)
50 per. Mov. Avg. (Motor Torque - Dual Crankshaft)
TDCBDC BDC TDC
49. MEng Stage 2 Final Year Report
Experimental Investigation of a Dual Crankshaft Engine
49
Figure 49 - 40RPM/ No In-Cylinder Pressure
It can be seen from Figure 48, Figure 49 and Figure 50 that the area under the side thrust force data
decreases as the engine speed increases. This phenomenon is encountered because when the piston
travels through the cylinder liner at higher operating speed, the friction that it has to overcome is kinetic
rather than static thus the magnitude of the force is reduced. For instance it can also be observed that
during the first revolution the side thrust force peaks at the beginning, especially at 40 and 60 RPM. This
occurs before the transition of the piston’s friction state from static to kinetic thus for a brief moment at
the beginning of the test the friction force is higher resulting to a spike in side thrust force.
The phenomenon delineated previously in the test translated into higher vibration during the beginning of
the initial revolution of the test. This occurrence decreased significantly however when the test is carried
out with the piston at TDC, however the effect still raised, further consolidating the thesis outlined in
regards to this phenomenon.
0
1
2
3
4
5
6
7
8
9
10
11
12
13
14
-7
-6
-5
-4
-3
-2
-1
0
1
2
3
4
5
6
7
MotorTorque(Nm)
SideThrustForce(N)
25 per. Mov. Avg. (Side Thrust Force - Single Crankshaft)
25 per. Mov. Avg. (Side Thrust Force - Dual Crankshaft)
25 per. Mov. Avg. (Motor Torque - Single Crankshaft)
25 per. Mov. Avg. (Motor Torque - Dual Crankshaft)
TDC TDC TDCBDC BDC
50. MEng Stage 2 Final Year Report
Experimental Investigation of a Dual Crankshaft Engine
50
Figure 50 - 60RPM/No In-Cylinder Pressure
5.2.1 Non- Sealed Chamber - Conclusion
For the open cylinder examination, when the test rig is tested with two connection rods, the piston
assemblies’ friction has no side thrust force, unlike the single crankshaft configuration. However it has
been noticed that the motor required more torque to drive the test rig consistently in all tests when the
chamber is not sealed.
0
2
4
6
8
10
12
14
16
-10
-9
-8
-7
-6
-5
-4
-3
-2
-1
0
1
2
3
4
5
6
MotorTorque(Nm)
SideThrustForce(N)
15 per. Mov. Avg. (Side Thrust Force - Dual Crankshaft)
15 per. Mov. Avg. (Side Thrust Force - Single Crankshaft)
25 per. Mov. Avg. (Motor Torque - Single Crankshaft)
25 per. Mov. Avg. (Motor Torque - Dual Crankshaft)
BDC TDC BDCBDC TDC
51. MEng Stage 2 Final Year Report
Experimental Investigation of a Dual Crankshaft Engine
51
5.3 Part II – Investigating the effect of in-cylinder pressure on the side thrust
force
This section details the second part of the tests where the operation of the engine has been carried while
the chamber is sealed. It looks to identify the effects on the side thrust force a conventional motor will be
exposed to while is motored with a single and a dual crankshaft configuration. The data collected are for a
geometry configuration of a compression ratio of𝑟𝑟𝑐𝑐 = 2. For each test the data regarding the
instantaneous side thrust force and motor torque output, are in time intervals of 5 milliseconds.
Figure 51- 20RPM/ In-Cylinder Pressure (𝒓𝒓𝒄𝒄 = 𝟐𝟐)
Figure 48 and Figure 51 comprise data for a non-sealed and sealed chamber respectively, at an engine
operating speed of 20RPM. When comparing the figures it can be grasped that the in-cylinder pressure has
a significant effect on the side thrust force for the single crankshaft configuration. There is more than 300%
increase in side thrust force during the air-sealed chamber test, even at low RPM which in conjunction with
the low compression ratio utilised blow-by has a significant effect.
0
5
10
15
20
25
-25
-20
-15
-10
-5
0
5
10
15
20
25
MotorTorque(Nm)
SideThrustForce(N)
25 per. Mov. Avg. (Side Thrust Force - Single Crankshaft)
25 per. Mov. Avg. (Side Thrust Force - Dual Crankshaft)
25 per. Mov. Avg. (Motor Torque - Dual Crankshaft )
25 per. Mov. Avg. (Motor Torque - Single Crankshaft)
TDC TDCBDCTDC TDCBDC BDC
52. MEng Stage 2 Final Year Report
Experimental Investigation of a Dual Crankshaft Engine
52
Figure 52- 40RPM/ In-Cylinder Pressure (𝒓𝒓𝒄𝒄 = 𝟐𝟐)
The effects of in-cylinder pressure on the side thrust force are even more significant at higher operating
speeds as can be seen in Figure 52 in comparison to Figure 51 for the single crankshaft configuration. The
increased observed is due to the decrease in blow by at the higher operating speed. More significant
though is the side thrust force increase in comparison to the test which has been conducted at the same
operating speed which is more than four times less (Figure 49).
However 40 RPM is the highest achievable operating speed that could be investigated due to the motor
torque limitations which is 10Nm. While the maximum torque output is not utilised at the 20RPM test, at
40 RPM the maximum torque is achieved repeatedly, due to the decrease in blow by which in turn suggests
that there is a higher in-cylinder pressure which produces a larger opposing force on the piston at higher
operating speeds.
5.3.1 Sealed Chamber - Conclusion
Although the in-cylinder pressure has a significant effect on the magnitude of the side thrust force of the
single crankshaft configuration, the dual crankshaft engine experiences no side thrust force. Furthermore
in comparison to Part I where the motors required more torque to drive the rig with two crankshafts, when
in-cylinder pressure is introduced, the motors require less torque. Hence, showing signs that the utilisation
of two connection rods provides better mechanical efficiency in comparison to a conventional engine.
0
5
10
15
20
25
30
-30
-25
-20
-15
-10
-5
0
5
10
15
20
25
30
MotorTorque(Nm)
SideThrustForce(N)
15 per. Mov. Avg. (Side Thrust Force - Single Crankshaft)
15 per. Mov. Avg. (Side Thrust Force - Dual Crankshaft)
15 per. Mov. Avg. (Motor Torque - Single Crankshaft)
15 per. Mov. Avg. (Motor Torque - Dual Crankshaft)
BDC TDC BDC TDC BDC TDC BDC
53. MEng Stage 2 Final Year Report
Experimental Investigation of a Dual Crankshaft Engine
53
5.4 Part III – Investigating the Effect of a Spaceball Piston on a Dual Crankshaft
Engine
5.4.1 Overview - Operation Issue
Although the piston has been designed with dual gudgeon pins in order to decrease constrains, the same
problem Neander Shark encountered with piston stinking and scuffing [1] has also been found when
operating the test rig developed when using a conventional piston. Especially at low operating speeds the
chamber produces excessive vibrations and it is believed that is due to the gears which sync the two
crankshafts which allow a rocking motion of the piston within the cylinder. Shark Neander has designed a
spaceball piston which they claim reduces the delineated effects. This piston design has yet to be tested
and compared to a conventional piston design, thus it has been decided to manufacture a spaceball piston,
test it under identical conditions and compare the results.
5.4.2 Analysis – Spaceball Piston
In order to carry out an effective analysis, the data have not been averaged for the instantaneous motor
torque as it would have eliminated the fluctuations which are the mean of revealing the inconsistencies in
the piston’s motion. Because the data acquisition occurs in intervals of 5milliseconds it can be seen by
comparing Figure 53, Figure 54 and Figure 55 that as the test rig operating speed increases the resolution
of data per revolution decreases.
Figure 53 - Dual Crankshaft Configuration- 20RPM - Spaceball vs Conventional (Motor Torque)
-10
-6
-2
2
6
10
0
4
8
12
16
20
0 0.4 0.8 1.2 1.6 2 2.4 2.8 3.2 3.6 4 4.4 4.8 5.2
MotorTorque-Conventional(Nm)
MotorTorque-Spaceball(Nm)
Time (s)
Spaceball Piston /
20RPM
Conventional Piston /
20RPM
TDC
BDC
54. MEng Stage 2 Final Year Report
Experimental Investigation of a Dual Crankshaft Engine
54
Figure 53 which represent the data regarding the instantaneous motor torque for both piston
configurations at an operating speed of 20 RPM. When comparing the torque fluctuations of the two
piston configurations, the magnitude of them are significantly reduced for the spaceball piston. This
phenomenon suggests that the motor doesn’t have to fluctuate through different torque magnitudes to
cope with the piston sticking randomly as it moves within the cylinder. Thus the data indeed indicate a
decrease in piston sticking with the spaceball piston design when operating at 20RPM.
In order to further examine the spaceball piston design for the dual crankshaft engine the test has been
carried again at double the speed, 40 RPM. Figure 54 shows the findings of this test, regarding the
instantaneous torque every 5ms. The phenomenon encountered at the lower operating speed occurs in
this case as well as the fluctuations are significantly reduced further verifying the advantage of the
spaceball design in terms of the piston’s movement smoothness within the cylinder.
Figure 54 - Dual Crankshaft Configuration- 40RPM - Spaceball vs Conventional (Motor Torque)
Figure 55 although indicates the identical phenomenon in regards of motor torque fluctuations it also
shows another interesting occurrence in the comparison of the spaceball and conventional piston.
Although the rig was set at the same operating speed, the rig when tested with the spaceball piston
completes a revolution in a shorter period of time than the conventional piston. This occurrence
-10
-8
-6
-4
-2
0
2
4
6
8
10
0
4
8
12
16
20
0 0.2 0.4 0.6 0.8 1 1.2 1.4 1.6 1.8 2 2.2 2.4 2.6 2.8 3
MotorTorque-Conventional(Nm)
Time(s)
Spaceball Piston / 40 RPM
Conventional Piston / 40
RPM
TDC
BDC
55. MEng Stage 2 Final Year Report
Experimental Investigation of a Dual Crankshaft Engine
55
designates that as the piston travels through the chamber it doesn’t stick thus it doesn’t interrupt the
velocity of the piston hence completing the cycle faster.
Figure 55 - Dual Crankshaft Configuration- 80RPM - Spaceball vs Conventional (Motor Torque)
5.5 Spaceball Piston - Conclusion
Other than the test the rig vibration decrease which can be clearly identified when the spaceball piston is
utilized, data analysis has also showed a decrease in piston sticking and scuffing as well. At lower operating
speeds the motor torque fluctuations are reduced significantly with the spaceball piston. Also at higher
speeds a revolution is completed significantly faster under same motor load conditions.
Hence a spaceball piston shape is believed to be advantageous for mass productions as it decreases the
dual crankshaft engine’s constrains.
-10
-8
-6
-4
-2
0
2
4
6
8
10
0
2
4
6
8
10
12
14
16
18
20
0 0.1 0.2 0.3 0.4 0.5 0.6 0.7 0.8 0.9 1 1.1 1.2 1.3 1.4 1.5 1.6 1.7
MotorTorque-Conventional(Nm)
MotorTorque-Spacebal(Nm)
Time (s)
Spaceball Piston / 80 RPM
Conventional Piston / 80RPM
TDC
BDC
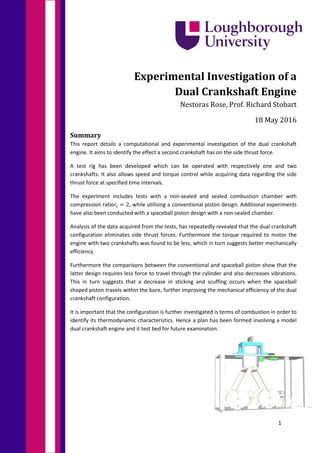
![MEng Stage 2 Final Year Report
Experimental Investigation of a Dual Crankshaft Engine
2
INTRODUCTION
The dual crankshaft engine’s geometry offers a reduction in sidewall thrust forces compared to a
conventional inline engine design. This phenomenon is due to a theoretical elimination of the resolving
forces acting onto the side of the cylinder liner. This is caused by the single crankshaft’s connection rod in
an inline engine which at all crank-positions except TDC and BTD is at an angle. It is expected that due to
this occurrence in a dual crankshaft design would reduce significantly the mechanical losses compared to a
single connection rod configuration engine. Given that the mechanical losses are accountable for a
significant portion of the overall losses of an engine, a substantial increase in thermal efficiency could be
expected.
Other advantages of this design include a better utilisation of the expanding gasses. Studies carried out
previously found that the piston motion created by a dual crank engine with a crankshaft offset from the
cylinder centre line offers a down stroke which occurs over a longer crank angle than the upstroke. This
potentially offers improvements in torque output and cylinder charge filling.
This mechanism has already been employed in internal combustion engines and fluid pumps. However the
advantages this configuration offers have yet to be experimentally quantified.
This project has been carried out to measure the magnitude of the side thrust force through an experiment
on a test rig which has been designed and manufactured to allow single and twin crankshaft operation.
Furthermore it also looks to compare the conventional and spaceball piston designs for a dual crankshaft
engine.
Figure 1– Neander Spaceball Piston Design for Twin Crankshaft Engine Application [1]](data:image/gif;base64,R0lGODlhAQABAIAAAAAAAP///yH5BAEAAAAALAAAAAABAAEAAAIBRAA7)