Hockey Infographic
•
0 j'aime•289 vues

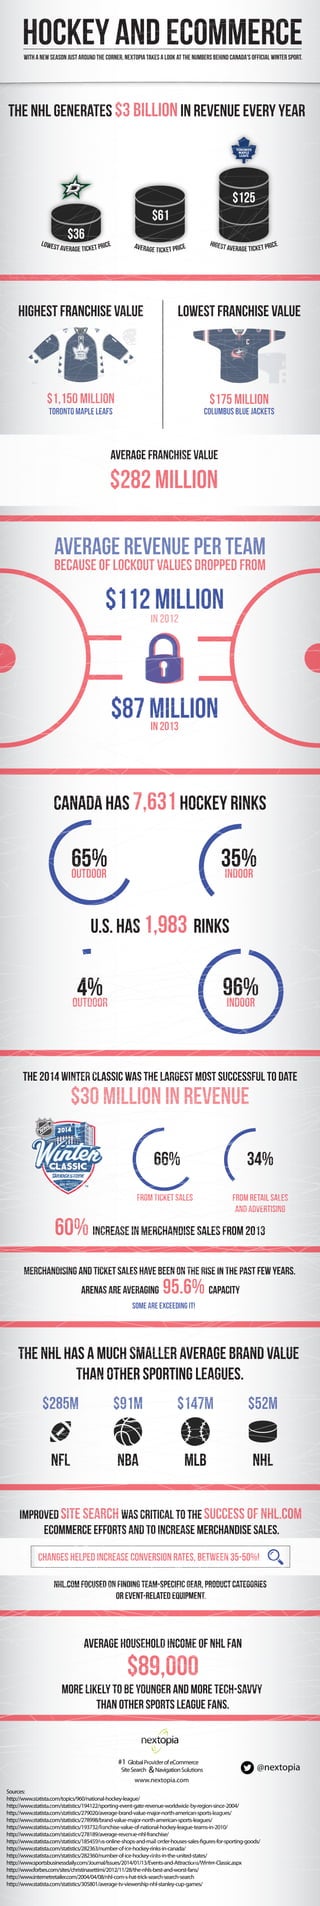
Hockey Infographic and eCommerce and NHL and Hockey Spending With the regular NHL season starting this week fans are gearing up for what is bound to be another exciting season. Now, more than ever, hockey fans are turning to eCommerce sites like NHL.com for their jersey and hockey swag needs. Check out our infographic below to learn more about the NHL and what necessary steps they are taking to ensure their eCommerce site is ready for game time!

Recommandé
Contenu connexe
En vedette
Similaire à Hockey Infographic
Plus de Nextopia Software Corporation
Plus de Nextopia Software Corporation (11)
Dernier
Dernier (20)
Hockey Infographic
- 1. $36 $61 $125 Hockey and eCommerce The NHL generates $3 billionin revenue every year Highest FRANCHISE value toronto Maple Leafs $1,150 million LOWEST FRANCHISE value columbus blue jackets $175 million Average franchise value $282 million Average revenue per team Because of lockout values dropped from $112 millionin 2012 $87 millionin 2013 Canada has 7,631hockey rinks U.S. Has 1,983 rinks 65%outdoor 35%indoor 4%outdoor 96%indoor the 2014 Winter classic was the largest most successful to date 66% from ticket sales 34% from Retail sales and Advertising $30 million in revenue 60% increase in merchandise sales from 2013 Improved site search was critical to the success of NHL.com eCommerce efforts and to increase merchandise sales. THE nhl has a Much smaller average brand value than other sporting leagues. $52m NHL $285m NFL $147m MLB $91m NBA Changes helped increase conversion rates, between 35-50%! NHL.com Focused on finding team-specific gear, product categories or event-related equipment. Average household income of NHL fan More likely to be younger and more tech-savvy Than other sports league fans. Merchandising and ticket sales have been on the rise in the past few years. ArenAs are averaging 95.6% capacity some are exceeding it! $89,000 @nextopia Sources: http://www.statista.com/topics/960/national-hockey-league/ http://www.statista.com/statistics/194122/sporting-event-gate-revenue-worldwide-by-region-since-2004/ http://www.statista.com/statistics/279020/average-brand-value-major-north-american-sports-leagues/ http://www.statista.com/statistics/278998/brand-value-major-north-american-sports-leagues/ http://www.statista.com/statistics/193732/franchise-value-of-national-hockey-league-teams-in-2010/ http://www.statista.com/statistics/278189/average-revenue-nhl-franchise/ http://www.statista.com/statistics/185459/us-online-shops-and-mail-order-houses-sales-figures-for-sporting-goods/ http://www.statista.com/statistics/282363/number-of-ice-hockey-rinks-in-canada/ http://www.statista.com/statistics/282360/number-of-ice-hockey-rinks-in-the-united-states/ http://www.sportsbusinessdaily.com/Journal/Issues/2014/01/13/Events-and-Attractions/Winter-Classic.aspx http://www.forbes.com/sites/christinasettimi/2012/11/28/the-nhls-best-and-worst-fans/ http://www.internetretailer.com/2004/04/08/nhl-com-s-hat-trick-search-search-search http://www.statista.com/statistics/305801/average-tv-viewership-nhl-stanley-cup-games/ www.nextopia.com & #1 GlobalProviderofeCommerce SiteSearch NavigationSolutions With a new season just around the corner, Nextopia takes a look at the numbers behind Canada's official winter sport.