1. hello
Adverse Drug Event Statistics
1Bold: Metabolism and transport known. Single asterisk (*): No transport data. Double asterisks (**): No metabolism data
• Total of 3,107,596
ADEs, 833,774
believed to be
primary sources
• 767,165 severe
ADEs, including
102,253 deaths
• Top three drugs
associated with
ADEs are biological
• CYP3A4 metabolizes many ADE
causing drugs and also has a
decreased activity in NASH.
• Each member of the MRP transport
family, MRP1, MRP2, and MRP3,
show increased expression in the
disease model.
Metabolism Enzymes and Transporters in NASH
Table 2: Frequency of Severe ADEs
Death Life-Threatening Hospitalization Disability Congenital Anomaly Other
2011q2 26324 7467 65832 8871 1103 84699
2011q3 23715 7497 63190 9060 1207 85805
2011q4 23077 7483 64141 5042 1318 79618
2012q1 29137 8044 68951 6076 1899 87609
102253 30491 262114 29049 5527 337731
Table 1: Frequency of ADEs
Primary Secondary Concomitant Interaction Total
2011q2 194310 141167 416999 3006 755482
2011q3 198777 146092 405989 3098 753956
2011q4 208742 138067 386270 2888 735967
2012q1 231945 162408 464711 3127 862191
833774 587734 1673969 12119 3107596
Table 3: Drugs with most common ADEs1
DRUGNAME DRUGNAME DRUGNAME DRUGNAME
Etanercept Varenicline Bevacizumab Cyclophosphamide
Adalimumab Imatinib Ranibizumab Romiplostim
Natalizumab Pregabalin Lamotrigine* Desvenlafaxine
Metoclopramide* Clozapine Sunitinib Eculizumab
Dabigatran Atorvastatin Certolizumab Simvastatin
Esomeprazole Fingolimod Alendronate Valsartan**
Lenalidomide Quetiapine* Deferasirox Sildenafil
Naproxen Isotretinoin Metformin Tacrolimus
Rosiglitazone Fentanyl Everolimus* Gabapentin
Infliximab Denosumab Sertraline Celecoxib
Zoledronic Acid Telaprevir Risperidone Omeprazole
Bosentan Ambrisentan Duloxetine* Rosuvastatin
Introduction
Adverse Drug Events (ADEs)
• Unintended, harmful interactions in spite of
proper medication use
• Caused by augmented pharmacology,
idiosyncratic effects, and/or genetic disorders
• Range in severity from disability to death
Nonalcoholic Fatty Liver Disease/
Nonalcoholic Steatohepatitis
• Chronic liver condition in which high hepatic
fat accumulation ,obesity, insulin resistance,
and altered liver enzyme expression are
common
• Occurs in 30-40% of the adult population
with higher rates among patients with
metabolic syndrome or type 2 diabetes
mellitus, T2DM.
• The disease can range from simple hepatic
steatosis to lobular necroinflammation, also
referred to as Nonalcoholic steatohepatitis,
NASH, and progress to cirrhosis.
Drug Metabolism and Disposition
• Metabolism is an important step in the action
of many drugs.
• Cytochrome P450 oxidases and UDP-
glucuronosyltransferases are examples of key
metabolizing enzymes.
• Organic Anion Transporter Polypeptide
(OATP) mediate uptake of organic anions into
cells
• Organic Cation Transporters (OCTs) are
responsible for uptake of organic cations into
cells.
• Multidrug and toxin extrusion proteins
(MATEs) are important for efflux of
xenobiotics into bile or urine.
Table 4: Enzymes involved in metabolism of drugs with most common ADEs.
CYP1A2
CYP2B6
CYP2C9
CYP2C19
CYP2D6
CYP3A4
UGT1A4
UGT2B7
Not
Metabolized
Clozapine
Sertraline
Bosentan
Ambrisentan
Clozapine
Ambrisentan
Clozapine
Lamotrigine
Gabapentin
Deferasirox
Celecoxib
Esomeprazole
Deferasirox
Atorvastatin
Lamotrigine
Naproxen
Metformin
Duloxetine
Naproxen
Omeprazole
Duloxetine
Bosentan
Tacrolimus
Sertraline
Naproxen
Rosuvastatin
Sertraline
Metoclopramide
Clozapine
Varenicline
Sertraline
Sertraline
Desvenlafaxine
Sildenafil
Risperidone
Esomeprazole
Everolimus
Fentanyl
Imatinib
Omeprazole
Quetiapine
Sertraline
Sildenafil
Simvastatin
Sunitinib
Telaprevir
Table 5: Transporters involved in the disposition of drugs with most common ADEs.
MCT-1
MRP1
MRP2
MRP3
OATP1B1
OATP1B3
OCT1
OCT2
P-gp
Gabapentin
Rosuvastatin
Deferasirox
Deferasirox
Ambrisentan
Bosentan
Esomeprazole
Clozapine
Dabigatran
Naproxen
Omeprazole
Bosentan
Rosuvastatin
Gabapentin
Gabapentin
Desvenlafaxine
Rosuvastatin
Rosuvastatin
Sildenafil
Imatinib
Metformin
Fentanyl
Valsartan
Sildenafil
Tacrolimus
Metformin
Varenicline
Lenalidomide
Simvastatin
Valsartan
Omeprazole
Risperidone
Tacrolimus
Rosiglitazone
Valsartan
Sertraline
Telaprevir
Table 6: Metabolism changes in
NASH
Enzyme Disease State
CYP1A2 Decrease expression /activity
CYP2B6 Increased mRNA
CYP2C9 Increase Activity
CYP2C19 Decrease expression /activity
CYP2D6 Decrease activity
CYP3A4 Decrease activity
UGT1A4 Decrease not significant
UGT2B7 Decrease not significant
Table 7: Transporter
changes in NASH
Enzyme Disease State
MCT-1 No information available
MRP1 Increased
MRP2 Increased
MRP3 Increased
OATP1B1 Increased
OATP1B3 Decreased
OCT1 No information available
OCT2 No information available
P-gp Increased
Methods
Adverse Drug Events (ADEs)
• Data was quieried using the FAERS from
2011Q2-2012Q1 for drugs deemed primary
causes of an ADE
• The metabolizing and transport enzymes for
the top 48 ADE causing drugs was
determined as well as the effect of NASH on
each enzyme.
Liver Enzymes
• OATP1B1 and OATP1B3 expression was
determined by Western blot for normal,
steatosis, NASH-fatty, and NASH-not fatty
• Samples were separated on 10% SDS-PAGE
gel, transferred to PVDF membrane,
incubated in primary and secondary antibodies
and imaged using chemiluminescence
substrate.
Conclusions
• NASH alters the expression of key
metabolism enzymes and transporters
important for drug and toxin elimination from
the body.
• We have previously shown the impact of
altered hepatic transport expression in NASH
affecting disposition of three drugs:
• Ezetimibe and acetaminophen, effluxed by
the MRP family, have been shown to have
increased efflux into sinusoidal blood, and
decreased billiary excretion. This removes
ezetimibe away from its target site, the small
intestine, and increases acetaminophen
metabolite exposure, potentially increasing
toxicity in NASH.
• Similarly, simvastatin, which is transported
by the OATP family, has been shown to
have increased plasma concentration and
decreased bile concentrations, increasing
systemic exposure and potentially
contributing to the statin ADE myopathy.
• These data may have clinical implications for
frequency and severity of ADEs in NASH
patients due to altered drug metabolism and
disposition in NASH.
Adverse Drug Events and Altered Drug Metabolism and Disposition in Nonalcoholic Steatohepatitis
Nicholas R. Nelson1, John D. Clarke2, Nathan J. Cherrington2
1Department of Chemistry and Biochemistry
2Department of Pharmacology and Toxicology
University of Arizona
Mouse Oct1 Liver
Human OCT2 Liver
Human OCT1 Liver
Mouse Oct2 Kidney
Mouse Mate1 Kidney
Mouse Oct1 Kidney
Future Study
Metformin is a drug that causes a large amount of ADEs as seen in Table 3. Table 8 shows the ten most
common ADEs caused by metformin including renal failure and lactic acidosis which have the possibility
to lead to death. We hypothesize that the pharmacokinetics of this glucose lowering drug may be altered in
NASH due to alterations in the MATE1 and OCT transporters (Figure 2).
• Study design
• Three groups of mice, C57BLK/6, ob/ob, and ob/ob fed MCD diet for four weeks.
• 14C-metformin will be mixed with unlabeled metformin and dissolved in water 12.5mg/50µCi/mL
administered via oral gavage in a volume 2mL/kg.
• Blood will be collected at 0.5, 1, 2, 4, 6, 8, 12, and 16 hours and plasma radioactivity measured.
• Urine and feces will be collected at 4 hour intervals and measured for radioactivity.
• Terminal liver, kidney, intestines sectioned into 3 parts, and skeletal muscle will be collected and
solubilized using Soluene-350 and radioactivity will be determined for each sample.
MATE1
N
o
r
m
a
l
S
t
e
a
t
o
s
i
s
N
A
S
H
f
a
t
t
y
N
A
S
H
n
o
t
f
a
t
t
y
5
6
7
8
9
*
OCT1
N
o
r
m
a
l
S
t
e
a
t
o
s
i
s
N
A
S
H
f
a
t
t
y
N
A
S
H
n
o
t
f
a
t
t
y
7
8
9
10
11
12
OCT2
N
o
r
m
a
l
S
t
e
a
t
o
s
i
s
N
A
S
H
f
a
t
t
y
N
A
S
H
n
o
t
f
a
t
t
y
3.0
3.5
4.0
4.5
• MATE1 mRNA expression is decreased in
NASH-not fatty human liver
• Oct2 and Mate1 kidney mRNA expression
are both decreased in rodent NASH models
Figure 2a- Human microarray data Figure 2b
Table 8: Metformin ADEs
Adverse Drug Event
1 Pain
2 Renal Failure
3 Nausea
4 Diarrhea
5 Increased Blood Glucose
6 Vomitting
7 Lactic Acidosis
8 Pancreatitis
9 Dyspnoea
10 Fatigue
Acknowledgements: Mark Canet for rodent NASH Oct1, Oct2, and Mate1 mRNA expression data, Craig Fisher and
Rhiannon Hardwick for metabolism enzyme changes in NASH data, April Lake for human microarray data.
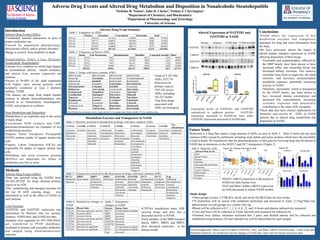
OATP1B1
N
o
r
m
a
l
S
t
e
a
t
o
s
i
s
N
A
S
H
-
f
a
t
t
y
N
A
S
H
-
n
o
t
f
a
t
t
y
0
2
4
6
8
10
*
OATP1B1/cadherin
OATP1B3
N
o
r
m
a
l
S
t
e
a
t
o
s
i
s
N
A
S
H
-
f
a
t
t
y
N
A
S
H
-
n
o
t
f
a
t
t
y
0.0
0.2
0.4
0.6
0.8
*
OATP1B3/pan-cadherin
Cadherin
OATP1B1
Normal Steatosis NASH-fatty NASH-not
fa(y
Cadherin
OATP1B3
Expression levels of OATP1B1 and OATP1B3
normalized to cadherin protein. OATP1B1
expression increased in NASH-not fatty while
OATP1B3 expression decreased in NASH-fatty
Altered Expression of OATP1B1 and
OATP1B3 in NASH