SlideShare une entreprise Scribd logo
1  sur  2
Télécharger pour lire hors ligne
Average Account Size
Per Client
Lines of Business
Firm Assets Under Mgmt. Custodian Market Share
by Number of RIA’s
RIA Firm Analysis
Average Account Size
Per IAR
52%
12%
16%
5%
4%
8%
2%
1%
$0 - $499k
$500k - $999k
$1mil - $19.9mil
$20mil - $49.99mil
$50mil - $99.99mil
$100mil - $499.99mil
$500mil - $999.99mil
$1bil - $100bil
9%
15%
15%
12%
3%
46%
ETF's Mutual Funds
Alternative Products Retirement Products
Separately Managed Other
2% 2%
30%
16%10%
20%
6%
13%
1%
$0 - $499k
$500k - $999k
$1mil - $19.9mil
$20mil - $49.99mil
$50mil - $99.99mil
$100mil - $499.99mil
$500mil - $999.99mil
$1bil - $499.99bil
$500bil - $3tril
0%
5%
10%
15%
20%
25%
30%
35%
40%
23%
15%
11%
4% 4% 3% 2%
38%
Number of IARs per RIA
79%
10%
5%
2%
1%
1%1%
1%
0 to 4
5 to 9
10 to 19
20 to 29
30 to 49
50 to 99
100 to 499
500 +
0%
5%
10%
15%
20%
25%
30%
35%
40%
3% 2%
40%
23%
13% 14%
2% 2% 1%
*Number of RIA’s is a company estimate
0Pershing in partnership with Financial Media Group, has provided this
attendee research and data for your use.
This "At-a-Glance" report was designed to provide you with high level insight
into the firms and advisors attending this years conference . For additional
information, including in-depth firm or advisor analytics, please see:
RIA Location Density
Nick Schmidt
1-877-763-8473
Financial Media Group is the premier provider of database and marketing services used by financial firms in the
marketing, recruitment and research of financial advisors and associated firms. From detailed insight into the
industry’s 600,000+ advisors, to in-depth profiles on the 31,000+ RIA’s – our tools help you precisely target the
financial industry like no one else.
0%
5%
10%
15%
20%
25%
30%
35%
40%
6% 7%
11%
13%
19%
6%
38%
15%
13% 14%
8% 8%
2%
40%
Non-High Networth High-Networth
Client Types
55%34%
11%
SEC State BD / RIA Hybrid
Firm Types

Contenu connexe

Similaire à RIA Market at a Glance

Cost Savings Presentation May 2012
Cost Savings  Presentation   May 2012Cost Savings  Presentation   May 2012
Cost Savings Presentation May 2012ParryMurphy
 
P3 Conference - 10 Things Your Core IT Supplier Will Not Tell You
P3 Conference - 10 Things Your Core IT Supplier Will Not Tell YouP3 Conference - 10 Things Your Core IT Supplier Will Not Tell You
P3 Conference - 10 Things Your Core IT Supplier Will Not Tell YouMona Ashour
 
Alan Cox Advertising Effectiveness
Alan Cox Advertising EffectivenessAlan Cox Advertising Effectiveness
Alan Cox Advertising EffectivenessAlchemy
 
Tom weldin llc_retail_opportunities
Tom weldin llc_retail_opportunitiesTom weldin llc_retail_opportunities
Tom weldin llc_retail_opportunitiesTomWeldin
 
A Summary of the US Economy through Corporate Finance
A Summary of the US Economy through Corporate FinanceA Summary of the US Economy through Corporate Finance
A Summary of the US Economy through Corporate FinancePranav Ghai
 
A Macro View Through the Micro Lens
A Macro View Through the Micro LensA Macro View Through the Micro Lens
A Macro View Through the Micro LensPranav Ghai
 
Basics of the Economics of Monopoly
Basics of the Economics of MonopolyBasics of the Economics of Monopoly
Basics of the Economics of Monopolytutor2u
 
Economics of Monopoly
Economics of MonopolyEconomics of Monopoly
Economics of Monopolytutor2u
 
Use of sna and give back ratio monitoring to improve cost effectiveness of yo...
Use of sna and give back ratio monitoring to improve cost effectiveness of yo...Use of sna and give back ratio monitoring to improve cost effectiveness of yo...
Use of sna and give back ratio monitoring to improve cost effectiveness of yo...Benjamin FILAFERRO
 
Oligopoly - The Kinked Demand Curve
Oligopoly - The Kinked Demand CurveOligopoly - The Kinked Demand Curve
Oligopoly - The Kinked Demand Curvetutor2u
 
Wit Rikon Marketing Institute Presentation
Wit Rikon Marketing Institute PresentationWit Rikon Marketing Institute Presentation
Wit Rikon Marketing Institute Presentationpaularonan
 
Walmart Advertising Report
Walmart Advertising ReportWalmart Advertising Report
Walmart Advertising ReportColin Parajon
 
2011 November Investor Presentation
2011   November Investor Presentation2011   November Investor Presentation
2011 November Investor Presentationcarlisle_com
 
2019 Nicola Wealth Toronto Strategic Outlook
2019 Nicola Wealth Toronto Strategic Outlook 2019 Nicola Wealth Toronto Strategic Outlook
2019 Nicola Wealth Toronto Strategic Outlook Charis Whitbourne
 
Credit Suisse First Boston Financial Services Conference
Credit Suisse First Boston Financial Services ConferenceCredit Suisse First Boston Financial Services Conference
Credit Suisse First Boston Financial Services ConferenceQuarterlyEarningsReports3
 
Amazon go feasibility study
Amazon go feasibility studyAmazon go feasibility study
Amazon go feasibility studyAmmine Ait
 

Similaire à RIA Market at a Glance (20)

Cost Savings Presentation May 2012
Cost Savings  Presentation   May 2012Cost Savings  Presentation   May 2012
Cost Savings Presentation May 2012
 
P3 Conference - 10 Things Your Core IT Supplier Will Not Tell You
P3 Conference - 10 Things Your Core IT Supplier Will Not Tell YouP3 Conference - 10 Things Your Core IT Supplier Will Not Tell You
P3 Conference - 10 Things Your Core IT Supplier Will Not Tell You
 
Advertising Effectiveness
Advertising Effectiveness Advertising Effectiveness
Advertising Effectiveness
 
Alan Cox Advertising Effectiveness
Alan Cox Advertising EffectivenessAlan Cox Advertising Effectiveness
Alan Cox Advertising Effectiveness
 
Tom weldin llc_retail_opportunities
Tom weldin llc_retail_opportunitiesTom weldin llc_retail_opportunities
Tom weldin llc_retail_opportunities
 
A Summary of the US Economy through Corporate Finance
A Summary of the US Economy through Corporate FinanceA Summary of the US Economy through Corporate Finance
A Summary of the US Economy through Corporate Finance
 
A Macro View Through the Micro Lens
A Macro View Through the Micro LensA Macro View Through the Micro Lens
A Macro View Through the Micro Lens
 
Basics of the Economics of Monopoly
Basics of the Economics of MonopolyBasics of the Economics of Monopoly
Basics of the Economics of Monopoly
 
Economics of Monopoly
Economics of MonopolyEconomics of Monopoly
Economics of Monopoly
 
PetSmart GIRC Final
PetSmart GIRC FinalPetSmart GIRC Final
PetSmart GIRC Final
 
Use of sna and give back ratio monitoring to improve cost effectiveness of yo...
Use of sna and give back ratio monitoring to improve cost effectiveness of yo...Use of sna and give back ratio monitoring to improve cost effectiveness of yo...
Use of sna and give back ratio monitoring to improve cost effectiveness of yo...
 
Oligopoly - The Kinked Demand Curve
Oligopoly - The Kinked Demand CurveOligopoly - The Kinked Demand Curve
Oligopoly - The Kinked Demand Curve
 
Wit Rikon Marketing Institute Presentation
Wit Rikon Marketing Institute PresentationWit Rikon Marketing Institute Presentation
Wit Rikon Marketing Institute Presentation
 
3M Presentation
3M Presentation3M Presentation
3M Presentation
 
Walmart Advertising Report
Walmart Advertising ReportWalmart Advertising Report
Walmart Advertising Report
 
2011 November Investor Presentation
2011   November Investor Presentation2011   November Investor Presentation
2011 November Investor Presentation
 
2019 Nicola Wealth Toronto Strategic Outlook
2019 Nicola Wealth Toronto Strategic Outlook 2019 Nicola Wealth Toronto Strategic Outlook
2019 Nicola Wealth Toronto Strategic Outlook
 
Global breakout
Global breakout Global breakout
Global breakout
 
Credit Suisse First Boston Financial Services Conference
Credit Suisse First Boston Financial Services ConferenceCredit Suisse First Boston Financial Services Conference
Credit Suisse First Boston Financial Services Conference
 
Amazon go feasibility study
Amazon go feasibility studyAmazon go feasibility study
Amazon go feasibility study
 

RIA Market at a Glance

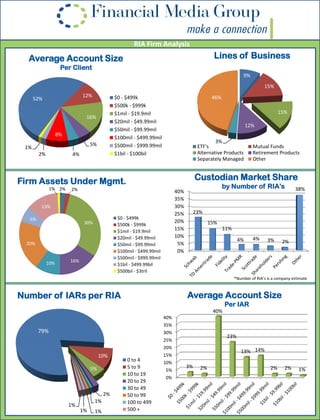
  • 1. Average Account Size Per Client Lines of Business Firm Assets Under Mgmt. Custodian Market Share by Number of RIA’s RIA Firm Analysis Average Account Size Per IAR 52% 12% 16% 5% 4% 8% 2% 1% $0 - $499k $500k - $999k $1mil - $19.9mil $20mil - $49.99mil $50mil - $99.99mil $100mil - $499.99mil $500mil - $999.99mil $1bil - $100bil 9% 15% 15% 12% 3% 46% ETF's Mutual Funds Alternative Products Retirement Products Separately Managed Other 2% 2% 30% 16%10% 20% 6% 13% 1% $0 - $499k $500k - $999k $1mil - $19.9mil $20mil - $49.99mil $50mil - $99.99mil $100mil - $499.99mil $500mil - $999.99mil $1bil - $499.99bil $500bil - $3tril 0% 5% 10% 15% 20% 25% 30% 35% 40% 23% 15% 11% 4% 4% 3% 2% 38% Number of IARs per RIA 79% 10% 5% 2% 1% 1%1% 1% 0 to 4 5 to 9 10 to 19 20 to 29 30 to 49 50 to 99 100 to 499 500 + 0% 5% 10% 15% 20% 25% 30% 35% 40% 3% 2% 40% 23% 13% 14% 2% 2% 1% *Number of RIA’s is a company estimate
  • 2. 0Pershing in partnership with Financial Media Group, has provided this attendee research and data for your use. This "At-a-Glance" report was designed to provide you with high level insight into the firms and advisors attending this years conference . For additional information, including in-depth firm or advisor analytics, please see: RIA Location Density Nick Schmidt 1-877-763-8473 Financial Media Group is the premier provider of database and marketing services used by financial firms in the marketing, recruitment and research of financial advisors and associated firms. From detailed insight into the industry’s 600,000+ advisors, to in-depth profiles on the 31,000+ RIA’s – our tools help you precisely target the financial industry like no one else. 0% 5% 10% 15% 20% 25% 30% 35% 40% 6% 7% 11% 13% 19% 6% 38% 15% 13% 14% 8% 8% 2% 40% Non-High Networth High-Networth Client Types 55%34% 11% SEC State BD / RIA Hybrid Firm Types