2. taxonomies to young children's classification of foods versus non-
foods as a means of explaining child disgust and rejection of
foods and the development of child food preferences with age,
growth, and socialization.
With respect to preschoolers' perceptions of food and health
specifically, children between the ages of 3 and 5 begin relating
foods to health but do not typically grasp how food influences
health in the body (Singleton, Achterberg, & Shannon, 1992).
However, intervention work in Columbia aiming to improve car-
diovascular health among preschoolers and their families showed
that a developmentally appropriate nutrition and exercise curric-
ulum produced significant increases in preschoolers' nutritional
knowledge relative to a control group (Cespedes et al., 2013). By
school age, children's beliefs about a food's healthiness guide their
independent food choices and eating behaviors (Kandiah Jones,
2002; Lakshman, Sharp, Ong, Forouhi, 2010). Children as young
as 5e6 who have completed nutrition education curricula display
greater nutritional knowledge and more healthful food preferences
(Kandiah Jones, 2002) and independent, unsupervised food
intake (Baskale Bahar, 2011). Since children's independence over
their food choices increases with entry into kindergarten, when
they have more freedom to make their own selections or to reject or
trade home-packed foods when assembling lunch, the ability to
measure children's health-specific meal schemas prior to kinder-
garten will improve our understanding of the role played by these
schemas in predicting later eating behavior.
Unfortunately, little is known about preschoolers' healthy-meal
schemas due to a dearth of developmentally tailored measures.
Pioneers in the study of preschool healthy-food schemas have
attempted to map developing schemas by showing photographs of
foods to children as young as 3 (Holub Musher-Eizenman, 2010;
Nguyen, 2007) and by restricting questionnaire items to basic vo-
cabulary words (e.g., carrot, bacon, cake) with children as young as
4 (Nguyen, Gordon, McCullough, 2011). Defining healthy food
schemas as evaluative categories that include items sharing the
same value-laden assessment (e.g., “healthy” foods versus “junky”
foods), these investigators have revealed an emerging under-
standing among preschoolers regarding health-specific nutrition
knowledge, operationalized as the classification of foods like apples
as “healthy” and cookies as “junky.” These studies defined
“healthier” foods as those with greater nutrient density and lower
energy density. Nguyen (2007) reported that preschooler nutrition
knowledge (favoring “healthy” foods) was just better than chance
(59%) at age 3 and improved steadily to almost 80% by age 7.
Extending the healthy-food concept to healthy meals, Holub and
Musher-Eizenman (2010) asked 69 3e6-year-old children to
assemble meals using photographs of 21 different foods. Children
were asked to choose 4 foods and 1 drink to construct preferred,
healthy, and unhealthy meals. Within these constraints, children's
healthy meals featured less estimated fat and calories than their
unhealthy meals, although few children were able to explain their
choices in a nutritionally valid way.
1. The placemat protocol
Conceptions of “healthiness” vary widely and include categori-
cal taxonomies like whole versus refined, organic versus conven-
tional, carcinogenic versus noncarcinogenic, probiotic versus
nonprobiotic, clean versus unclean, and so on. Since our target
population was preschoolers and the contextual health issue is
childhood obesity, we restricted our definition to the simple di-
chotomy of energy-dense versus nutrient-dense foods (corre-
sponding to the “junky” versus “healthy” taxonomy of Nguyen,
2007 and Nguyen et al., 2011) on the grounds that (1) parents of
preschoolers likely use simple categorizations like “junk food” and
“healthy food” to broadly categorize foods that children should
consume in small doses or on special occasions versus foods they
are encouraged to eat at each meal, and that (2) months of pointing
out such foods at mealtimes would allow children to recognize
them visually. Of course this type of categorization is a false di-
chotomy. Energy-dense foods can be nutrient-dense, so our goal
was to estimate the overall nutritional profile of a meal constructed
of multiple foods to assess its relative energy density and nutrient
density.
We also avoided defining “healthy” to research participants to
assess how children's pre-existing schemas were reflected in the
meals they assembled based on their understanding (or misun-
derstanding) of the term. The research summarized above indicates
that the preschool years are a time of intense activity with respect
to the development of evaluative schematic cognitions about
“healthy” foods and meals, but since the measures used required
children to process a series of verbal questions and provide verbal
answers, it is unclear whether these studies provide a compre-
hensive map of preschoolers' healthy-meal schemas, especially for
children whose verbal abilities lag behind the norm.
The present study builds on this formative body of work by
taking the meal-construction task to the third dimension, asking
children to assemble a “healthy” meal using highly realistic 3D food
replicas rather than answering questions about food pairs. The
Placemat Protocol was designed to maximize the ecological validity
of the meal-construction task as much as possible short of using
real foods. Although a meal-construction task using real foods (e.g.,
Amari et al., 2007) would be most realistic, real foods are impos-
sible to standardize due to inconsistency in size and appearance.
This makes real foods problematic schema-measurement tools
because apparent differences in schemas across samples could
reflect differences in a given food's appearance, freshness, color, or
aroma across testing sessions. Real foods also present risks from
perishability, allergens, and pathogens. In contrast, current
research procedures using stylized, less realistic food models or
color photos (Contento, 2011; Holub Musher-Eizenman, 2010)
are standardized, but can be difficult to connect schematically with
real foods for young children who have not seen them in real life or
for those who have not mastered symbolic relations between 2D
and 3D objects (Uttal, Liu, DeLoache, 2003). Likewise, verbal
measures are effective for older children (Swanson, Shoenberg,
Davis, Wright, Dollarhide, 2013) but may be challenging for
some preschoolers because their vocabularies are limited and
because nutrition and health are abstract concepts. Since pre-
schoolers rely heavily on visible and physical characteristics like
texture, shape, and color to classify foods (Matheson, Spranger,
Saxe, 2002), the use of highly realistic toy foods to make pretend
meals may be the most promising way to assess evaluative aspects
of preschooler meal schemas without the risks and inconsistencies
of real foods. Children play with toy foods realistically and grasp
their connection to real foods (Lynch, 2012), and research on
grocery-shopping role-play with toy products has proven valid for
assessing various aspects of food, alcohol, and cigarette purchasing
and consumption schemas among children ages 2e6 (Dalton et al.,
2005; Zucher et al., 1995).
The Placemat Protocol, presented here, was designed to maxi-
mize concreteness and 3D visual and tactile interaction. It also of-
fers the opportunity to select multiple portions of each food item,
an important inclusion given the link between portion size and
obesity (McConahy, Smiciklas-Wright, Mitchell, Picciano, 2004).
Using the measure, investigators can score the following di-
mensions of assembled meals: number of items on the plate;
number of energy-dense versus nutrient-dense items; number of
items in different food categories (vegetables, fruits, grains, milk
and dairy, meat and beans, and beverages); portions of each item
K. Harrison et al. / Appetite 96 (2016) 209e218210
3. (0, 1, or 2); and estimated macro- and micronutrients (e.g., grams of
fat, sugar, salt, protein) in each item and assembled meal, calculated
by multiplying volume and weight information stamped on the
underside of each food model with data from the National Nutrient
Database for Standard Reference (USDA, 2012a).
The goal of this study was to introduce and validate this mea-
sure by (a) estimating differences between preschoolers' baseline
(preferred) meals and healthy meals, with the expectation that
healthy meals would, on average, be more nutrient-dense and less
energy-dense than preferred meals; and (b) evaluating the mea-
sure's construct validity by testing its correlation with child verbal
nutrition knowledge, child vocabulary, parent healthy eating
guidance, and child dietary intake as reported by parents. We also
compared dimensions of meals for subgroups of children known to
have different levels of obesity risk (e.g., Black children versus non-
Black children, overweight children versus non-overweight
children).
2. Method
2.1. Participants
This study was approved by the University of Michigan Health
Sciences and Behavioral Sciences IRB prior to recruitment and data
collection. Recruitment was based on a sample with unequal
probability of selection (to maximize racial and economic diversity)
among licensed preschools in a 3-county area in Michigan that 1)
were registered with the state Bureau of Children and Adult
Licensing, a condition for receiving federal food assistance; 2) were
located within 50 miles of the study center in one of 9 urban or
rural areas; and 3) enrolled a minimum of 10 children in the tar-
geted age range. These criteria identified 25 eligible preschools, 18
of which agreed to participate (response rate ¼ 72%). Parents of all
4e6-year-old children at each preschool were invited to complete a
questionnaire for $50.00 and asked to provide permission for their
children to be interviewed. Parents of more than 1 eligible child
were asked to choose the oldest. Of 1058 parents contacted, 278
(93% female) agreed to participate, representing a 26% response
rate; no reasons were offered for refusal. Interviews were con-
ducted with 247 of their children (50% female). Data for the 247
complete parentechild pairs are reported here.
Child age ranged from 40 to 76 months (M ¼ 56.3, SD ¼ 5.3),
with 97% (232) between 48 and 72 months. According to parent
reports, 28% (68) of children were non-Hispanic Black, 59% (145)
were non-Hispanic White, 7% (17) were Asian; 4% (11) were His-
panic; and 2% (6) were Native American Indian. Thirty-eight
percent (89) of parents were unmarried; 37% (87) reported being
enrolled in the Supplemental Food Program for Women, Infants,
and Children (WIC); 46.5% (114) had obtained less than a 4-year
college degree; and 26% (62) had enrolled their children in Head
Start. Parents indicated monthly household income by checking 1
of 14 categories from 0 to $6000; the median was $2501e$3000
($30,012e$36,000 annually). Forty-two percent of the sample re-
ported an annual income at or below the U.S. poverty threshold of
$23,550 for a family of 4 in 2013 (U.S. Dept. of Health Human
Services, 2013).
2.2. Procedure and measures
2.2.1. Parents
In addition to the demographics above, parents reported their
height in feet and inches or cm and their weight in pounds or kg.
Non-metric responses were converted and parent BMI was calcu-
lated as kg/cm2
. The median parent BMI was 25.6, with 32% of
parents having BMIs ! 30 (the U.S. adult obesity threshold).
Child obesogenic dietary intake was estimated with parent re-
ports of daily child intake of sugared beverages, French fries, fast
food, candy/sweets, and salty snacks using items from the United
States Department of Education's Early Childhood Longitudinal
Study, Birth Cohort (ECLS-B) interview protocol for 2-year-olds (U.S.
Department of Education, 2008). Predictive validity of this measure
is good; consumption of these foods was correlated with higher
rates of obesity among children participating in the ECLS-B (Flores
Lin, 2013). The item read: “The next questions ask about food
your child ate or drank during the past 7 days. Think about all the
meals and snacks your child had from the time he/she got up until
he/she went to bed. Be sure to include food your child ate at home,
preschool, restaurants, play dates, anywhere else, and over the
weekend.” Response options included 0 (my child did not eat/drink
any _____ during the past 7 days), 1 (once a day), 2 (twice a day), 3
(3 times a day), 4 (4 or more times a day), 5 (1e3 times during the
past 7 days), 6 (4e6 times during the past 7 days), and 7 (don't
know). Responses 5 and 6 were recoded as daily fractions (i.e., 1e3
times/week ¼ .2857 times/day; 4e6 times/week ¼ .7143 times/
day). Responses of 7 were treated as missing. Each food item began
“How many times did your child eat (drink)_____” and named the
food in question. An index of child daily obesogenic dietary intake
was created by adding scores for all 5 foods.
Parents also completed the Comprehensive Feeding Practices
Questionnaire (CFPQ; Musher-Eizenman Holub, 2007), a multi-
factor scale of child feeding attitudes and behaviors. The factor of
interest was Healthy Eating Guidance, comprising 11 items
reflecting parents' efforts to communicate with their preschoolers
about healthy eating (e.g., “I discuss with my child why it's
important to eat healthy foods,” “I model healthy eating for my
child by eating healthy foods myself”). Response options ranged
from 1 (never) to 5 (always). In their sample of 1013 New Zealand
parents, Haszard, Williams, Dawson, Skidmore, and Taylor (2013)
reported internal consistency of a ¼ .82. In the present sample,
a ¼ .86.
2.2.2. Children
Children were interviewed in person at their preschools. First
they completed the Placemat Protocol. The Placemat (see Fig. 1) is a
40 Â 50 laminated mat with 2 copies each of 36 food replicas ar-
ranged in 6 categories consistent with the MyPlate initiative (USDA,
2012b): vegetables, fruits, grains, milk and dairy, meat and beans,
and beverages. Some foods spanned categories (e.g., a grilled
cheese sandwich has both dairy and grain) and some did not
contain any actual ingredients from their category (e.g., Jello is
fruit-flavored but contains no fruit). The goal of categorization was
not to definitively classify foods but to give children a wide variety
of types of foods to choose from. Food models were purchased from
Nasco (www.enasco.com), a supplier of highly realistic food rep-
licas for nutrition education.
The primary criterion for choosing food models for the Placemat
Protocol was their nationwide popularity within the 6 food cate-
gories. Based on research documenting the food consumption
patterns of U.S. toddlers and preschoolers (Skinner et al., 1998),
each food model was among, or a variant of, the most popular foods
nationwide. Whenever possible, we used foods that were manu-
factured in child-sized portions. Tortilla chips, pumpkin pie, choc-
olate milk, and soda pop were only available in adult-sized
portions.
Half of the items in each category were relatively nutrient-
dense/energy-poor (i.e., “nutrient-dense” or ND) and half were
relatively energy-dense/nutrient-poor (i.e., “energy-dense” or ED).
As explained in the introduction, this dichotomy is a false one;
some foods are both ED and ND (e.g., pumpkin pie), so our ED/ND
dichotomy was not intended to be absolute, but rather a way to
K. Harrison et al. / Appetite 96 (2016) 209e218 211
4. discriminate between the kinds of foods children would choose on
average for each meal. Thus the secondary criterion for food model
selection was that foods designated as ED and ND would differ on
average on estimated energy and nutritional density. Confirming
the greater energy density on average of the foods we designated
“ED,” the total kcal of the ND foods was lower, at 1421 (x ¼ 79), than
that of the ED foods, at 4821 (x ¼ 272). Table 1 lists the food models,
their portion sizes, their energy density (kcal), and an estimate of
their nutrient density, the naturally nutrient rich (NNR) score (see
Drewnowski, (2005) for calculation).
The NNR is an average of recommended daily values of 14 nu-
trients supplied by 2000 kcal of a given food. Scores below 100 have
little nutritional value for the energy they supply; scores exceeding
1000 have high nutritional value for the same amount of energy.
Confirming the greater nutrient density on average of the foods we
designated “ND,” the total NNR of the ND foods was higher, at
188,539 (x ¼ 24,541), than that of the ED foods, at 13,861 (x ¼ 770).
As some foods can have exceptionally high NNRs due to very low
kcal combined with very high amounts of some nutrients (e.g.,
vitamin A in carrots), some nutrition researchers have recom-
mended truncating the NNR to 2000 for any individual food
(Drewnowski, 2005). Revising the values accordingly, the total
estimated NNR of the ND foods, at 19,750 (x ¼ 1097), was still
almost twice that of the ED foods, at 10,616 (x ¼ 590). We
attempted to facilitate children's ability to distinguish between the
designated ND and ED foods by naming the foods accordingly; for
example, the chicken breast was called “grilled chicken” (ND) so it
would not be mistaken for pan-fried (which would be more ED),
and the chicken nuggets were called “fried chicken nuggets” (ED)
so they would not be mistaken for baked nuggets (which would be
less ED). This strategy used minimal language adjustments to
maximize children's ability to identify and discriminate between
ND and ED foods to the extent that such an evaluative distinction
existed in their meal schemas.
At the start of the procedure each child was asked, “Are you
hungry right now?” Response options included no, a little, or a lot.
The researcher then seated the child on the mat in front of a 1000
white plate, named the foods on the mat using the exact termi-
nology in Table 1, and helped the child assemble the first
(preferred) meal. Children were told, “We're going to make a pre-
tend meal together, using the foods and drinks here. You can put a
little food on the plate, or a lot, but don't put any more than you
think you could eat at one time. Let's start by making a meal of your
FAVORITE foods. If you could pick any of these foods and
drinksdthe ones you like bestdwhich would you pick?” When the
child was finished, the plate was cleared and the procedure
repeated for the healthy meal: “Now we're going to make a
HEALTHY meal. I want you to pick foods and drinks you think are
healthy. You can use the same or different foods.” We chose not to
define “healthy” a priori to avoid priming specific schematic con-
tent. The 42 children who spontaneously asked what “healthy”
means were told “good for your body.” Feasibility pretesting with
12 children (not in the present sample) showed that when they
began the procedure by constructing the “healthy” meal first, they
chose more ED foods because the first foods they wanted to touch
were favorites like brownies and doughnuts. Thus all children in
the present sample constructed the preferred meal first, consistent
with the order used by Holub and Musher-Eizenman (2010). The
preferred meal served as a baseline against which the healthy meal
could be compared.
The Placemat procedure required approximately 20 min, after
which children completed a verbal nutrition knowledge measure
validated with U.S. children across locations and time periods
(Harrison, 2005; Signorielli Staples, 1997). This forced-choice
evaluative measure asked respondents to choose the “healthier”
food in each of 6 pairs comparing analogous ND and ED foods in the
same categories as the Placemat: baked sweet potato vs. French
fries (vegetable); apple vs. fruit roll-ups (fruit); whole-wheat bagel
vs. chocolate-chip cookie (grains); cottage cheese vs. ice cream
(dairy); chicken breast vs. fried chicken nuggets (meat and beans);
and 2% milk vs. regular Coke (beverages). Internal consistency for
the preschool sample was a ¼ .80.
Within 2 weeks of completing the Placemat Protocol, children
completed the Peabody Picture Vocabulary Test (PPVT; Dunn
Dunn, 2007), a widely used assessment of receptive language that
yields scores in national percentiles. The median PPVT percentile
for the preschool sample was 75, with 72% scoring at or above the
national 50th
percentile (Dunn Dunn, 2007). At the same visit,
child height and weight were measured twice, to the nearest 0.1 cm
and 0.1 kg, by 2 judges following CDC protocol (CDC, 2010). The
measurements were then averaged. BMI percentile was tabulated
using the CDC's BMI Tool for Schools program (National Center for
Health Statistics, 2010a, 2010b). Three percent of the sample were
in the underweight range (5th percentile), 73% were in the normal
range (5th to 85th percentile), 23% were in the overweight range
(!85th percentile), and 9% were in the obese range (!95th
percentile).
Approximately 1 week after completing the PPVT, 53 children
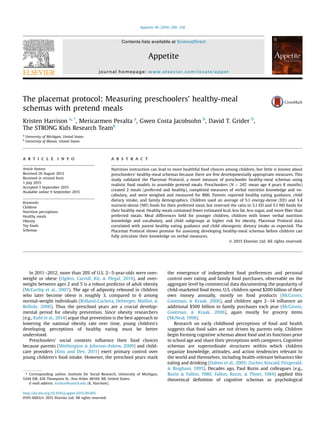
Fig. 1. Six-year-old using the Placemat Protocol to complete preferred (top) and
healthy (bottom) pretend meals. From the child's left, categories are vegetables, fruits,
grains, milk and dairy, meat and beans, and beverages. Her preferred meal features two
Jellos, two servings of cheddar cheese, two doughnuts, one brownie, one serving of
grapes, one chocolate milk, and one soda pop, containing an estimated 1420 kcal. Her
healthy meal features one fried egg, two servings of carrots, two servings of peas, one
apple, one serving of grilled chicken, one serving of beans, and one water, containing
an estimated 424 kcal.
K. Harrison et al. / Appetite 96 (2016) 209e218212
5. were randomly selected from the initial sample to complete the
Placemat Protocol a second time so we could estimate testeretest
reliability. All data collection procedures from the initial adminis-
tration of the measure were repeated the second time.
3. Results
3.1. Descriptive statistics
The food models on the Placemat appeared to be popular, as
none of them went unselected. For the preferred meal, the least
selected food was cottage cheese (chosen by 3.2%) and the most
selected was ice cream (40.8%). For the healthy meal, the least
selected food was chocolate-covered raisins (6.0%) and the most
selected was apples (44.1%). Placemat data were used to generate 4
key nutritional indicators for preferred and healthy meals: (1) total
number of food items overall and in each category; (2) number of
ED and ND items; (3) estimated energy (kcal) using the USDA Na-
tional Nutrient Database for Standard Reference (USDA, 2012a)
with the weight/volume information stamped on the bottom of
each food model; and (4) estimated protein, fat, carbohydrates, fi-
ber, and sugar using the same database.
Table 2 shows that on average, children chose just over 8 items
for each meal. Although the total number of items did not differ,
children chose significantly more ND and fewer ED foods for the
healthy meal than the preferred meal. The healthy meal also had
significantly fewer estimated kcal, less fat, more fiber, and less
carbohydrate content due primarily to less sugar. There was no
difference in estimated protein. Overall estimated nutrition differ-
ences were not driven by children's reliance on particular cate-
gories of foods (e.g., the replacement of meat in the preferred meal
with vegetables in the healthy meal), but by an overall tendency to
choose fewer ED and more ND items across all 6 food categories.
Additional analyses compared preferred and healthy nutrition
indicators for demographic subsamples. Greater obesity rates have
been recorded for African Americans (Siceloff, Coulon, Wilson,
2014), children who are already overweight (Kitzmann et al.,
2010), children in Head Start (Maher, Li, Carter, Johnson, 2008),
and children enrolled in WIC (Obeidat, Shriver, Roman-Shriver,
2010). In addition, children who scored at or below the sample's
50th percentile (chance) on the verbal nutrition knowledge mea-
sure were compared with those who scored higher, and children
who scored below the national 50th percentile on vocabulary were
compared with those who scored higher. We also compared chil-
dren by gender, age, parent healthy eating guidance, and child
obesogenic dietary intake by splitting the latter 3 variables at the
median.
Table 3 summarizes the results of paired t-tests comparing meal
characteristics for preferred and healthy meals within subsamples,
and independent-samples t-tests comparing individual character-
istics between subsamples. Healthy meals featured significantly
fewer ED foods than preferred meals for all subsamples. Healthy
meals also featured more ND foods than preferred meals for all
subsamples except Black children and children in Head Start, and
fewer kcal than preferred meals for all subsamples except children
in Head Start and children enrolled in WIC. In addition, the healthy
Table 1
Food items in the placemat protocol and estimated energy and nutrient densities.
Category ND/ED Food item Size (Â2 servings on placemat) Energy density (kcal) Nutrient density (NNR)
Vegetables ND Peas ¼ cup 15 2482
ND Carrots ½ cup 18 163,710
ND Green beans ½ cup 19 6315
ED French fries ½ cup 355 444
ED Potato salad ½ cup 163 922
ED Pumpkin pie 5.5 oz. 379 5246
Fruits ND Banana half 3 oz. 45 1272
ND Apple 4 oz. 95 894
ND Grapes 3 oz. 59 1039
ED Jello ½ cup 84 8
ED Gummy fruit snacks 26 g 89 12
ED Chocolate-covered raisins ¼ cup 191 523
Grains ND Oatmeal ½ cup 80 3607
ND Whole-grain bread 1 oz. 247 302
ND Whole-grain spaghetti ½ cup 87 110
ED Brownie 60 g 243 114
ED Doughnut 1.5 oz. 192 85
ED Tortilla chips ¾ oz. 99 240
Dairy ND String cheese (2) 2 oz. 172 1018
ND Cheddar cheese 1 oz. 113 1116
ND Cottage cheese ¼ cup 49 647
ED Cheesecake 4 ½ oz. 233 539
ED Ice cream 4 oz. 143 1023
ED Grilled cheese on white bread ½ sandwich 241 572
Meat/beans ND Sliced turkey 2 oz. 92 497
ND Grilled chicken 3 oz. 83 753
ND Kidney beans ½ cup 112 855
ED Fried chicken nuggets 3 oz. 284 184
ED Hot dog (bun and dog) 1 bun/40 g dog 264 165
ED Fried egg 1 medium 68 1657
Beverages ND Milk 4 oz. 74 2675
ND Orange juice 4 oz. 61 1247
ND Water 8 oz. 0 0
ED Fruit punch 6 fl. oz. 103 155
ED Chocolate milk 8 fl. oz. 158 1954
ED Soda pop 12 fl. oz. 182 19
Note. ND ¼ nutrient-dense; ED ¼ energy-dense. Energy density ¼ kcal for one serving. NNR ¼ the naturally nutrient rich score (Drewnowski, 2005), an estimate of a food's
concentration of 14 essential nutrients in a 2000 kcal portion.
K. Harrison et al. / Appetite 96 (2016) 209e218 213
6. meals of Black children, children in WIC, lower-nutrition-
knowledge children, and lower-vocabulary children featured
significantly more ED foods, fewer ND foods, and more estimated
kcal than their comparison groups' healthy meals. In addition,
overweight children, children in Head Start, and younger children
used significantly fewer ND foods in their healthy meals than did
their comparison groups. Lastly, children from families with lower
healthy eating guidance used more ED foods and had more esti-
mated kcal in their healthy meals than did children from families
with higher healthy eating guidance.
The 175 children who reported being hungry at the start of the
procedure used significantly more ED foods in their preferred meal
than did nonhungry children (5.33 vs. 4.54, p .05), but there were
no differences in estimated kcal in preferred or healthy meals for
hungry versus nonhungry children. Analyses on the 42 children
who asked what “healthy” means and were told “good for your
body” revealed that they assembled healthy meals with signifi-
cantly more ND foods (4.61 vs. 2.99, p .01), fewer ED foods (3.64
vs. 5.24, p .01), and fewer kcal (944 vs. 1183, p .01) than their
preferred meals, similar to the sample as a whole.
3.2. Testeretest reliability and construct validity
Validation of the Placemat Protocol was provided via 2 sets of
analyses. First, the stability of the attributes of the healthy meals
was estimated by calculating testeretest reliability coefficients for
the 53 children who completed the Placemat Protocol twice. Table 4
reports significant positive correlations for the total number of
foods, the number of ED and ND foods, and estimated kcal, fat,
carbohydrates, and sugars. Estimated protein and fiber in the first
healthy meal were not correlated with the same nutrients in the
second healthy meal. Children who chose fruits the first time were
likely to choose fruits the second time; otherwise, correlations
were driven primarily by consistency in the nutritional attributes of
foods, especially vegetables, dairy, and fruits. Analyses on individ-
ual food items indicated significant (p .05) coefficients for
pumpkin pie (r ¼ .51), bananas (r ¼ .29), grapes (r ¼ .28), cottage
cheese (r ¼ .56), cheesecake (r ¼ .41), beans (r ¼ .30), orange juice
(r ¼ .58), and water (r ¼ .33). Otherwise, choosing a particular food
the first time did not increase the chance of choosing it the second
time. The moderate consistency in ED and ND portions, estimated
kcal, fat, carbohydrates, and sugar despite inconsistency in specific
food selections across the 2 sessions suggests that preschoolers
took a somewhat holistic approach to the construction of healthy
pretend meals. Since the preferred meal was assessed only as a
baseline and the task asked, “If you could pick any of these foods
and drinksdthe ones you like bestdwhich would you pick,” test-
retest reliability coefficients were not expected to be high for the
preferred meal due to day-to-day fluctuations in appetite and the
allure of particular foods; thus testeretest correlations are not re-
ported for the preferred meal.
Construct validation was estimated by assessing the relationship
between key Placemat Protocol indicators, verbal nutrition
knowledge, and child and family variables expected to predict both
Placemat Protocol data and verbal nutrition knowledge in specific
directions. To begin, verbal nutrition knowledge was used to pre-
dict key Placemat Protocol data indicators using hierarchical mul-
tiple regression analyses. Controlling parent BMI, household
income, parent education, child BMI percentile, and the ED-to-
total-foods ratio in children's preferred meals, their verbal
Table 2
Average number of food items and estimated nutrients in preferred (P) and healthy (H) meals, by category (N ¼ 247).
Overall Vegetables Fruits Grains Dairy Meat/Beans Beverages
P H P H P H P H P H P H P H
Items (#) 8.2 8.5 1.2* 1.7* 2.0 2.0 1.3 1.2 1.1 .9 1.3 1.2 1.4 1.5
ED (#) 5.1* 3.4* .6 .5 .7* .4* 1.0* .6* .8* .5* 1.0* .8* 1.0* .6*
ND (#) 3.1* 5.1* .7* 1.3* 1.3* 1.5* .3* .5* .3* .4* .2* .5* .3* .9*
Protein (g) 31.2 30.1 3.1 3.1 1.5 1.3 3.7 3.3 6.3 6.0 12.2 12.9 4.4* 3.5*
Fats (g) 42.8* 34.0* 7.7 6.0 .9 1.0 8.6* 5.2* 11.1 9.5 12.9* 10.2* 1.6* 2.1*
Carb. (g) 166.3* 133.3* 25.1 21.2 42.0 38.8 31.1* 22.0* 16.1* 10.8* 16.3 15.0 35.7* 25.6*
Fiber (g) 9.9* 11.1* 2.5* 3.1* 3.1* 3.8* 1.9 2.0 .6* .4* 1.3 1.6 .6* .3*
Sugar (g) 103.1* 76.2* 10.0 7.7 31.9 29.0 13.8* 6.7* 12.6* 7.9* 1.4 1.2 33.4* 23.8*
kcal 1153* 938* 181 150 173 157 210* 144* 186 150 232 205 171* 132*
Note. # ¼ number. ED ¼ energy-dense. ND ¼ nutrient-dense. kcal ¼ kilocalories. Carb. ¼ carbohydrates. kcal are entered in whole numbers and nutrition data rounded to
tenths to facilitate readability. Significant (p .05) differences by within-samples t-test between analogous P and H indicators (paired in rows) overall and within each
category are noted by asterisks (*).
Table 3
Number of energy-dense (ED) and nutrient-dense (ND) food items and estimated
kcal in children's preferred and healthy meals, by sample subgroups.
Preferred meal Healthy meal
ED ND kcal ED ND kcal
Child racial group
Black (n ¼ 68) 5.2a
3.71
1213c
4.2a,1
4.41
1082c,1
Not (n ¼ 172) 5.1a
2.9b,1
1137c
3.1a,1
5.3b,1
882c,1
Child overweight
Yes (n ¼ 55) 5.3a
2.9b
1199c
3.9a
4.5b,1
1002c
No (n ¼ 185) 5.1a
3.2b
1146c
3.3a
5.3b,1
928c
Child in Head Start
Yes (n ¼ 62) 4.8a
3.5 1112 3.8a
4.31
992
No (n ¼ 178) 5.3a
3.0b
1178c
3.3a
5.4b,1
923c
Family receiving WIC
Yes (n ¼ 87) 5.2a
3.6b,1
1190 4.3a,1
4.5b,1
11221
No (n ¼ 142) 5.2a
2.9b,1
1155c
2.9a,1
5.5b,1
833c,1
Child verbal nutrition knowledge
50% (n ¼ 111) 5.6a,1
3.3b
1245c,1
4.3a,1
4.5b,1
1092c,1
50% (n ¼ 136) 4.7a,1
3.0b
1077c,1
2.6a,1
5.6b,1
812c,1
Child vocabulary
50% (n ¼ 66) 5.6a
3.3b
1263c
4.3a,1
4.4b,1
1087c,1
!50% (n ¼ 170) 5.0a
3.1b
1133c
3.1a,1
5.4b,1
902c,1
Child age
40e55 months (n ¼ 112) 5.0a
3.3b
1146c
3.7a
4.4b,1
963c
56e76 months (n ¼ 125) 5.3a
3.1b
1183c
3.2a
5.8b,1
942c
Child gender
Female (n ¼ 124) 4.7a,1
2.9b
1078c,1
3.2a
5.0b
893c
Male (n ¼ 118) 5.5a,1
3.4b
1245c,1
3.6a
5.2b
994c
Parent healthy eating guidance
Lower (n ¼ 113) 5.3a
3.4b
1193c
3.9a,1
4.8b
1037c,1
Higher (n ¼ 129) 5.0a
3.0b
1130c
3.0a,1
5.4b
859c,1
Child obesogenic dietary intake
Lower (n ¼ 124) 5.1a
3.1b
1162c
3.3a
5.0b
915c
Higher (n ¼ 109) 5.1a
3.4b
1138c
3.6a
5.2b
994c
Note. Horizontal pairs of means that share a letter superscript (a, b, or c) differ
significantly by within-samples t-test (p .05). Vertical pairs of means that share a
number superscript (1) differ significantly by independent-samples t-test (p .05).
T-tests were not adjusted for multiple comparisons. Child age, parent healthy eating
guidance, and child obesogenic dietary intake were split at the median.
K. Harrison et al. / Appetite 96 (2016) 209e218214
7. nutrition knowledge independently predicted the ED-to-total-
foods ratio in children's healthy meals, R2
D ¼ .12, b ¼ À.36, F(1,
198) ¼ 29.17, p .001; healthy meal total kcal, R2
D ¼ .05, b ¼ À.24,
F(1, 198) ¼ 11.73, p .01; healthy meal total fat, R2
D ¼ .04, b ¼ À.21,
F(1, 198) ¼ 9.26, p .01; and healthy meal total sugar, R2
D ¼ .04,
b ¼ À.21, F(1, 198) ¼ 8.76, p .01. Repeating these analyses with
vocabulary added to the controls, the coefficients dropped to
b ¼ À.28 (p .001), b ¼ À.19 (p .05), b ¼ À.17 (p .05), and
b ¼ À.16 (p .05) respectively, smaller but still meaningful. This
suggests that verbal nutrition knowledge correlated with key Pla-
cemat healthy-meal indicators as expected, and that this correla-
tion was not entirely driven by vocabulary. Thus both measures
appear to reflect some degree of genuine nutritional knowledge,
signaled either verbally (verbal nutritional knowledge) or nonver-
bally (via the food choices on the Placemat).
Further construct validation was provided by entering parent
healthy eating guidance, child obesogenic dietary intake, and vo-
cabulary simultaneously on the second step of hierarchical linear
regression analyses with controls from the previous analysis on the
first step. Criterion variables were verbal nutrition knowledge, the
ED-to-total-foods ratio in the healthy meal, and estimated healthy-
meal kcal, fat, and sugar. Table 5 summarizes these analyses. Vo-
cabulary positively predicted verbal nutrition knowledge as ex-
pected. However, healthy eating guidance and obesogenic dietary
intake were unrelated to verbal nutrition knowledge. In contrast,
healthy eating guidance predicted significant reductions in ED-to-
total foods, calories, fat, and sugar in the Placemat healthy meal.
These relationships were modest but statistically meaningful and in
the direction expected for children receiving healthy eating guid-
ance at home. In contrast, obesogenic dietary intake predicted
significant increases in estimated kcal and fat in the Placemat
healthy meal. Vocabulary predicted some Placemat indicators in
the direction one would expect from a richer conceptualization of
the meaning of “healthy,” with higher scorers assembling healthy
meals with fewer ED-to-total foods, fewer estimated kcal, and less
sugar. We would therefore be remiss in suggesting that the Place-
mat Protocol is not dependent to some degree on vocabulary.
However, the Placemat indicators were predicted by family vari-
ables in ways the verbal nutrition knowledge measure was not, and
the Placemat appeared to be less dependent on vocabulary for
successful completion. In summary, the Placemat Protocol
appeared to capture emerging healthy-meal schematic information
that some children were not able to translate into expressions of
valid nutrition knowledge on the verbal nutrition knowledge
measure.
4. Discussion
Using the Placemat Protocol, most preschoolers in this study
assembled healthy pretend meals with more ND foods, fewer ED
foods, more estimated fiber, and less estimated fat, carbohydrates,
sugar, and kcal than their preferred meals. It is highly unlikely that
children's selections reflected knowledge of the nutrient and en-
ergy content of the food items provided; rather, their healthy-meal
selections more likely reflected an emerging schematic distinction
between “healthy” and other foods based on observable attributes
like apparent sweetness or richness. The average nutritional profile
of each meal (Tables 2 and 3) captured children's ability to distin-
guish ED and ND foods across all food categories, even if the con-
cepts of “energy density” and “nutrient density” were not salient to
children when assembling their meals.
Healthy eating guidance predicted a small but significant
decrease in the energy density of preschoolers' healthy meals. Thus
preschoolers' emerging healthy-meal schemas likely reflect
Table 4
Testeretest correlations between healthy-meal nutrition indicators at time 1 and corresponding indicators at time 2 (n ¼ 53).
Overall Vegetables Fruits Grains Dairy Meat/Protein Beverages
Total items .37* .00 .35* .18 .24 .07 .09
ED items .35* .33* .23 .19 .45* .02 .02
ND items .30* À.07 .46* .09 .16 .14 .28*
Protein .26 .31* .42* .09 .27 .04 .11
Fats .49* .37* .12 .16 .40* À.06 .07
Carbohydrate .38* .39* .18 .11 .47* .09 .04
Fiber .25 .06 .24 .12 .39* .25 .21
Sugars .35* .50* .20 .01 .42* À.11 .01
kcal .46* .38* .17 .13 .42* À.01 .04
Note. ED ¼ energy-dense. ND ¼ nutrient-dense. Correlations represent the association between the same variable measured at two separate sessions for the test-retest
subsample of 53 children (e.g., dairy fat at time 1 was correlated at r ¼ .40 with dairy fat at time 2). *p .05.
Table 5
Hierarchical multiple regression analyses predicting verbal nutrition knowledge and key healthy-meal nutrition indicators (n ¼ 200).
Predictor Verbal NK ED to total Calories Fat Sugar
DR2
b DR2
b DR2
b DR2
b DR2
b
Step 1: .09** .08** .09** .10*** .04
Parent BMI À.11 .08 À.03 À.01 À.04
Household income .15 .01 À.23* À.20* À.13
Parent education À.04 À.13 .03 À.03 .06
Child BMI percentile .02 À.06 À.05 À.09 .03
ED to total, preferred À.01 À.04 .06 .00 .08
Step 2: .09*** .12*** .06** .08*** .04*
Healthy eating guidance .08 À.21** À.14* À.15* À.16*
Obesogenic dietary intake .04 À.04 .15* .17* .06
Vocabulary .31*** À.19* À.17* À.14 À.16*
Total R2
.18*** .20*** .15*** .18*** .08**
Note. Betas for all variables are from the final step of the model. For Step 1, the baseline model, DR2
¼ baseline R2
. Verbal NK ¼ verbal nutrition knowledge. “ED to Total” refers
to the proportion of total foods in the healthy meal that were energy-dense. “ED to total, preferred” refers to the same proportion in the preferred meal. *p .05. **p .01.
***p .001.
K. Harrison et al. / Appetite 96 (2016) 209e218 215
8. parental instruction about healthy meals containing fewer sweet-
or rich-looking foods across multiple food categories, from fruits to
meats to beverages. Indeed, some of the foods on the Placemat may
have been discussed at home. It is possible that some of the pre-
schoolers in our sample had been introduced to nutritional rules
like “baked, not fried,” but unlikely that such rules drove the
choices of the majority. Importantly, the Placemat Protocol data
suggest that preschoolers can identify relatively healthful food
choices before they can articulate the reasoning behind those
choices. When they are allowed to see, touch, and place realistic
food facsimiles on a plate and assemble pretend meals in a holistic
fashion, they can indicate their developing schematic knowledge
through the sum of their choices. Even though some children had
ND foods on the preferred meal plate and ED foods on the healthy
meal plate (see example in Fig. 1), the nutritional estimates at the
meal level revealed an early understanding that “healthy” meals
are, overall, relatively limited in energy density.
Test-retest reliability data (Table 4) reveal moderate consistency
between the healthy meals assembled by the same children at two
points in time. It would be unrealistic to expect children to
remember and duplicate their exact food choices a week later, so
variation in selection was expected. Given the great variation in
children's selection of specific foods, it is noteworthy that moderate
correlations were observed between the first and second healthy
meals for the total number of food items, the number of ED and ND
items, and the estimated kcal, fat, carbohydrate, and sugar content.
The possibility that children take a holistic view of healthy meals
early in life and assemble them accordingly, relying less on decision
rules about specific foods and food categories and more, perhaps,
on rules about apparent sweetness or richness across all food cat-
egories, is a prime research topic for future investigations, both
quantitative and qualitative. As our data do not supply the reasons
behind children's choices, studies gathering this information would
supply valuable details about children's healthy-meal schemas and
even their broader mental models of healthy eating and obesity
(Ogden et al., 2001).
Despite its promise as a tool for capturing evaluative aspects of
early healthy-meal schema development, there are some important
limitations to the Placemat Protocol. First, the food models'
ecological fidelity to real-world meals is not 100%; they do not
smell like real food and may not look like similar foods consumed
by children in real life. Second, the practice of having children
assemble a preferred-foods meal before their healthy-foods meal
introduced potential order effects. In feasibility testing prior to this
study, we observed children being attracted to highly desirable
foods like brownies and doughnuts at the start of the activity,
whether they were completing the preferred meal or the healthy
meal first. Thus we chose to administer the preferred meal before
the healthy meal for all children rather than counterbalancing the
meal order. In subsequent investigations, alternative strategies will
be tested (e.g., giving all children a 5-min period to play with the
food models before completing the meal tasks in random order).
Third, the meals do not necessarily represent what children
actually eat. The average “healthy” meal in this study contained
more than eight food items and almost 1000 kcal. Research on
children's food plating preferences points to an average of seven
items and six colors compared to three items and three colors for
adults (Zampollo, Kniffin, Wansink, Shimuzu, 2011), so although
children emphasize variety when plating foods, they may not aim
for variety when eating. Still, increased variety and larger portion
sizes of real foods predict greater intake among children and adults
(Wansink, 2006), so more ED foods on the plate would likely pre-
dict consumption of more ED foods in real life. A test of the Pla-
cemat Protocol's predictive validity for actual food selection and
consumption will be essential before claims can be made about its
utility for predicting dietary intake. In addition, future research will
need to substitute food items to confirm that the findings reported
here were not specific to the foods we used. The Placemat Protocol
was designed around the evaluative distinction between ED and ND
foods so researchers could adapt it to different groups and regions
by replacing some food items with other items that are regularly
eaten by the population under consideration. As long as the
distinction between ED and ND foods is maintained, the measure
should continue to work. We encourage researchers interested in
using the measure to devote some of their efforts to validation
whenever they replace food items.
Fourth, the baseline against which the healthy meal was vali-
dated was a preferred meal, not a “typical” meal. Therefore,
although the healthy meal was lower in fat, sugar, and energy than
the preferred meal, it was impossible to determine which of these
meals is more like the meal a child might construct if asked what he
or she ordinarily eats at mealtime. Were the healthy meals more
healthful than children's typical meals? Were the preferred meals
less healthful? There is so much variation in family eating patterns
that asking about typical meals was not feasible given the need to
constrain the number of foods on the Placemat to a manageable
quantity. Relatedly, we had no data on children's exposure to
nutritional curricula in their preschools, so we were unable to test
differences between children with more and less established
nutritional knowledge. Further research is needed to understand
how preschoolers' healthy-meal schemas compare with their
typical-meal schemas (along with schematic differences between
breakfast, lunch, and dinner), to determine whether they perceive a
difference between what they usually eat and what they consider
healthy.
Finally, the differences and relationships observed in this study
were modest. However, minor substitutions in dietary intake can
result in significant change (e.g., 100 kcal/day equaling about
10 lbs./year, see Harris, Bargh, Brownell, 2009), so complete di-
etary overhaul is not needed to reduce a child's obesity risk. Do
minor differences in preschooler healthy-meal schemas translate to
differences in dietary intake in elementary school when children
have more control over their food intake? This too is a question for
future research focused on predictive validity assessment.
4.1. Implications for research and practice
The need for targeted intervention has been demonstrated in
research on racial and socioeconomic disparities in nutrition
knowledge and dietary intake (Fahlman, McCaughtry, Martin,
Shen, 2010). The Placemat Protocol may be useful for assessing
evaluative aspects of emerging healthy-meal schemas of children in
vulnerable groups because it can be adapted to different racial/
ethnic populations by administering a preliminary audit of com-
munity food intake for the targeted sample and choosing food
models accordingly. The food-model supplier for this study pro-
duces a wide array of food replicas including many foods consumed
primarily by ethnic subpopulations; for example, the company
website features a “Native American Food Set” with fry bread and
squash. Adaptability to regional food preferences is a useful feature
of the measure given elevated child obesity rates among groups
with different dietary traditions such as African Americans (Campo
Mastin, 2007) and Latino/as (Davis et al., 2007). Our decision to
use nationwide data on preschooler food preferences (Skinner
et al., 1998) to choose our food models for the initial validation
was successful, as each food on the Placemat was chosen by at least
four children in the sample. However, as long as a distinction is
maintained between ED and ND foods in each category, food items
may be substituted without the measure losing its power to capture
emerging evaluative perceptions of the ED/ND distinction.
K. Harrison et al. / Appetite 96 (2016) 209e218216
9. The Placemat Protocol's utility for meeting practical goals such
as child or family nutrition education and intervention is unknown.
Its promise at this point lies in its capacity to reveal preschoolers'
schematic distinctions between preferred and healthy meals before
they are old enough to articulate their nutrition knowledge
verbally. Since the children most vulnerable to obesity in the U.S.
are often those with the most limited verbal skills (Maher et al.,
2008), measures that capture healthy-meal perceptions without
relying exclusively on language as the medium for knowledge
transmission are optimal for accessing mental models of healthy
meals as early in life as possible. Given increased emphasis on
early-childhood prevention (Kuhl et al., 2014) for lowering the rate
of child obesity nationwide, the Placemat Protocol's capacity to
yield information about children's earliest perceptions of what
healthy meals look like could, pending further evaluation, make it a
promising tool for devising strategies to teach children and their
families plating strategies using the types of foods they already eat.
Author note
Development of the Placemat Protocol was funded in part by the
Illinois Council of Food and Agriculture Research, the Illinois
Department of Human Services, and the USDA. The STRONG Kids
Research Team includes Kelly K. Bost, Brent A. McBride, Sharon M.
Donovan, Diana S. Grigsby-Toussaint, Janet M. Liechty, Angela
Wiley, Margarita Teran-Garcia, Barbara Fiese, and Dipti A. Dev.
Thanks to Sarah Brennan, Jennifer Buechel, Evan Carpenter, Rachel
Hamden, Ana Hauser, Jessica Kaltz, Dugan Kemple, Jane Kim, Julia
Lipowski, Jennifer Park, Elisse Rodriguez, Anna Spigelman, Nicole
Tung, Hannah Weiner, Viktoria Krislaty, Benjamin Mirsky, Alana
Tabak, Joseph Gonzalez, Julie Dressler, Kathryn Clappison, Adam
Goldman, Sarah Loeb, and Lauryn Hong for assistance with data
collection.
References
Amari, A., Dahlquist, L., Kossoff, E. H., Vining, E. P. G., Trescher, W. H., Slifer, K. J.
(2007). Children with seizures exhibit preferences for foods compatible with
the ketogenic diet. Epilepsy Behavior, 11, 98e104. http://dx.doi.org/10.1016/j.
yebeh.2007.04.005.
Baskale, H., Bahar, Z. (2011). Outcomes of nutrition knowledge and healthy food
choices in 5e6-year-old children who received a nutrition intervention based
on Piaget's theory. Journal for Specialists in Pediatric Nursing, 16, 263e279.
http://dx.doi.org/10.1111/j.1744-6155.2011.00300.x.
Campo, S., Mastin, T. (2007). Placing the burden on the individual: overweight
and obesity in African American and mainstream women's magazines. Health
Communication, 22(3), 229e240. http://dx.doi.org/10.1080/
10410230701626885.
Centers for Disease Control and Prevention. (2010). Measuring children's height and
weight accurately at home. Retrieved July 26, 2010, from http://www.cdc.gov/
healthyweight/assessing/bmi/childrens_bmi/measuring_children.html#Height.
Cespedes, J., Brice~no, G., Farkouh, M. E., Vedanthan, R., Baxter, J., Leal, M., et al.
(2013). Targeting preschool children to promote cardiovascular health: cluster
randomized trial. American Journal of Medicine, 126(1), 27e35. http://dx.doi.org/
10.1016/j.amjmed.2012.04.045.
Contento, I. R. (2011). Nutrition education: Linking research, theory, and practice (2nd
ed.). Sudbury, MA: Jones and Bartlett Publishers.
Dalton, M. A., Bernhardt, A. M., Gibson, J. J., Sargent, J. D., Beach, M. L., Adachi-
Mejia, A. M., et al. (2005). Use of cigarettes and alcohol by preschoolers while
role-playing as adults: “honey, have some smokes”. Archives of Pediatric and
Adolescent Medicine, 159(9), 854e859. http://dx.doi.org/10.1001/
archpedi.159.9.854.
Davis, J. N., Ventura, E. E., Alexander, K. E., Salquero, L. E., Weigensberg, M. J.,
Crespo, N. C., et al. (2007). Feasibility of a home-based versus classroom-based
nutrition intervention to reduce obesity and type 2 diabetes in Latino youth.
International Journal of Pediatric Obesity, 2(1), 22e30. http://dx.doi.org/10.1080/
17477160601133077.
Drewnowski, A. (2005). Concept of a nutritious food: toward a nutrient density
score. American Journal of Clinical Nutrition, 82(4), 721e732.
Dunn, L. M., Dunn, D. M. (2007). Peabody picture vocabulary test (PPVT-4) (4th
ed.). Minneapolis, MN: Pearson Assessments.
Fahlman, M. M., McCaughtry, N., Martin, J., Shen, B. (2010). Racial and socioeco-
nomic disparities in nutrition behaviors: targeted interventions needed. Journal
of Nutrition Education and Behavior, 42(1), 10e16. http://dx.doi.org/10.1016/
j.jneb.2008.11.003.
Fallon, A. E., Rozin, P., Pliner, P. (1984). The child's conception of food: the
development of food rejections with special reference to disgust and contam-
ination sensitivity. Child Development, 55(2), 566e575. http://dx.doi.org/
10.2307/1129968.
Flores, G., Lin, H. (2013). Factors predicting severe childhood obesity in kinder-
garteners. International Journal of Obesity, 37, 31e39. http://dx.doi.org/10.1038/
ijo.2012.168.
Harris, J. L., Bargh, J. A., Brownell, K. D. (2009). Priming effects of television food
advertising on eating behavior. Health Psychology, 28(4), 404e413. http://
dx.doi.org/10.1037/a0014399.
Harrison, K. (2005). Is ‘fat free’ good for me? A panel study of television viewing and
children's nutritional knowledge and reasoning. Health Communication, 17(2),
117e132. http://dx.doi.org/10.1207/s15327027hc1702_1.
Haszard, J. J., Williams, S. M., Dawson, A. M., Skidmore, P. M., Taylor, R. W. (2013).
Factor analysis of the comprehensive feeding practices questionnaire in a large
sample of children. Appetite, 62, 110e118. http://dx.doi.org/10.1016/
j.appet.2012.11.017.
Holub, S. C., Musher-Eizenman, D. R. (2010). Examining preschoolers' nutrition
knowledge using a meal creation and food group classification task: age and
gender differences. Early Child Development and Care, 180, 787e798.
Kandiah, J., Jones, C. (2002). Nutrition knowledge and food choices of elementary
school children. Early Child Development and Care, 172(3), 269e273. http://
dx.doi.org/10.1080/03004430212123.
Kim, J., Dev, D. (2011). Child care nutrition environment: is it related to children's
fruit and vegetable intake? Journal of the Federation of American Societies for
Experimental Biology, 25, 232e233.
Kitzmann, K. M., Dalton, W. T., Stanley, C. M., Beech, B. M., Reeves, T. P., Buscemi, J.,
et al. (2010). Lifestyle interventions for youth who are overweight: a meta-
analytic review. Health Psychology, 29(1), 91e101. http://dx.doi.org/10.1037/
a0017437.supp (Supplemental).
Kuhl, E. S., Clifford, L., Bandstra, N., Rausch, J., Yeomans-Maldonado, G., Stark, L. J.
(2014). Brief report: examination of the association between lifestyle behavior
changes and weight outcomes in preschoolers receiving treatment for obesity.
Health Psychology, 33, 95e98.
Lakshman, R. R., Sharp, S. J., Ong, K. K., Forouhi, N. G. (2010). A novel school-based
intervention to improve nutrition knowledge in children: cluster randomized
controlled trial. BMC Public Health, 10, 123. http://dx.doi.org/10.1186/1471-2458-
10-123.
Lynch, M. (2012). Familiarizing with toy food: preliminary research and future di-
rections. Journal of Nutrition Education and Behavior, 44(6), 639e643. http://
dx.doi.org/10.1016/j.jneb.2011.01.012.
Maher, E. J., Li, G., Carter, L., Johnson, D. B. (2008). Preschool child care partici-
pation and obesity at the start of kindergarten. Pediatrics, 122(2), 322e330.
http://dx.doi.org/10.1542/peds.2007-2233.
Matheson, D., Spranger, K., Saxe, A. (2002). Preschool children's perceptions of
food and their food experiences. Journal of Nutrition Education and Behavior, 34,
85e92. http://dx.doi.org/10.1016/S1499-4046(06)60073-0).
McCarthy, A., Hughes, R., Tilling, K., Davies, D., Smith, G. D., Ben-Shlomo, Y. (2007).
Birth weight; postnatal, infant, and childhood growth; and obesity in young
adulthood: evidence from the Barry Caerphilly growth study. American Journal
of Clinical Nutrition, 86, 907e913. Retrieved from http://ajcn.nutrition.org/
content/86/4/907.long.
McConahy, K. L., Smiciklas-Wright, H., Mitchell, D. C., Picciano, M. F. (2004).
Portion size of common foods predicts energy intake among preschool-aged
children. Journal of the American Dietetic Association, 104, 975e979. http://
dx.doi.org/10.1016/j.jada.2004.03.027.
McGinnis, J. M., Gootman, J. A., Kraak, V. I. (Eds.). (2006). Institute of Medicine. Food
marketing to children and youth: threat or opportunity?. Washington, D. C: Na-
tional Academies Press.
McNeal, J. (1998). Tapping the three kids' markets. American Demographics, 20,
37e41.
Musher-Eizenman, D., Holub, S. (2007). Comprehensive feeding practices ques-
tionnaire: validation of a new measure of parental feeding practices. Journal of
Pediatric Psychology, 32, 960e972. http://dx.doi.org/10.1093/jpepsy/jsm037.
National Center for Health Statistics. (2000a). 2e20 years: Boys stature-for-age and
weight-for age percentiles. Atlanta, GA: Centers for Disease Control and Pre-
vention. Retrieved August 11, 2010, from http://www.cdc.gov/growthcharts/
data/set1clinical/cj41c021.pdf.
National Center for Health Statistics. (2000b). 2e20 years: Girls stature-for-age and
weight-for age percentiles. Atlanta, GA: Centers for Disease Control and Pre-
vention. Retrieved August 11, 2010, from http://www.cdc.gov/growthcharts/
data/set1clinical/cj41c022.pdf2.
Nguyen, S. P. (2007). An apple a day keeps the doctor away: children's evaluative
categories of food. Appetite, 48, 114e118. http://dx.doi.org/10.1016/
j.appet.2006.06.001.
Nguyen, S. P., Gordon, C. L., McCullough, M. B. (2011). Not as easy as pie. Disen-
tangling the theoretical and applied components of children's health knowl-
edge. Appetite, 56, 265e268. http://dx.doi.org/10.1016/j.appet.2011.01.008.
Obeidat, B. A., Shriver, B. J., Roman-Shriver, C. R. (2010). Factors involved in the
persistence of overweight among children enrolled in the supplemental food
program for women, infants, and children. Maternal and Child Health Journal,
14(2), 164e173. http://dx.doi.org/10.1007/s10995-009-0457-2.
Ogden, J., Bandera, I., Cohen, H., Farmer, D., Hardie, J., Minas, H., et al. (2001).
General practitioners' and patients' models of obesity: whose problem is it?
K. Harrison et al. / Appetite 96 (2016) 209e218 217
10. Patient Education Counseling, 44(3), 227e233. http://dx.doi.org/10.1016/
S0738-3991(00. http://dx.doi.org/10.1016/S0738-3991(00)00192-0.
Ogden, C. L., Carroll, M. D., Kit, B. K., Flegal, K. M. (2014). Prevalence of childhood
and adult obesity in the United States, 2011e2012. JAMA, 311(8), 806e814.
http://dx.doi.org/10.1001/jama.2014.732.
Rolland-Cachera, M. F., Deheeger, M., Maillot, M., Bellisle, F. (2006). Early adiposity
rebound: causes and consequences for obesity in children and adults. Interna-
tional Journal of Obesity, 30, S11eS17. http://dx.doi.org/10.1038/sj.ijo.0803514.
Rozin, P., Fallon, A. E. (1980). The psychological categorization of foods and non-
foods: a preliminary taxonomy of food rejections. Appetite, 1, 193e201.
Siceloff, E. R., Coulon, S. M., Wilson, D. K. (2014). Physical activity as a mediator
linking neighborhood environmental supports and obesity in African Ameri-
cans in the path trial. Health Psychology, 33, 481e489.
Signorielli, N., Staples, J. (1997). Television and children's conceptions of nutrition.
Health Communication, 9, 289e301. http://dx.doi.org/10.1207/
s15327027hc0904_1.
Singleton, J. C., Achterberg, C. L., Shannon, B. M. (1992). Role of food and nutrition
in the health perceptions of young children. Journal of the American Dietetic
Association, 92, 67e70.
Skinner, J., Carruth, B. R., Moran III, J., Houck, K., Schmidhammer, J., Reed, A., et al.
(1998). Toddlers' food preferences: concordance with family members' prefer-
ences. Journal of Nutrition Education, 30, 17e22. http://dx.doi.org/10.1016/
S0022-3182(98)70270-5.
Swanson, M., Shoenberg, N. E., Davis, R., Wright, S., Dollarhide, K. (2013). Per-
ceptions of healthful eating and influences on the food choices of Appalachian
youth. Journal of Nutrition Education and Behavior, 45, 147e153.
United States Department of Education. (2008). Early Childhood Longitudinal Study,
Birth Cohort (ECLS-B): Longitudinal 8-month-preschool restricted-use data file
(NCES-2008-024). Washington, D. C.: National Center for Education Statistics,
Institute of Educational Sciences, U. S. Department of Education.
United States Department of Agriculture. (2012a). USDA national nutrient database
for standard reference Accessed 01.06.12 at http://ndb.nal.usda.gov.
United States Department of Agriculture. (2012b). Health and nutrition information
for preschoolers. Retrieved September 21, 2012, from www.choosemyplate.gov/
preschoolers.html.
United States Department of Health and Human Services. (2013). 2013 poverty
guidelines. Retrieved July 25, 2013, from http://aspe.hhs.gov/poverty/13poverty.
cfm#thresholds.
Uttal, D. H., Liu, L. L., DeLoache, J. S. (2003). Taking a hard look at concreteness: do
concrete objects help young children learn symbolic relations? In L. Balter,
C. S. Tamis-LeMonda (Eds.), Child psychology: A handbook of contemporary issues
(pp. 177e192). New York, NY: Psychology Press.
Wansink, B. (2006). Mindless eating: Why we eat more than we think. New York, NY:
Bantam-Dell.
Wethington, E., Johnson-Askew, W. L. (2009). Contributions of the life course
perspective to research on food decision-making. Annals of Behavioral Medicine,
38(Suppl. 1), S74eS80. http://dx.doi.org/10.1007/s12160-009-9123-6.
Zampollo, F., Kniffin, K. M., Wansink, B., Shimuzu. (2011). Food plating preferences
of children: the importance of presentation on desire for diversity. Acta Pae-
diatrica, 101, 61e66. http://dx.doi.org/10.1111/j.1651-2227.2011.02409.x.
Zucher, R. A., Kincaid, S. B., Fitzgerald, H. E., Bingham, C. R. (1995). Alcohol schema
acquisition in preschoolers: differences between children of alcoholics and
children of nonalcoholics. Alcohol: Clinical and Experimental Research, 19(4),
1011e1017. http://dx.doi.org/10.1111/j.1530-0277.1995.tb00982.x.
K. Harrison et al. / Appetite 96 (2016) 209e218218