лекция 4 биосенсоры

This document summarizes fluorescent biosensors for intracellular signaling molecules. It describes various types of biosensors including GFP-based sensors that change brightness or use FRET to report on analytes like pH, calcium, cyclic nucleotides. Translocation sensors are described that detect protein movement from cytosol to membranes or nuclei in response to signals. Photoconvertible proteins like Dendra are presented as tools to visualize protein degradation. The mechanisms and applications of FRET-based, single fluorescent protein, and circularly permuted fluorescent protein sensors are outlined. Examples demonstrate calcium, kinase, and redox signaling biosensors. Imaging with HyPer revealed hydrogen peroxide production occurs locally near receptor tyrosine kinases and does not diffuse far within cells. A dual

Recommandé
Contenu connexe
Tendances
Tendances (20)
En vedette
En vedette (8)
Similaire à лекция 4 биосенсоры
Similaire à лекция 4 биосенсоры (20)
Plus de nizhgma.ru
Plus de nizhgma.ru (20)
Dernier
Dernier (20)
лекция 4 биосенсоры
- 2. GFP-based intracellular biosensors Biosensors for pH, Cl-, Ca2+, cAMP, cGMP, enzymes, H2O2 usually change brightness or FRET
- 4. Schematic representation of the mechanism of a translocation-based biosensor
- 5. Translocation Biosensors – Tools for Signaling Pathway Analysis Translocation of a proteins from the cytosol to receptor complexes at the plasma membrane: - kinase receptors activation Akt3-GFP in untreated cells (upper) and in activated cells (lower). Akt3 is a serine/threonine kinase that plays a key in regulating cell survival, insulin signaling, angiogenesis and tumor formation.
- 6. Translocation Biosensors – Tools for Signaling Pathway Analysis Translocation of a proteins from cytosol to nucleus: - transcription factor activation - caspase activation (apoptose) Translocation of HIF-1a – GFP fusion protein from the cytosol (a) to the nucleus (b) in response to PDT. Photodynamic therapy-mediated hypoxia-independent activation of the hypoxia inducible factor 1a (HIF-1a) pathway.
- 7. Dendra - a monomeric mutant of greento-red photoconvertible FP from Dendronephthya Dendronephthya sp. 300 400 500 600 Wavelength, nm Gurskaya et al. Nat. Biotech. 2006 700
- 8. Visualization of target protein degradation using Dendra2 photoactivatable protein Green fluorescence intensity depends on both protein synthesis and degradation Expression of Dendra2-tagged protein Dendra2 photoconversion in whole cell Time-lapse Red fluorescence intensity depends only on protein degradation t0 t1 ... tn Quantification Red 1 fluorescence 0.5 1/2 Time
- 9. FRET-based biosensors Molecular sensors (pH, Ca2+, cAMP, kinases, redox, H2O2, etc.) on the base of FRET or brightness changes. (a) Biosensors based on a ligand-dependent protein–protein interaction. Cameleons (based on a fusion of calmodulin and M13) and GTPase biosensors (based on a fusion of the GTPase and its effector) fall into this category. (b) Post-translational modification biosensor (i.e., for a kinase). (c) Protease substrate-type biosensor. (d) Biosensor based on conformational change of a single protein.
- 10. Genetically encoded fluorescent sensor of calcium
- 11. Genetically encoded fluorescent sensor of ERK activity The MAPK family is a class of serine/threonine kinases that includes the ERK, p38, and JNK subfamilies. Members of the ERK subfamily are essential for numerous, diverse physiological functions, including cellular differentiation, proliferation and neuronal plasticity, and their activities are up-regulated in many cancers. Fluorescence lifetime images of HEK293 cells transfected with EKARcyto before and after (12 min) addition of EGF (100 ng/ml).
- 12. Tyrosine Phosphorylation of Cytoplasmic Domain of EGFR Monitored by FRET Lippincott-Schwartz, Snapp and Kenworthy Nat. Rev. Mol. Cell Biol. 2:444, 2001
- 13. Tyrosine Phosphorylation of Cytoplasmic Domain of EGFR Monitored by FRET Verveer et al., Science 290:1567, 2000
- 14. Single FP-based biosensors Molecular sensors (pH, Ca2+, cAMP, kinases, redox, H2O2, etc.) on the base of FRET or brightness changes. (a) Single FP biosensor based on intrinsic (i.e., pH) sensitivity. (b) Single FP biosensor based on the extrinsic sensitivity (i.e., Ca2+) of a genetically fused domain (i.e., calmodulin). (c) GCaMP X-ray crystal structure.45 Linker regions that were not visible in the crystal structure are represented with dashed lines.
- 15. Circular permutation of GFP Baird GS, Zacharias DA, and Tsien RY., PNAS, 1999
- 16. FP biosensor structure and imaging Molecular sensors (pH, Ca2+, cAMP, kinases, redox, H2O2, etc.) on the base of FRET or brightness changes. 0s 10 s 10.8 s 11.3 s (A) GCaMP2, a calcium indicator constructed with a circularly permutated EGFP fused to calmodulin and the calmodulin-binding domain of myosin light chain kinase (M13 domain) in the absence of calcium. (B) GCamP2 structure when bound to calcium. (C–F) Widefield fluorescence calcium imaging in the cytosol of HeLa cells expressing a calcium biosensor. (C) Real color image of two cells, t = 0, histamine (10 M) added; (D) pseudocolored ratio image of two HeLa cells as a calcium wave initiates in the upper cell, t = 10 s. (E–F) The calcium wave propagates through the cytoplasm of both cells.
- 17. Redox signaling: basic principles and imaging in living cells
- 18. Dröge W. Physiol Rev. 2002 Jan;82(1):47-95.
- 22. Topology Growth factor Endosome lumen RTK NADPH oxidase P-Y- -Y-P Y Y-P Cytoplasm PTP SNADPH oxidase 4 ER lumen
- 23. Research questions: -Which cellular compartment is responsible for H2O2 production in RTKs signaling? -When H2O2 appears? -What is the diffusion distance of H2O2 within the cell?
- 24. Lessons from HyPer imaging
- 25. OxyR-RD - reversible S-S bond formation upon oxidation by H2O2
- 27. Circular permutation of GFP Baird GS, Zacharias DA, and Tsien RY., PNAS, 1999
- 28. HyPer design Belousov et al, Nat Meth 2006
- 29. Spectral properties of HyPer 420 nm Belousov et al, Nat Meth 2006
- 30. With regular HyPer, the average intracellular H2O2 is detected due to the rapid diffusion of the probe
- 31. Mishina et al, ARS 2011
- 32. Mishina et al, ARS 2011
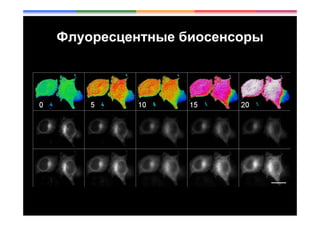
- 33. H2O2 production by HeLa-Kyoto cells stimulated with EGF Mishina et al, ARS 2011
- 34. H2O2 production by HeLa-Kyoto cells stimulated with EGF Scale 5 m Mishina et al, ARS 2011
- 35. H2O2 production by HeLa-Kyoto cells stimulated with EGF -H2O2 production/Nox activity co-localizes with activated RTK -H2O2 does not diffuse for a long distance -Nox activity translocates from the PM to the endosomes Mishina et al, ARS 2011
- 36. HyPer-TA in the same cells Mishina et al, ARS 2011
- 37. HyPer-TA detects immediate early peak of H2O2 production followed by 2nd sustained one Mishina et al, ARS 2011
- 38. 2 different systems produce H2O2 in HeLa-Kyoto cells Co-localizes with PTP-1B phosphatase Co-localizes with active RTK Mishina et al, ARS 2011
- 39. PDGFR-HyPer in fibroblasts Mishina et al, ARS 2011
- 40. H2O2 in NIH-3t3 cells stimulated with PDGF Mishina et al, ARS 2011
- 41. Mishina et al, ARS 2011
- 42. H2O2 production at the ER surface imaged using HyPer-TA Mishina et al, ARS 2011
- 43. Single system controls H2O2 production in fibroblasts Co-localizes with PTP-1B phosphatase Co-localizes with active RTK Mishina et al, ARS 2011
- 44. -Which cellular compartment is responsible for NADPH oxidases activation and H2O2 production in RTKs signalling? Epithelial cells – Endosomes, ER membrane; Fibroblasts – Plasma membrane, ER membrane.
- 45. -What is diffusion distance of H2O2 within the cell? Estimated to be ~1m or even less. However, may vary in different cell types.
- 46. Dual read-out sensor for H2O2 and PIP3
- 47. Schematic representation of the mechanism of a translocation-based biosensor
- 49. PI3 Kinase PIP2 PIP3 BTK-PH BTK-PH HyPer HyPer PIP-SHOW (PIP3 and SH Oxidation Watching)
- 50. H2O2 and PI3K activity in NIH-3T3 fibroblasts exposed to PDGF