Beginners Guide to TikTok for Search - Rachel Pearson - We are Tilt __ Bright...
September 2013 Housing Sales Statistics
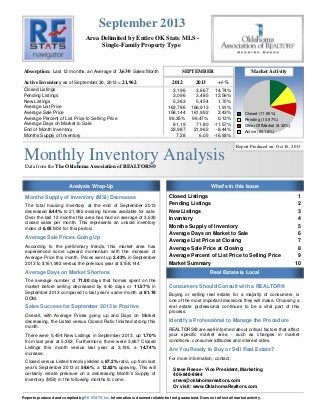
1. September 2013
Area Delimited by Entire OK State MLS Single-Family Property Type
Absorption: Last 12 months, an Average of 3,630 Sales/Month
Active Inventory as of September 30, 2013 = 21,962
Closed Listings
Pending Listings
New Listings
Average List Price
Average Sale Price
Average Percent of List Price to Selling Price
Average Days on Market to Sale
End of Month Inventory
Months Supply of Inventory
SEPTEMBER
Market Activity
2012
2013
+/-%
3,196
3,096
5,363
163,786
158,144
96.35%
81.19
23,987
7.28
3,667
3,485
5,454
166,913
161,992
96.47%
71.80
21,962
6.05
14.74%
12.56%
1.70%
1.91%
2.43%
0.13%
-11.57%
-8.44%
-16.93%
Monthly Inventory Analysis
Closed (11.55%)
Pending (10.97%)
Other OffMarket (8.32%)
Active (69.16%)
Report Produced on: Oct 16, 2013
Data from the The Oklahoma Association of REALTORS®
Analysis Wrap-Up
Months Supply of Inventory (MSI) Decreases
The total housing inventory at the end of September 2013
decreased 8.44% to 21,962 existing homes available for sale.
Over the last 12 months this area has had an average of 3,630
closed sales per month. This represents an unsold inventory
index of 6.05 MSI for this period.
Average Sale Prices Going Up
According to the preliminary trends, this market area has
experienced some upward momentum with the increase of
Average Price this month. Prices went up 2.43% in September
2013 to $161,992 versus the previous year at $158,144.
Average Days on Market Shortens
The average number of 71.80 days that homes spent on the
market before selling decreased by 9.40 days or 11.57% in
September 2013 compared to last year’s same month at 81.19
DOM.
Sales Success for September 2013 is Positive
Overall, with Average Prices going up and Days on Market
decreasing, the Listed versus Closed Ratio finished strong this
month.
There were 5,454 New Listings in September 2013, up 1.70%
from last year at 5,363. Furthermore, there were 3,667 Closed
Listings this month versus last year at 3,196, a 14.74%
increase.
Closed versus Listed trends yielded a 67.2% ratio, up from last
year’s September 2013 at 59.6%, a 12.82% upswing. This will
certainly create pressure on a decreasing Month’s Supply of
Inventory (MSI) in the following months to come.
What's in this Issue
Closed Listings
Pending Listings
New Listings
Inventory
Months Supply of Inventory
Average Days on Market to Sale
Average List Price at Closing
Average Sale Price at Closing
Average Percent of List Price to Selling Price
Market Summary
1
2
3
4
5
6
7
8
9
10
Real Estate is Local
Consumers Should Consult with a REALTOR®
Buying or selling real estate, for a majority of consumers, is
one of the most important decisions they will make. Choosing a
real estate professional continues to be a vital part of this
process.
Identify a Professional to Manage the Procedure
REALTORS® are well-informed about critical factors that affect
your specific market area - such as changes in market
conditions, consumer attitudes and interest rates.
Are You Ready to Buy or Sell Real Estate?
For more information, contact:
Steve Reese - Vice President, Marketing
405-848-9944
steve@oklahomarealtors.com
Or visit: www.OklahomaRealtors.com
Reports produced and compiled by RE STATS Inc. Information is deemed reliable but not guaranteed. Does not reflect all market activity.
2. Monthly Inventory Analysis
Data from the The Oklahoma Association of
REALTORS®
September 2013
Closed Sales as of Oct 13, 2013
Closed Listings
Report Produced on: Oct 16, 2013
Area Delimited by Entire OK State MLS - Single-Family Property Type
SEPTEMBER
2009
2010
YEAR TO DATE (YTD)
2011
2012
3,217
2013
3,196
2009
2010
2011
2012
3,667
3,513
28,623
2,697
2013
33,801
31,182
27,279
26,983
1 Year
+14.74%
2 Year
+13.99%
1 Year
+8.40%
2 Year
+25.27%
5 YEAR MARKET ACTIVITY TRENDS
5yr SEP AVG = 3,258
High
Jul 2013 = 4,613
Low
Jan 2010 = 1,719
5,000
4,000
3,000
3 MONTHS
J 4,613
U
L
Closed Listings
A 4,317
U
G -6.42%
Closed Listings
this
month at 3,667,
above the 5 yr SEP S 3,667
E
average of 3,258
P -15.06%
2,000
1,000
0
Jun 2009 Dec 2009Jun 2010 Dec 2010Jun 2011 Dec 2011Jun 2012 Dec 2012Jun 2013
CLOSED LISTINGS & BEDROOMS DISTRIBUTION BY PRICE
Distribution of Closed Listings by Price Range
%
AVDOM
2 Beds
3 Beds
4 Beds
5 Beds+
158
4.31%
96.2
78
69
9
2
$25,001
$75,000
609
16.61%
84.2
213
353
32
11
$75,001
$100,000
Ready to Buy or Sell Real Estate?
Contact an experienced REALTOR
$25,000
and less
388
10.58%
71.8
87
268
27
6
$100,001
$150,000
908
24.76%
59.4
144
655
104
5
$150,001
$200,000
712
19.42%
73.2
100
413
189
10
$200,001
$275,000
473
12.90%
69.9
67
163
225
18
$275,001
and up
419
11.43%
71.4
36
113
222
48
Total Closed Units:
Total Closed Volume:
Average Closed Price:
3,667
594,023,433
$161,992
71.8
725
2034
808
100
86.37M 278.53M 194.47M
34.65M
$119,135 $136,937 $240,686 $346,455
Reports produced and compiled by RE STATS Inc. Information is deemed reliable but not guaranteed. Does not reflect all market activity.
Steve Reese
405-848-9944
steve@oklahomarealtors.com
pp. 1
3. Monthly Inventory Analysis
Data from the The Oklahoma Association of
REALTORS®
September 2013
Pending Listings as of Oct 13, 2013
Pending Listings
Report Produced on: Oct 16, 2013
Area Delimited by Entire OK State MLS - Single-Family Property Type
SEPTEMBER
2009
2010
2011
2012
2,895
3,096
3,433
2,506
YEAR TO DATE (YTD)
2013
2009
2010
2011
2012
3,485
30,544
2013
35,720
32,717
27,878
28,045
1 Year
+12.56%
2 Year
+20.38%
1 Year
+9.18%
2 Year
+27.37%
5 YEAR MARKET ACTIVITY TRENDS
5yr SEP AVG = 3,083
High
Apr 2010 = 4,936
Low
Dec 2009 = 2,022
5,000
4,000
3,000
3 MONTHS
J 4,166
U
L
Pending Listings
A 4,128
U
G -0.91%
Pending Listings
this
month at 3,485,
above the 5 yr SEP S 3,485
E
average of 3,083
P -15.58%
2,000
1,000
0
Jun 2009 Dec 2009Jun 2010 Dec 2010Jun 2011 Dec 2011Jun 2012 Dec 2012Jun 2013
PENDING LISTINGS & BEDROOMS DISTRIBUTION BY PRICE
Distribution of Pending Listings by Price Range
%
AVDOM
2 Beds
3 Beds
4 Beds
5 Beds+
108
3.10%
58.6
54
47
6
1
$25,001
$75,000
606
17.39%
68.6
195
360
44
7
$75,001
$100,000
Ready to Buy or Sell Real Estate?
Contact an experienced REALTOR
$25,000
and less
408
11.71%
75.4
95
273
31
9
$100,001
$150,000
904
25.94%
61.5
146
652
95
11
$150,001
$200,000
600
17.22%
72.3
100
345
145
10
$200,001
$275,000
439
12.60%
81.9
65
192
160
22
$275,001
and up
420
12.05%
85.4
36
116
216
52
Total Pending Units:
Total Pending Volume:
Average Listing Price:
3,485
575,073,629
$160,505
74.6
691
1985
697
112
86.49M 274.54M 173.67M
40.37M
$125,164 $138,307 $249,174 $360,455
Reports produced and compiled by RE STATS Inc. Information is deemed reliable but not guaranteed. Does not reflect all market activity.
Steve Reese
405-848-9944
steve@oklahomarealtors.com
pp. 2
4. Monthly Inventory Analysis
Data from the The Oklahoma Association of
REALTORS®
September 2013
New Listings as of Oct 13, 2013
New Listings
Report Produced on: Oct 16, 2013
Area Delimited by Entire OK State MLS - Single-Family Property Type
SEPTEMBER
2009
2010
YEAR TO DATE (YTD)
2011
2012
5,527
5,501
5,363
2013
2009
5,229
2011
54,637
5,454
2010
54,110
51,859
2012
2013
56,459
57,607
1 Year
+1.70%
2 Year
-1.32%
1 Year
+2.03%
2 Year
+6.46%
5 YEAR MARKET ACTIVITY TRENDS
5yr SEP AVG = 5,415
High
Apr 2010 = 7,793
Low
Dec 2012 = 3,698
8,000
7,000
6,000
5,000
New Listings
4,000
3,000
2,000
1,000
0
Jun 2009 Dec 2009Jun 2010 Dec 2010Jun 2011 Dec 2011Jun 2012 Dec 2012Jun 2013
3 MONTHS
J 7,138
U
L
A 6,356
U
G -10.96%
New Listings this
month at 5,454,
above the 5 yr SEP S 5,454
E
average of 5,415
P -14.19%
NEW LISTINGS & BEDROOMS DISTRIBUTION BY PRICE
Distribution of New Listings by Price Range
%
2 Beds
3 Beds
4 Beds
5 Beds+
526
9.64%
255
232
34
5
$50,001
$75,000
557
10.21%
203
317
37
0
$75,001
$100,000
Ready to Buy or Sell Real Estate?
Contact an experienced REALTOR
$50,000
and less
617
11.31%
144
406
61
6
$100,001
$150,000
1,275
23.38%
195
887
179
14
$150,001
$225,000
1,222
22.41%
151
708
339
24
$225,001
$325,000
629
11.53%
69
243
283
34
$325,001
and up
628
11.51%
58
139
303
128
Total New Listed Units:
Total New Listed Volume:
Average New Listed Listing Price:
5,454
1,035,130,185
$210,700
1075
2932
1236
211
140.40M 438.13M 332.60M 124.00M
$130,601 $149,431 $269,093 $587,699
Reports produced and compiled by RE STATS Inc. Information is deemed reliable but not guaranteed. Does not reflect all market activity.
Steve Reese
405-848-9944
steve@oklahomarealtors.com
pp. 3
5. Monthly Inventory Analysis
Data from the The Oklahoma Association of
REALTORS®
September 2013
Active Inventory as of Oct 13, 2013
Active Inventory
Report Produced on: Oct 16, 2013
Area Delimited by Entire OK State MLS - Single-Family Property Type
END OF SEPTEMBER
2009
2010
2011
25,530
ACTIVE DURING SEPTEMBER
2012
2013
2009
26,043
21,962
21,467
2011
31,087
23,973
2010
2012
2013
32,115
29,816
28,090
27,384
1 Year
-8.39%
2 Year
-15.67%
1 Year
-5.79%
2 Year
-12.53%
5 YEAR MARKET ACTIVITY TRENDS
5yr SEP AVG = 23,795
Active Inventory
High
Jul 2011 = 26,758
Low
Dec 2009 = 19,799
30,000
20,000
3 MONTHS
J 22,933
U
L
A 22,639
U
G -1.28%
Inventory this
month at 21,962,
below the 5 yr SEP S 21,962
E
average of 23,795 P -2.99%
10,000
0
Jun 2009 Dec 2009Jun 2010 Dec 2010Jun 2011 Dec 2011Jun 2012 Dec 2012Jun 2013
INVENTORY & BEDROOMS DISTRIBUTION BY PRICE
Distribution of Inventory by Price Range
%
AVDOM
2 Beds
3 Beds
4 Beds
5 Beds+
2,060
9.38%
119.1
1,073
851
125
11
$50,001
$75,000
2,266
10.32%
116.8
880
1,221
147
18
$75,001
$100,000
Ready to Buy or Sell Real Estate?
Contact an experienced REALTOR
$50,000
and less
2,655
12.09%
109.4
726
1,677
230
22
$100,001
$175,000
6,639
30.23%
100.9
1,205
4,208
1,117
109
$175,001
$225,000
2,682
12.21%
102.1
401
1,330
887
64
$225,001
$350,000
3,233
14.72%
109.3
458
1,084
1,449
242
$350,001
and up
2,427
11.05%
118.2
236
493
1,125
573
Total Active Inventory by Units:
Total Active Inventory by Volume:
Average Active Inventory Listing Price:
21,962
4,371,874,530
$199,065
108.6
4,979
10,864
5,080
1,039
679.24M
1.68B
1.44B 570.60M
$136,421 $154,987 $283,122 $549,185
Reports produced and compiled by RE STATS Inc. Information is deemed reliable but not guaranteed. Does not reflect all market activity.
Steve Reese
405-848-9944
steve@oklahomarealtors.com
pp. 4
6. Monthly Inventory Analysis
Data from the The Oklahoma Association of
REALTORS®
September 2013
Active Inventory as of Oct 13, 2013
Months Supply of Inventory
Report Produced on: Oct 16, 2013
Area Delimited by Entire OK State MLS - Single-Family Property Type
MSI FOR SEPTEMBER
2009
2010
8.3
2011
INDICATORS FOR SEPTEMBER 2013
2012
Inventory
2013
9.1
Absorption
MSI
MSI %
6.1
16.527%
Months
Supply
of
Inventory
Percent
Months
Supply of
Inventory
43,556
7.3
7.0
Closed
6.1
21,962
1 Year
-16.88%
2 Year
-33.53%
End of
Month
Active
Inventory
Closed
Last
12
Months
5 YEAR MARKET ACTIVITY TRENDS
3,630
Average
Closed per
Month over
12 Months
5yr SEP AVG = 7.6
High
Jun 2011 = 9.7
Low
Feb 2013 = 6.0
Months Supply
10
9
8
7
6
5
4
3
2
1
0
Jun 2009 Dec 2009 Jun 2010 Dec 2010 Jun 2011 Dec 2011 Jun 2012 Dec 2012 Jun 2013
3 MONTHS
J 6.4
U
L
A 6.3
U
G -1.72%
Months Supply this
month at 6.1,
below the 5 yr SEP S 6.1
E
average of 7.6
P -4.04%
MONTHS SUPPLY & BEDROOMS DISTRIBUTION BY PRICE
Distribution of Active Inventory by Price Range and MSI
%
MSI
2 Beds
3 Beds
4 Beds
5 Beds+
2,060
9.38%
4.8
5.8
4.0
4.7
2.9
$50,001
$80,000
2,862
13.03%
7.3
9.0
6.6
6.1
6.5
$80,001
$110,000
Ready to Buy or Sell Real Estate?
Contact an experienced REALTOR
$50,000
and less
2,847
12.96%
6.3
6.9
6.0
6.7
8.7
$110,001
$170,000
5,485
24.97%
5.0
5.5
4.7
5.5
13.3
$170,001
$240,000
3,633
16.54%
5.5
6.2
5.4
5.3
5.5
$240,001
$370,000
2,865
13.05%
6.9
8.6
7.0
6.1
9.0
$370,001
and up
2,210
10.06%
12.4
15.8
12.4
10.5
16.6
6.8
5.5
4,979 10,864
6.3
5,080
11.1
1,039
MSI:
Total Active Inventory:
6.1
21,962
Reports produced and compiled by RE STATS Inc. Information is deemed reliable but not guaranteed. Does not reflect all market activity.
Steve Reese
405-848-9944
steve@oklahomarealtors.com
pp. 5
7. Monthly Inventory Analysis
Data from the The Oklahoma Association of
REALTORS®
September 2013
Closed Sales as of Oct 13, 2013
Average Days on Market to Sale
Report Produced on: Oct 16, 2013
Area Delimited by Entire OK State MLS - Single-Family Property Type
SEPTEMBER
2009
2010
82
78
2011
85
YEAR TO DATE (YTD)
2012
2013
2009
81
84
72
2010
2011
2012
2013
89
83
79
75
1 Year
-11.57%
2 Year
-15.64%
1 Year
-9.47%
2 Year
-15.31%
5 YEAR MARKET ACTIVITY TRENDS
5yr SEP AVG = 80
Average Days on Market
High
Mar 2011 = 98
Low
Jul 2013 = 69
100
90
80
70
60
50
40
30
20
10
0
3 MONTHS
J 69
U
L
A 73
U
G 6.32%
Average DOM this
month at 72,
below the 5 yr SEP S 72
E
average of 80
P -2.18%
Jun 2009 Dec 2009 Jun 2010 Dec 2010 Jun 2011 Dec 2011 Jun 2012 Dec 2012 Jun 2013
AVERAGE DOM OF CLOSED SALES & BEDROOMS DISTRIBUTION BY PRICE
Distribution of Average Days on Market to Sale by Price Range %
AVDOM
2 Beds
3 Beds
4 Beds
5 Beds+
Ready to Buy or Sell Real Estate?
Contact an experienced REALTOR
$25,000
and less
158
4.31%
96.2
120.1
72.7
56.4
153.0
$25,001
$75,000
609
16.61%
84.2
89.9
75.0
124.2
150.6
$75,001
$100,000
388
10.58%
71.8
81.4
64.7
115.6
51.2
$100,001
$150,000
908
24.76%
59.4
65.3
56.2
70.8
69.4
$150,001
$200,000
712
19.42%
73.2
105.6
67.0
69.6
70.9
$200,001
$275,000
473
12.90%
69.9
63.1
73.5
67.5
91.3
$275,001
and up
419
11.43%
71.4
68.5
71.5
68.0
89.1
Average Closed DOM:
Total Closed Units:
Total Closed Volume:
71.8
3,667
594,023,433
85.9
725
86.37M
65.6
2034
278.53M
72.3
808
194.47M
Reports produced and compiled by RE STATS Inc. Information is deemed reliable but not guaranteed. Does not reflect all market activity.
Steve Reese
405-848-9944
steve@oklahomarealtors.com
92.5
100
34.65M
pp. 6
8. Monthly Inventory Analysis
Data from the The Oklahoma Association of
REALTORS®
September 2013
Closed Sales as of Oct 13, 2013
Average List Price at Closing
Report Produced on: Oct 16, 2013
Area Delimited by Entire OK State MLS - Single-Family Property Type
SEPTEMBER
2009
2010
2011
155,265
155,921
YEAR TO DATE (YTD)
2012
2013
163,786
166,913
146,447
2009
2010
2011
2012
2013
155,940
159,814
169,308
149,995
151,722
1 Year
+1.91%
2 Year
+7.05%
1 Year
+5.94%
2 Year
+8.57%
5 YEAR MARKET ACTIVITY TRENDS
5yr SEP AVG = 158K
Average List Price
High
Aug 2013 = 176,694
Low
Jan 2010 = 139,073
200,000
3 MONTHS
J 176,601
U
L
A 176,694
U
Average LPrice this G 0.05%
month at 166,913,
above the 5 yr SEP S 166,913
E
average of 157,666 P -5.54%
100,000
0
Jun 2009Dec 2009Jun 2010Dec 2010Jun 2011Dec 2011Jun 2012Dec 2012Jun 2013
AVERAGE LIST PRICE OF CLOSED SALES & BEDROOMS DISTRIBUTION BY PRICE
Distribution of Average List Price at Closing by Price Range
%
AVL$
2 Beds
3 Beds
4 Beds
5 Beds+
140
3.82%
17,203
19,974
18,096
19,129
18,000
$25,001
$75,000
573
15.63%
53,132
53,795
57,698
65,738
48,873
$75,001
$100,000
Ready to Buy or Sell Real Estate?
Contact an experienced REALTOR
$25,000
and less
408
11.13%
89,366
90,952
91,822
93,095
97,817
$100,001
$150,000
898
24.49% 128,420
130,381 130,468 133,006 122,760
$150,001
$200,000
728
19.85% 175,332
176,518 176,300 181,300 180,760
$200,001
$275,000
475
12.95% 236,057
239,834 238,194 241,528 246,307
$275,001
and up
445
12.14% 421,721
457,980 381,126 416,774 583,376
Average List Price:
Total Closed Units:
Total List Volume:
$166,913
3,667
612,070,212
$124,016 $140,799 $247,222 $360,175
725
2034
808
100
89.91M 286.39M 199.76M
36.02M
Reports produced and compiled by RE STATS Inc. Information is deemed reliable but not guaranteed. Does not reflect all market activity.
Steve Reese
405-848-9944
steve@oklahomarealtors.com
pp. 7
9. Monthly Inventory Analysis
Data from the The Oklahoma Association of
REALTORS®
September 2013
Closed Sales as of Oct 13, 2013
Average Sold Price at Closing
Report Produced on: Oct 16, 2013
Area Delimited by Entire OK State MLS - Single-Family Property Type
SEPTEMBER
2009
2012
2011
149,336
2013
158,144
141,907
2010
YEAR TO DATE (YTD)
149,764
2009
2010
2011
2012
2013
161,992
150,156
154,157
163,953
144,726
146,241
1 Year
+2.43%
2 Year
+8.16%
1 Year
+6.36%
2 Year
+9.19%
5 YEAR MARKET ACTIVITY TRENDS
5yr SEP AVG = 152K
Average Sold Price
High
Jul 2013 = 171,551
Low
Jan 2010 = 133,432
200,000
3 MONTHS
J 171,551
U
L
A 170,358
U
Average SPrice this G -0.70%
month at 161,992,
above the 5 yr SEP S 161,992
E
average of 152,228 P -4.91%
100,000
0
Jun 2009Dec 2009Jun 2010Dec 2010Jun 2011Dec 2011Jun 2012Dec 2012Jun 2013
AVERAGE SOLD PRICE OF CLOSED SALES & BEDROOMS DISTRIBUTION BY PRICE
Distribution of Average Sold Price at Closing by Price Range
%
AVS$
2 Beds
3 Beds
4 Beds
5 Beds+
158
4.31%
15,780
15,929
15,434
16,922
16,750
$25,001
$75,000
609
16.61%
52,511
49,811
53,697
59,472
46,473
$75,001
$100,000
Ready to Buy or Sell Real Estate?
Contact an experienced REALTOR
$25,000
and less
388
10.58%
88,606
88,280
88,588
88,847
93,042
$100,001
$150,000
908
24.76% 127,427
126,620 127,391 129,069 121,160
$150,001
$200,000
712
19.42% 173,698
171,164 172,714 176,946 178,330
$200,001
$275,000
473
12.90% 234,700
232,136 233,226 236,227 238,493
$275,001
and up
419
11.43% 417,142
442,698 371,519 405,420 559,596
Average Closed Price:
Total Closed Units:
Total Closed Volume:
$161,992
3,667
594,023,433
$119,135 $136,937 $240,686 $346,455
725
2034
808
100
86.37M 278.53M 194.47M
34.65M
Reports produced and compiled by RE STATS Inc. Information is deemed reliable but not guaranteed. Does not reflect all market activity.
Steve Reese
405-848-9944
steve@oklahomarealtors.com
pp. 8
10. Monthly Inventory Analysis
Data from the The Oklahoma Association of
REALTORS®
September 2013
Closed Sales as of Oct 13, 2013
Average Percent of List Price to Selling Price
Report Produced on: Oct 16, 2013
Area Delimited by Entire OK State MLS - Single-Family Property Type
SEPTEMBER
2009
2010
2011
YEAR TO DATE (YTD)
2012
2013
96.35%
96.47%
96.88%
95.81%
95.71%
2009
2010
2011
2012
2013
96.67%
96.38%
96.22%
96.19%
96.29%
1 Year
+0.13%
2 Year
+0.80%
1 Year
+0.39%
2 Year
+0.50%
5 YEAR MARKET ACTIVITY TRENDS
5yr SEP AVG=96.24%
Average List/Sell Price
High
Jun 2011 = 98.79%
Low
Jan 2011 = 95.22%
99
98
3 MONTHS
J 96.97%
U
L
A 96.71%
U
Average List/Sell this G -0.26%
month at 96.47%,
above the 5 yr SEP S 96.47%
E
average of 96.24% P -0.25%
97
96
95
Jun 2009 Dec 2009 Jun 2010 Dec 2010 Jun 2011 Dec 2011 Jun 2012 Dec 2012 Jun 2013
AVERAGE L/S% OF CLOSED SALES & BEDROOMS DISTRIBUTION BY PRICE
Distribution of $avgmed L/S % by Price Range
%
AVL/S%
2 Beds
3 Beds
4 Beds
5 Beds+
158
4.31% 85.18% 82.77% 87.12% 89.31% 93.82%
$25,001
$75,000
609
16.61% 93.80% 92.68% 94.57% 91.48% 97.25%
$75,001
$100,000
Ready to Buy or Sell Real Estate?
Contact an experienced REALTOR
$25,000
and less
388
10.58% 97.09% 97.36% 97.12% 96.30% 95.57%
$100,001
$150,000
908
24.76% 97.65% 97.28% 97.77% 97.33% 98.69%
$150,001
$200,000
712
19.42% 97.89% 97.17% 98.10% 97.77% 98.75%
$200,001
$275,000
473
12.90% 97.83% 97.20% 98.08% 97.91% 96.81%
$275,001
and up
419
11.43% 97.57% 97.19% 97.89% 97.61% 96.91%
Average List/Sell Ratio:
Total Closed Units:
Total Closed Volume:
96.50%
3,667
594,023,433
94.35%
725
86.37M
96.87%
2034
278.53M
97.32%
808
194.47M
Reports produced and compiled by RE STATS Inc. Information is deemed reliable but not guaranteed. Does not reflect all market activity.
Steve Reese
405-848-9944
steve@oklahomarealtors.com
97.06%
100
34.65M
pp. 9
11. Monthly Inventory Analysis
Data from the The Oklahoma Association of
REALTORS®
September 2013
Inventory as of Oct 13, 2013
Market Summary
Report Produced on: Oct 16, 2013
Area Delimited by Entire OK State MLS - Single-Family Property Type
Inventory
Inventory
Market Activity
New Listings
5,454 = 19.41%
Closed Sales
3,667 = 11.55%
Start Inventory
22,640
Pending Sales
3,485 = 10.97%
Total Inventory
Units
28,094
Volume
$5,506,360,199
Absorption: Last 12 months, an Average of 3,630 Sales/Month
Pending Listings
2013
+/-%
3,667
3,485
5,454
166,913
161,992
96.47%
71.80
21,962
6.05
14.74%
12.56%
1.70%
1.91%
2.43%
0.13%
-11.57%
-8.44%
-16.93%
+1.70%
166,913
161,992
+2.43%
% of List to Sale Price
96.47%
-8.44%
2012
2013
AVERAGE L/S% & DOM
7.28
6.05
8.40%
9.18%
2.03%
5.94%
6.36%
0.39%
-9.47%
-8.44%
-16.93%
+1.91%
2012
2013
21,962
33,801
35,720
57,607
169,308
163,953
96.67%
75.20
21,962
6.05
31,182
32,717
56,459
159,814
154,157
96.29%
83.07
23,987
7.28
+/-%
158,144
+12.56%
Monthly Supply of Inventory
2013
Sale Price
3,485
INVENTORY
2012
AVERAGE PRICES
163,786
3,096
Year To Date
List Price
5,454
23,987
SEPTEMBER
2012
2013
SEPTEMBER MARKET
Active Inventory
Active Inventory
21,962 = 69.16%
3,196
3,096
5,363
163,786
158,144
96.35%
81.19
23,987
7.28
Closed Sales
Pending Sales
New Listings
Average List Price
Average Sale Price
Average Percent of List Price to Selling Price
Average Days on Market to Sale
Monthly Inventory
Months Supply of Inventory
5,363
Other Off Market
2,642 = 8.32%
2012
Active Inventory as of September 30, 2013 = 21,962
New Listings
Market Activity
-16.93%
Days on Market to Sale
81.19
96.35%
71.80
+0.13%
-11.57%
Reports produced and compiled by RE STATS Inc. Information is deemed reliable but not guaranteed. Does not reflect all market activity.
Steve Reese
405-848-9944
2012
2013
steve@oklahomarealtors.com
pp. 10