Bank of england and inflation sense of déjà vu

UK retail sales in Q1 likely contracted from Q4 2016, despite their rebound in February. Falling real wages and slowing household borrowing are likely to further dampen retail sales and consumption growth going forward. The still large pool of available workers is seemingly limiting their wage-bargaining power, with nominal wage growth falling behind rising inflation. Moreover, investment growth is still only making a negligible contribution to GDP growth ahead of the British government’s decision to trigger Article 50 on 29th March. Much of the rise in inflation in recent months is attributable to imported inflation driven by Sterling’s depreciation since November 2015 with little evidence of demand-led inflation. This situation is reminiscent of 2007-2008 when Sterling’s collapse fuelled imported and in turn headline inflation. Should Sterling remain broadly unchanged going forward, its year-on-year pace of depreciation, currently around 9%, would slow from June onwards and hit zero towards end-year according to my estimates, in turn dampening imported inflation. I would expect retailers to stabilise prices to maintain market share in the face of tepid demand and for wage-inflation expectations to remain modest. This was certainly the case in the 12 months to September 2009 with CPI-inflation falling from 5.2% yoy to 1.1% yoy. The question is whether the BoE is willing to look beyond a potentially temporary rise in UK inflation – as Governor Mark Carney suggested – or whether it tries to short-circuit any self-reinforcing rise in prices. My base-line scenario is that the BoE will look beyond the current rise in UK inflation, unless at least one of three conditions materialise: (1) Nominal wage growth accelerates, comfortably outstripping headline inflation and driving consumption growth; (2) Commercial bank lending picks up significantly; and (3) Sterling depreciates materially from current levels, exacerbating imported and in turn headline inflation. I expect that neither (1) or (2) will materialise any time soon and that while risks to Sterling are probably to the downside, Sterling is unlikely to weaken sufficiently to push the BoE into hiking. I would however expect it to keep a possible rate hike firmly on the table.

Recommandé
Contenu connexe
Tendances
Tendances (20)
Similaire à Bank of england and inflation sense of déjà vu
Similaire à Bank of england and inflation sense of déjà vu (20)
Dernier
Dernier (20)
Bank of england and inflation sense of déjà vu
- 1. 1 Bank of England and inflation – Sense of déjà-vu? UK retail sales in Q1 likely contracted from Q4 2016, despite their rebound in February. Falling real wages and slowing household borrowing are likely to further dampen retail sales and consumption growth going forward. The still large pool of available workers is seemingly limiting their wage-bargaining power, with nominal wage growth falling behind rising inflation. Moreover, investment growth is still only making a negligible contribution to GDP growth ahead of the British government’s decision to trigger Article 50 on 29th March. Much of the rise in inflation in recent months is attributable to imported inflation driven by Sterling’s depreciation since November 2015 with little evidence of demand-led inflation. This situation is reminiscent of 2007-2008 when Sterling’s collapse fuelled imported and in turn headline inflation. Should Sterling remain broadly unchanged going forward, its year-on-year pace of depreciation, currently around 10%, would slow from June onwards and hit zero towards end-year according to my estimates, in turn dampening imported inflation. I would expect retailers to stabilise prices to maintain market share in the face of tepid demand and for wage-inflation expectations to remain modest. This was certainly the case in the 12 months to September 2009 with CPI-inflation falling from 5.2% yoy to 1.1% yoy. The question is whether the BoE is willing to look beyond a potentially temporary rise in UK inflation – as Governor Mark Carney suggested – or whether it tries to short-circuit any self-reinforcing rise in prices. My base-line scenario is that the BoE will look beyond the current rise in UK inflation, unless at least one of three conditions materialise: (1) Nominal wage growth accelerates, comfortably outstripping headline inflation and driving consumption growth; (2) Commercial bank lending picks up significantly; and (3) Sterling depreciates materially from current levels, exacerbating imported and in turn headline inflation. I expect that neither (1) or (2) will materialise any time soon and that while risks to Sterling are probably to the downside, Sterling is unlikely to weaken sufficiently to push the BoE into hiking. I would however expect it to keep a possible rate hike firmly on the table.
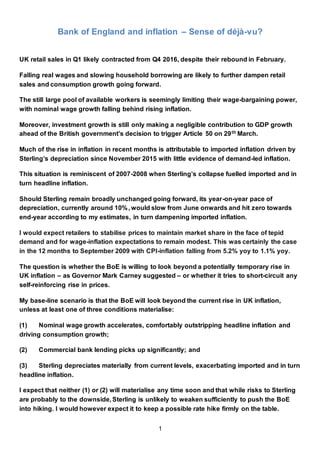
- 2. 2 Falling real wages and soft retail sales do not bode well for consumption or GDP growth The tragic events in London on Wednesday, which British authorities are qualifying as a terrorist attack, continue to dominate the headlines. Understandably, financial markets may for now relegate to second place UK macro data, including Office of National Statistics (ONS) figures for February retail sales released yesterday. The total volume of retail sales (including automobile fuel) rebounded 1.4% month-on-month in February after having fallen consecutively in the previous three months albeit from an all-time high in October 2016 (see Figure 1). However, the volume of retail sales was still down 1.2% in January-February from Q4 2016 when retail sales rose 1.2% quarter-on-quarter. I estimate that retail sales would have to rise about 2.9% mom in March – the second fastest ever rate of growth (they rose 3.0% mom in December 2013) in order for retail sales in Q1 2017 to match the level of sales in Q4 2017 and thus for quarter-on-quarter growth to be zero. March data are due for release on 21st April, according to the ONS. Figure 1: Retail sales rebounded in February after 3 months of contraction but Q1 still on course to be weak Source: Office of National Statistics Retail sales growth of near 3% yoy in March is very unlikely in my view. Real earnings have been falling in recent months (see Figure 2) – a risk which I had flagged back in August (see UK economy post- referendum - for richer but mostly for poorer, 26 August 2016) – and bank lending to individuals is slowing. -3 -2 -1 0 1 2 3 Jun-13 Oct-13 Feb-14 Jun-14 Oct-14 Feb-15 Jun-15 Oct-15 Feb-16 Jun-16 Oct-16 Feb-17 Excluding automobile fuel sales Including automobile fuel sales UK retail sales volume, seasonally adjusted, month-on-month % change
- 3. 3 Figure 2: Real weekly earnings in the UK were down 1% in January 2017 from October 2016… Figure 3: …as nominal earnings growth has failed to keep up with higher inflation Source: Office of National Statistics Source: Office of National Statistics Note: * Including bonuses The fall in real earnings is, in my view, in part due to a still large pool of available workers failing to negotiate wage increases in line with rising CPI-inflation, as depicted in Figures 3 and 4 (see Market Fatigue in the face of catastrophic success, 20 January 2017). Moreover, precedent suggests that Wednesday’s terrorist attack may weigh on retail sales near-term (which includes the last week of March). After the terrorist attacks in London on 7th July 2005, retail sales contracted 0.1% mom in July and 0.9% mom in August 2005. 340 345 350 355 360 365 370 Jan 12 Jan 13 Jan 14 Jan 15 Jan 16 Jan 17 Weekly earnings index including bonuses, constant 2000 prices, seasonally adjusted -2 -1 0 1 2 3 4 Jan 12 Jan 13 Jan 14 Jan 15 Jan 16 Jan 17 Nominal weekly earnings, year-on-year % change in 3-month moving average* CPI-inflation, year-on-year % change
- 4. 4 Figure 4: Still large pool of available workersweighing on their ability to negotiate higher wages Source: Office of National Statistics Growth in non-secured bank lending to individuals (i.e. credit or non-mortgage lending) was reasonably robust until mid-2016 but has since slowed and net lending has actually contracted in recent months (see Figure 5). The ability and willingness of individuals and households to increase their bank borrowings has seemingly hit a buffer for now, despite broadly stable interest rates on credit cards and the ongoing fall in rates on other loans (see Figure 6). February lending data will be released on 29th March (08.30 local time). -4 -2 0 2 4 6 810.0 10.5 11.0 11.5 12.0 12.5 13.0 13.5 Jan 03 Sep 04 May 06 Jan 08 Sep 09 May 11 Jan 13 Sep 14 May 16 Unemployed, part-time workers and economically inactive but want a job (millions) Average (nominal) weekly earnings, including bonuses, % year-on-year (right scale, inverted) UK pool of available labour and nominal weekly earnings
- 5. 5 Figure 5: Net credit to individuals has slowed sharply in recent months… Figure 6: …despite stable or falling borrowing costs Source: Bank of England Note: Net lending is gross lending minus repayments Source: Bank of England In view of the above, it is more likely that retail sales will contract in Q1 2017 – the first quarter-on-quarter contraction since Q4 2013 – and could remain soft in following months. Assuming retail sales are unchanged in March, retail sales in Q1 2017 would be down 0.9% quarter-on-quarter – the largest contraction since Q4 2010. Figure 7 shows a reasonably high correlation between UK retail sales and consumption growth, despite household consumption also including services and purchases from abroad while excluding tourists’ estimated expenditures. A contraction in retail sales would therefore point to soft household consumption growth in Q1 2017. 1 2 3 4 5 6 -30 -20 -10 0 10 20 30 40 50 60 May-13 May-14 May-15 May-16 Quarter-on-quarter % change £ billions (right scale) Net unsecured lending to individuals (3-month moving average) 6 8 10 12 14 16 18 20 Jan 99 May 02 Sep 05 Jan 09 May 12 Sep 15 Other loans Credit cards Average monthly interest rate on unsecured loans to households, %
- 6. 6 Figure 7: A slowdown in retail sales growth would likely be a drag on overall household consumption growth Source: Office of National Statistics Given that household consumption accounts for over 60% of (real) GDP, a slowdown in household consumption growth from 0.7% qoq in Q4 216 would in turn likely weigh on GDP growth which hit a 7- quarter high of 0.7% qoq in Q4 (see Figure 8). At the same time, there is little evidence that fixed investment is about to make a significant contribution to economic growth (see Figure 9), as I discussed in UK inching towards Brexit (13 January 2017). Preliminary Q1 GDP data will be released on 28th April but will not include a demand-side breakdown which is to figure in the second estimate due out on 25th May. -3 -2 -1 0 1 2 3 1997 Q2 1999 Q3 2001 Q4 2004 Q1 2006 Q2 2008 Q3 2010 Q4 2013 Q1 2015 Q2 Household consumption Retail sales (including auto fuel) UK household consumption and retail sales, volume terms, quarter-on-quarter seasonally adjusted % change Lastdata pointfor retail sales is for Q1 2017 and assumes thatretail sales unchanged in March (from February)
- 7. 7 Figure 8: GDP growth resilient but downside risks from possible slowdown in private consumption Figure 9: Investment growth making little positive contribution to GDP growth Source: Office of National Statistics Source: Office of National Statistics Sterling’s past depreciation driving imported and headline inflation but effects to fade In a scenario of falling real earnings weighing on consumption, tepid investment growth and a broadly stable currency, I would not expect the Bank of England (BoE) to hike its policy rate from its record low of 0.25%. My core forecast is that rates will remain on hold throughout 2017. The common counter-argument is that the BoE will have to hike its policy rate in order to counter rising inflation. Headline CPI-inflation, which rose to 2.3% year-on-year in February (see Figure 3), has now nudged past the central bank’s 2% target and core inflation, which strips out food and fuel prices, hit a 3- year high of 2.0% yoy (see Figure 13). Monetary Policy Member (MPC) member Kristin Forbes went as far as to vote in favour of a 25bp rate hike at the BoE’s 15th March policy meeting, with the other 8 voting members (including Governor Mark Carney) voting in favour of rates remaining on hold at 0.25%. However, much of the rise in inflation is attributable to imported inflation driven by Sterling’s depreciation since November 2015 and in particular since the UK referendum on EU membership on 23rd June 2016. There is indeed little evidence of demand-led inflation, with nominal wages and retail sales week in recent months as discussed above. Figure 10 shows that the rise in the imported price of goods in the UK since autumn 2015 has tracked the pace of depreciation in the Sterling Nominal Effective Exchange Rate (NEER) – the weighted exchange rate of Sterling against the currencies of the UK’s main trading partners. This is in line with the BoE’s estimate that the pass-through from exchange rate movements to UK import prices is roughly 60% to 90% and reasonably rapid. -0.2 0.0 0.2 0.4 0.6 0.8 1.0 1.2 2014 Q4 2015 Q2 2015 Q4 2016 Q2 2016 Q4 GDP Household consumption Quarter-on-quarter % change, seasonally adjusted -0.3 -0.2 -0.1 0.0 0.1 0.2 0.3 2014 Q4 2015 Q2 2015 Q4 2016 Q2 2016 Q4 Gross Fixed Capital Formation Business Investment Contribution to quarter-on-quarter GDP growth (percentgage points)
- 8. 8 Figure 10: Sterling’s depreciation since autumn 2015 has pushed imported price inflation to multi-year highs Source: Office of National Statistics, Bank of England, investing.com This rise in imported inflation has in turn contributed to the rise in headline CPI-inflation. While the BoE estimates that the pass-through from imported inflation to headline inflation is only 30% and can take years to materialise (with other factors, such as international oil prices, driving prices), Figure 11 suggests that this pass-through has been more immediate. There is indeed much anecdotal evidence of UK retailers (including supermarkets and oil companies) passing on higher imported prices to consumers. I would add that the speed and magnitude of this rise in imported prices are comparable to the rise in imported prices in the 18 months to June 2008 triggered by the collapse in Sterling ahead of the great financial crisis (see Figure 12). This rise in imported prices contributed to headline CPI-inflation rising from below 2% yoy in summer 2007 to a multi-year high of 5.2% yoy in September 2008 (see Figure 11) while core CPI-inflation rose from 1.2% yoy in February 2008 to 2.2% yoy in September 2008 (see Figure 13). -25 -20 -15 -10 -5 0 5 10 15-10 -5 0 5 10 15 Jun-11 Feb-12 Oct-12 Jun-13 Feb-14 Oct-14 Jun-15 Feb-16 Oct-16 Jun-17 Price of imported goods Sterling Nominal Effective Exchange Rate, right scale (inverted) Year-on-year % change Assumes unchanged GBP NEER till end -year
- 9. 9 Figure 11: Surge in imported prices sufficient to drag headline inflation higher…like in 2008 Figure 12: If stability in Sterling NEER extends, pace of imported inflation should abate Source: Office of National Statistics Source: Bank of England Should Sterling remain broadly unchanged going forward, its year-on-year pace of depreciation which has already slowed sharply since last Autumn to around 10% would slow further from June onwards and hit zero towards end-year according to my estimates (see Figure 10) – as a result of course of the higher levels of the Sterling NEER falling out of the calculation. This would in turn help stabilise imported prices, assuming no major change in international oil and food prices. Again, this would broadly replicate the pattern recorded between mid-2008 and mid-2009 when the pace of imported inflation collapsed (see Figure 11). Whether retailers continue to increase their prices would of course depend on a number of factors and it is conceivable that retailers will be slower in stabilising prices than they have been in raising them. However, I would expect them to be under pressure to stabilise prices within a reasonable timeframe in order to maintain market share in the face of tepid demand. Higher inflation could also encourage workers to push for higher wages, in turn setting in motion an upward spiral of higher prices and higher nominal wages. But as I argue above, the still high pool of available labour is likely to continue dampening their wage- bargaining power and I would expect companies to resist higher wages in an effort to contain costs ahead of what is likely to be an uncertain two years for the UK. This was certainly the case in the 12 months to September 2009 with headline CPI-inflation falling from 5.2% yoy to 1.1% yoy (see Figure 11). -10 -5 0 5 10 15 20 May-05 Nov-07 May-10 Nov-12 May-15 Price of imported goods Headline CPI-inflation Year-on-year % change 70 75 80 85 90 95 100 105 110 Jan 00 Jan 02 Jan 04 Jan 06 Jan 08 Jan 10 Jan 12 Jan 14 Jan 16 Sterling Nominal Effective Exchange Rate (NEER), Jan 2005 = 100
- 10. 10 Figure 13: Rising inflation in past six months looks a lot like the upsurge in 2008…when BoE cut rates Source: Bank of England BoE more likely to chose to look beyond recent rise in UK inflation The forward-looking Bank of England is aware of these possible dynamics and so the question is whether it is willing to look beyond a potentially temporary rise in UK inflation – as Governor Mark Carney suggested on 21st March – or whether it will try to short-circuit any self-reinforcing rise in prices. I would note that the BoE started to aggressively cut its policy rate in October 2008, after headline CPI-inflation had hit a multi- year high of 5.2% yoy in September 2008 (see Figure 13) – evidence of the central bank’s willingness to look beyond likely temporary factors. My base-line scenario is that once again the BoE will look beyond the current rise in UK inflation, unless at least one of three conditions materialise: (1) Nominal wage growth accelerates, comfortably outstripping headline inflation and driving consumption growth; (2) Commercial bank lending picks up significantly; and (3) Sterling depreciates materially from current levels, exacerbating imported and in turn headline inflation (see Figure 12). I expect that neither (1) or (2) will materialise any time soon and that while the risks to Sterling are probably biased to the downside, Sterling is unlikely to weaken sufficiently to push the BoE into hiking interest rates. I would however expect the BoE to keep a possible rate hike this year firmly on the table in order to help -1 0 1 2 3 4 5 6 7 Jan 00 Sep 01 May 03 Jan 05 Sep 06 May 08 Jan 10 Sep 11 May 13 Jan 15 Sep 16 Bank of England policy rate, % Headline CPI-inflation, % year-on-year Core CPI-inflation, % year-on-year
- 11. 11 put a floor under Sterling and a ceiling on inflation expectations. A Reuters poll released on 24th January revealed a median 20% probability of a BoE rate hike this year and the market is currently pricing in about 15bp of rate hikes over the next 12 months.