2019 Wine Visitor Profile Study: Columbia Gorge
•
1 j'aime•390 vues

Presentation deck from Columbia Gorge Wine Visitor Profile Workshop conducted by the University of Oregon Institute for Policy Research & Engagement, May 22, 2019

Recommandé
Recommandé
Contenu connexe
Plus de Oregon Wine Board
Plus de Oregon Wine Board (20)
Dernier
Dernier (20)
2019 Wine Visitor Profile Study: Columbia Gorge
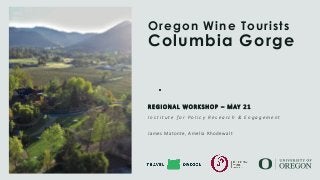
- 1. Oregon Wine Tourists Columbia Gorge R E G I O N A L WO R K S H O P – M AY 2 1 I n s t i t u t e f o r P o l i c y R e s e a r c h & E n g a g e m e n t James Matonte, Amelia Rhodewalt Schm i d t Fam ily Vine y a rd s Grants Pass, OR 1
- 2. 1 WORD TO DESCRIBE THE COLUMBIA GORGE Workshop participants were asked to provide one word they would use to describe the Rogue Valley. 2 Spectacular-beauty (✓✓) Scenic (✓) Dynamic Friendly Diverse Undiscovered Welcoming Majestic Unique Energetic Transitional Nature (✓) Windy Amazingly adventurous Discovery Inspiring
- 3. COLUMBIA GORGE UMPQUA VALLEY ROGUE VALLEY WILLAMETTE VALLEY 3 STUDY AREAS UO/OWB Regions of Study Willamette Valley Wineries Association (WVWA) Region of Study
- 4. SURVEY METHODOLOGY 7 wineries 2 partners distributed the survey resulting in over 900 responses in the Columbia River Gorge. & Between August 2018 and March 2019, wineries and their partners worked to distribute the Winery Visitor survey to Columbia Gorge winery visitors.
- 5. Who are Gorge winery visitors? 5
- 6. Who is the Gorge wine tourist? Survey respondent demographics VISITORS 6 94% *A “non-local” visitor is defined as someone who traveled 50 miles or more to their destination.
- 7. Who is the Gorge wine tourist? Survey respondent demographics GENDER 68% Female VISITORS 7 94%
- 8. Who is the Gorge wine tourist? Survey respondent demographics ETHNICITY White 89% GENDER 68% Female VISITORS 8 94%
- 9. Who is the Gorge wine tourist? Survey respondent demographics ETHNICITY White 89% GENDER 68% Female VISITORS 9 94% INCOME 4% 16% 24% 25% 11% 21% < $39,999 $40,000 - $79,999 $80,000 - $119,999 $120,000 - $199,999 $200,000 or more I prefer not to answer
- 10. Who is the Gorge wine tourist? Survey respondent demographics ETHNICITY White 89% GENDER 68% Female VISITORS AGE 10 94% INCOME 4% 16% 24% 25% 11% 21% < $39,999 $40,000 - $79,999 $80,000 - $119,999 $120,000 - $199,999 $200,000 or more I prefer not to answer 12% 16% 21% 29% 19% 3% 21 - 34 35 - 44 45 - 54 55 - 64 65+ I prefer not to answer
- 11. Who is the Gorge wine tourist? 11 9% 3% 3% 3% 6% 23% 16% 13% 17% 18% 27% 22% 23% 18% 30%30% 29% 31% 22% 15% 6% 14% 10% 16% 7% 6% 16% 21% 23% 24% 21 - 34 35 - 44 45 - 54 55 - 64 65 or above > $39,999 $40,000 - $79,999 $80,000 - $119,999 $120,000 - $199,999 $200,000 or more I prefer not to answer Income by age group
- 12. Where do Oregon visitors go? Oregon map with top three regions highlighted 12 Source: Oregon Visitor Report: 2017, Longwoods International
- 13. Where are Gorge wine visitors going? Oregon map with top three regions highlighted COLUMBIA GORGE 13 Source: UO IPRE/OWB Study, 2018-2019
- 14. Oregon map with top three regions highlighted WILLAMETTE VALLEY Where are Willamette wine visitors going? 14 Source – WVWA Profile of Wine Tourists to Willamette Valley, January 2019. Destination Analysist Other destinations Oregon Coast Destinations
- 15. Key Insights 15 Wine visitors go to other destinations that are in close proximity to their wine destination. • 62% of Gorge wine visitors reported they were visiting Portland on the same trip they visited a winery. 37% said they were also visiting the Mount Hood area. • As a comparison, 21% of WV wine visitors said they were also visiting a destination in the Columbia Gorge. 51% said they were also visiting a city on the coast. •There could be an opportunity to cross-market with wineries in the Willamette Valley to draw more WV visitors to the Gorge.
- 16. Where do visitors come from? 16 We mapped respondent origin using answers to the question: “Where do you currently live? Please provide your home ZIP code.
- 17. 17 SURVEY RESPONDENT ORIGIN The survey received responses from all states except West Virginia, Delaware, and Rhode Island. All Regions Rogue, Umpqua, Gorge
- 19. 19 All Regions Rogue, Umpqua, Gorge SURVEY RESPONDENT ORIGIN
- 20. How did they find a winery to visit? 47% 19%20% 14% 13% Word of Mouth Website of winery Wine publication Free travel guide/map Road signs or billboards 43% 22%15% 23% 14% Gorge Willamette 20
- 21. Key Insights 21 •A majority of wine tourists rely on word of mouth recommendations to choose which wineries to visit •Wine tourists also use wineries’ websites and free travel guides/maps, but at higher rates in the Willamette Valley than other regions •Social media is currently not a popular resource among wine tourists •7% in the Gorge, Umpqua, and Rogue •12% in the Willamette Valley
- 22. How are they getting there? Personal automobile 7% Rental car 6% Walk 2% Tour bus Willamette Valley 87%Gorge 74% WillametteGorge 24% 7% 3% 22
- 23. Where are they staying? 10% 5% 10% 55% 40% Stayed overnight 41%WillametteGorge Average nights stayed 1.3WillametteGorge 12% 21% 19% 40% WillametteGorge Hotel With friends or family Airbnb or VRBO Bed & Breakfast 2.4 24
- 24. What are they doing? “What other activities did you participate in while on your trip?” 73% 32% 34% 9% 37% Dining Shopping Outdoor recreation Festival or special event Brewery or distillery 59% 22% 17% 7% 16% Gorge Willamette 25
- 25. How many wineries did they visit? “How many wineries did you visit or buy wine at as part of your trip?” In the Columbia Gorge, most visitors went to 1, 2, or 3 wineries One winery: 23% Two wineries: 27% Three wineries: 28% Four or more wineries: 22%
- 26. Outdoor Recreation Activities National Park Foundation Gorge 27 8% 9% 11% 12% 17% 92% Mountain Biking Fishing Road Cycling Swimming Canoeing Hiking Of those who participated in outdoor recreation on their trip to the Gorge.
- 27. $82 $73 $23 $23 $3 Dining Lodging Shopping Transportation Recreation Gorge $123 $104 $33 $39 $14 What are they spending on? Rogue Umpqua Willamette Valley $70 $32 $21 $16 $2 $63 $41 $17 $19 $2 28 Spending reported per party, per day
- 28. What are they spending on? $12 $102Rogue $20 $124Gorge $10 $145Umpqua $35 $194Willamette Valley Tasting Fees Wine Purchases 29 Spending reported per party, per day
- 29. Spending Methodology 30 Why are wine tourists spending more in the Willamette Valley? • Cross tabulation specification difference In short, there are methodology differences between the tabulation and reporting of statistics of the two reports. Please see the WVWA report for more detail on Willamette Valley wine tourist spending.
- 30. What winery qualities do they seek out? Gorge Aggregate Rogue Umpqua 49% 45% 31% 28% 24% 50% 42% 25% 33% 30% 51% 47% 31% 25% 22% 39% 40% 35% 34% 24% Natural beauty of property Ambience of tasting room Offers wines I know Discover new producers Affordability 31 In general, which of the following reasons are most important to you in choosing which wineries to visit? *Respondents could select three options.
- 32. Regional wine quality perceptions 33 One of the best Excellent Good Average Poor Undecided/ Not familiar Willamette Valley 34% 43% 15% 3% 0% 5% Napa Valley 22% 39% 23% 4% 0% 11% Walla Walla Valley 19% 36% 16% 2% 0% 26% Columbia Gorge 14% 50% 29% 4% 0% 3% Paso Robles 8% 23% 18% 4% 0% 47% Rogue Valley 2% 24% 26% 4% 0% 44% Umpqua Valley 2% 20% 25% 5% 0% 48% How would you rate the quality of wine that comes from the region? Respondents to this question had visited a winery in Columbia Gorge.
- 33. Regional wine attributes 34 Gorge Willamette Rogue Valley The wines are good value for the money 48% 36% 17% Produces a wide variety of wines 45% 40% 14% Many small artisanal producers 41% 43% 16% Different from other regions, a distinct style 39% 44% 17% Sustainable, organic, or ecologically beneficial growing practices 37% 49% 13% A reliable choice, even if you aren’t familiar with the specific winery 37% 51% 12% Prestigious or highly regarded by knowledgeable wine consumers 28% 64% 8% I don’t know enough about this region to select attributes 14% 15% 71% What attributes would you associate with each of these three region’s wines? Respondents to this question had visited a winery in Columbia Gorge.
- 34. Barriers to visitation 35 7% 14% 21% 21% 29% 36% Prefer to go somewhere else Don't have enough time Lack of convenient or farily priced transportation Other Too far to travel Lack of information What factors have prevented you from visiting the Columbia Gorge? Respondents to this question were not local and had never visited the region.
- 35. DISCUSSION How do these findings differ from or align with your expectations? 36
- 37. Visitor personas • Oregon resident • Out-of-state visitor • Gorge visitor • Paid lodging visitor • Millennial • Outdoor enthusiast • Day tripper Data reported on the following Visitor Personas is from all regions (Rogue, Umpqua, and Columbia Gorge), with the exception of “Gorge visitor” which contains data specific to of non-local Gorge wine tourists
- 38. WINERY VISITOR PROFILE VISITOR PERSONAS Oregon local 72 RESIDENCY Age: 65 or above (30%) Race/Ethnicity: White (89%) Gender: Female (66%) Trip characteristics 78% say that visiting wineries was the primary reason for their trip. 22% were on overnight trips. Oregon residents spend about $249 per day per party during their trips. When selecting a winery, they seek: • Natural beauty of property (50%) • Ambience, quality of tasting room (46%) • Wines the visitor knows and likes (32%) Once at a winery, they most enjoy: • Staff friendliness / hospitality (68%) • Attractiveness of facility / grounds (38%) • Ambience / social atmosphere (37%) Social media habits When using social media to find wineries, they turn to… 39% Instagram 92% Facebook 7% Twitter 10% Pinterest Income Activities Oregon resident’s favorite activities to enjoy while on their winery trip are: Bottles purchased 4.95 (average) 83% visited 1-3 wineries while on their trip 5% 21% 26% 21% 10% <$40k $40- 79k $80- 119k $120- 199k >$200k 70% 28% 27% 24% 23% (n = 2,962)
- 39. WINERY VISITOR PROFILE Out-of-state visitor Age: 55 to 64 (36%) Race/Ethnicity: White (87%) Gender: Female (58%) Trip characteristics 49% say that visiting wineries was the primary reason for their trip. 69% were on overnight trips. Out-of-state visitors spend about $361 per day per party during their trips. When selecting a winery, they seek: • Natural beauty of property (46%) • Ambience, quality of tasting room (41%) • Opportunity to discover new producers (38%) Once at a winery, they enjoy: • Staff friendliness / hospitality (66%) • Presentation / wine knowledge of host (44%) • Attractiveness of facility / grounds (35%) Social media habits When using social media to find wineries, they turn to… 49% Instagram 89% Facebook 15% Youtube Income Activities Their favorite activities to enjoy while on their winery trip are: Bottles purchased 7.09 (average) Home state California 37.7% Washington 29.6% Nevada 3.7% 80% 46% 33% 30% 28% 3% 16% 19% 26% 13% 68% visited 1-3 wineries while on their trip 20% Pinterest (n = 855) 73 VISITOR PERSONAS RESIDENCY
- 40. WINERY VISITOR PROFILE Gorge visitor Age: 35 to 44 (35%) Race/Ethnicity: White (90%) Gender: Female (68%) Trip characteristics 67% say that visiting wineries was the primary reason for their trip. 44% are on overnight trips. Gorge visitors spend about $332 per day per party during their trips. When selecting a winery, they seek: • Natural beauty of property (52%) • Ambience, quality of tasting room (43%) • Opportunity to discover new producers (37%) Once at a winery, they enjoy: • Staff friendliness / hospitality (67%) • Presentation / wine knowledge of host (41%) • Attractiveness of facility / grounds (37%) Social media habits When using social media to find wineries, they turn to… 53% Instagram 86% Facebook Income Activities Their favorite activities to enjoy while on their winery trip are: Bottles purchased 5.46 (average) 76% visited 1-3 wineries while on their trip 7% Youtube 12% Pinterest 4% 16% 22% 26% 11% <$40k $40- 79k $80- 119k $120- 199k >$200k 75% 37% 35% 34% 26% (n = 644) 76 VISITOR PERSONAS RESIDENCY
- 41. WINERY VISITOR PROFILE Paid lodging visitor Age: 35 to 44 (32%) Race/Ethnicity: White (89%) Gender: Female (60%) Trip characteristics 52% say that visiting wineries was the primary reason for their trip. They spend about $196 per day per party during their trips. When selecting a winery, they seek: • Ambience, quality of tasting room (44%) • Natural beauty of property (43%) • Opportunity to discover new producers (37%) Once at a winery, they enjoy: • Staff friendliness / hospitality (74%) • Presentation / wine knowledge of host (43%) • Attractiveness of facility / grounds (35%) Income Activities Their favorite activities to enjoy while on their winery trip are: Bottles purchased 7.79 (average) Social media habits When using social media to find wineries, they turn to… 46% Instagram 93% Facebook 15% Youtube Accommodations These visitors paid for lodging in the region during their trips. 17% Airbnb 56% Hotel 7% Campground/RV Park 13% Bed & Breakfast 5% 21% 24% 20% 10% <$40k $40- 79k $80- 119k $120- 199k >$200k 58% visited 1-3 wineries while on their trip 83% 40% 31% 31% 29% 13% Pinterest (n = 828) 81 VISITOR PERSONAS TRIP ACTIVITIES
- 42. WINERY VISITOR PROFILE Millennial Age: 21 to 34 (8% of all responses) Race/Ethnicity: White (87%) Gender: Female (80%) Trip characteristics 74% say that visiting wineries was the primary reason for their trip. 28% are on overnight trips. They spend about $245 per day per party during their trips. When selecting a winery, they seek: • Natural beauty of property (60%) • Ambience, quality of tasting room (45%) • Affordability (35%) Once at a winery, they enjoy: • Staff friendliness / hospitality (60%) • Attractiveness of facility / grounds (43%) • Ambience / social atmosphere (43%) Income Activities Their favorite activities to enjoy while on their winery trip are: Bottles purchased 4.02 (average) Social media habits When using social media to find wineries, they turn to… 72% Instagram 67% Facebook 10% Youtube 81% visited 1-3 wineries while on their trip 12% 26% 28% 21% 6% <$40k $40- 79k $80- 119k $120- 199k >$200k 70% 38% 38% 33% 22% 10% Pinterest (n = 310) 77 VISITOR PERSONAS GENERATION
- 43. WINERY VISITOR PROFILE Outdoor enthusiast Age: 55 or above (60%) Race/Ethnicity: White (88%) Gender: Female (63%) Trip characteristics 76% say that visiting wineries was the primary reason for their trip. 27% are on overnight trips. Outdoor enthusiasts spend about $231 per day per party during their trips. When selecting a winery, they seek: • Natural beauty of property(48%) • Ambience, quality of tasting room(42%) • Wines the visitor knows and likes(29%) Once at a winery, they enjoy: • Staff friendliness (65%) • Host’s wine knowledge (36%) • Facility attractiveness (36%) Income Activities Their favorite activities to enjoy while on their winery trip are: Bottles purchased 4.85 (average) Social media habits When using social media to find wineries, they turn to… 47% Instagram 91% Facebook 12% 26% 28% 21% 6% <$40k $40- 79k $80- 119k $120- 199k >$200k 81% visited 1-3 wineries while on their trip 68% 34% 33% 26% 25% 11% Youtube 14% Pinterest Outdoor pursuits • Hiking (83%) • Canoeing or kayaking (21%) • Swimming (17%) • Fishing (17%) • Golfing (14%) (n = 267) These visitors indicated that they participated in outdoor activities while on their winery trip. 84 VISITOR PERSONAS TRIP ACTIVITIES
- 44. WINERY VISITOR PROFILE Day tripper Age: 65 or above (33%) Race/Ethnicity: White (90%) Gender: Female (65%) Trip characteristics 83% say that visiting wineries was the primary reason for their trip. Day trippers spend about $208 per day per party during their trips. When selecting a winery, they seek: • Natural beauty of property (52%) • Ambience, quality of tasting room (49%) • Wines the visitor knows and likes (33%) Once at a winery, they enjoy: • Staff friendliness / hospitality (69%) • Attractiveness of facility / grounds (40.4%) • Ambience / social atmosphere (40.1%) Income Activities Their favorite activities to enjoy while on their winery trip are: Bottles purchased 4.32 (average) Social media habits When using social media to find wineries, they turn to… 35% Instagram 93% Facebook Day trippers travel in for the day to visit wineries and enjoy the region, but don’t stay overnight in the region. 5% 21% 26% 20% 10% <$40k $40- 79k $80- 119k $120- 199k >$200k 87% visited 1-3 wineries while on their trip 68% 27% 25% 21% 21% 8% Twitter 10% Pinterest (n = 2,638) 80 VISITOR PERSONAS TRIP ACTIVITIES
- 45. Identified Opportunities 40 Preliminary opportunities for partnership, increased exploration, collaboration, and marketing on how capitalize on wine tourists based on relevant literature
- 46. Agritourism • Agritourism: Activity that invites visitors to experience a farm (or vineyard) • Wine and grape education • Winery and vineyard tours • Farm stays • Entertainment: dinners, live music, festivals, weddings • On-farm sales • Exclusive Farm Use zoning • Well-aligned with Oregon’s brand • Opportunity for wineries to enhance tourists’ experience CWK Photography 41
- 47. Sustainable practices • Certifications for sustainability and organic growing practices • Popular among Oregon’s wine producers, sustainability aligns with Oregon’s brand • Increasingly popular among consumers, especially millennials Andrea Johnson / Brooks Winery. 42
- 48. Winery experience • Winescape • Setting • Atmospherics • Wine Products • Complementary Product • Signage • Layout • Service staff • Positive experiences > positive memories > brand loyalty 43
- 49. Inclusion • Beyond the historically targeted market • Exclusion in marketing actively discourages a broader customer base • Lose millennials when marketing is not diverse and inclusive • “Savvy Shoppers” and “Overwhelmed” consumers: 28% of purchases NashCO Photo 44
- 50. Millennials • 42% of wine sales, larger market share than Gen X • Seek authenticity and novelty, don’t value formality or expense • Key values • Authenticity • Experiences • Influencers • Sustainability Carolyn Wells Kramer 45
- 51. Extreme weather • Extreme weather: drought, flood, ice storm, wildfire • Increasingly common • Impacts tourism and wine production • Planning for extreme weather is increasingly important 46
- 53. Suggestions & comments Alternative Activities Winery Staff Cost & Pricing Food Options Geographic Accessibility Top five categories of responses: When asked, “Do you have any other suggestions or comments about your experience?” 48
- 54. 49 Alternative Activities What other activities were respondents interested in pairing with wine? • Pairing wine experience with additional activities (i.e. outdoor recreation, events/festivals, live music) • Locals and tourists are both interested in receiving marketing for special events or promotions • Call for high quality lodging and restaurants to round out the experience
- 55. 50 Staff Staff play a key role in creating an enjoyable experience • Visitors want staff who are friendly and knowledgeable • Visitors want to have access to the owner/wine maker • If visitors have a negative experience with the staff, their whole winery visit can be perceived less positively
- 56. Cost Winery visitors can be very cost-conscious • Visitors expressed dissatisfaction with increasing costs of tasting fees & wine • Visitors wanted tasting fees waived for wine club members or if bottle(s) are purchased • Some concern that increasing prices will change the ambience of the area
- 57. Food Visitors see a strong connection between wineries and food • Visitors appreciate some sort of food offering, and even expect it • Visitors are interested in pairings, local foods, and not drinking on an empty stomach • Food options entice visitors to stay longer, visit more wineries
- 58. David Gibb Photography 53 Geographic Accessibility Even when wineries are rural, visitors want them to be accessible • Visitors enjoy wineries that are easily car-accessible – close to urban areas • For more rural wineries, high quality signage is very important • Some visitors requested more non-driving modes of travel (i.e. tours, Uber/Lyft, shuttle services) • Visitors want accurate, up-to-date maps including hours of operation
- 59. DISCUSSION • How do you anticipate incorporating these results into your work? • Do these recommendations align with what you see wineries in your region doing? • What opportunities are there for cross-industry collaboration between wine and tourism? 54
- 60. Thank you! Questions for the University of Oregon, Institute for Policy Research & Engagement? Aniko Drlik-Muehleck, aniko@uoregon.edu www.ipre.uoregon.edu Questions for the Oregon Wine Board? Jess Willey, jessica@oregonwine.org industry.oregonwine.org 55