SlideShare une entreprise Scribd logo
1  sur  13
Télécharger pour lire hors ligne
June 1, 2010 Budget Information
                             Version 3--Licensed finalized

General: A deficiency of expenditures over revenues results in fund balance depletion.
 The opposite, a surplus of revenues over expenditures, results in fund balance growth.

As assumptions change due to board decisions and the negotiations process,
   the numbers will change as well until the budget adoption on June 15.
.
FY11                                                                                      FY10-FY11


                General Fund Fund 10 Expenditure Increases
Steps                                                                                $           397,357
Lanes                                                                                            112,615
2.1% Utah State Retirement                                                                       537,807
3.5% inflation on supplies and services                                                          123,000
5% inflation on pupil transportation motor fuel                                                    8,000
Language Arts Adoption                                                                           250,000
6 Licensed Days                                                                                  530,543
Licensed Professional Development                                                                300,000
10% Insurance increase (January-June)                                                            186,000
Move $1,615 ESA to within Salary Schedule                                                         31,537
Alternative Ed. Director                                                                         138,038
Technology Specialist                                                                             53,916
RT Intervention Aides (Tom Van Gorder)                                                           126,146
                                                             Total Fund 10 Increases: $        2,794,959


               General Fund Fund 10 Expenditure Decreases

7 Teacher FTE Reduction (through attrition, $78,500 average salary and benefits)                 (549,500)
7 Para-Professionals (Commensurate with Licensed FTE reduction)                                  (218,288)
Early Retirement Fund Payout in FY10                                                             (650,000)
School Textbook Allocation                                                                        (59,000)
                                                         Total Fund 10 Decreases: $            (1,476,788)

                                              Total Fund 10 Net Expenditure Change: $          1,318,171


                       Capital Outlay Fund 32 Increases
Board-Approved Capital Outlay requests                                                         2,100,000
Continued High Access Technology                                                               1,250,000
                                                                     Total Increases: $        3,350,000

                                      Revenues
Certified Tax Rate--no increase or decrease
Basic rate increase $283,000 (added to recapture)
Ten Percent of Basic Levy flows entirely into Fund 10

FY12

                                    Expenditures

No step or lane changes
Insurance increases not included


                                      Revenues
Certified Tax Rate--no increase or decrease
State reductions include:
   WPUs, Flexible WPU and Class Size Reduction loses


FY13

                                    Expenditures

No step or lane changes
12% Insurance increase, not included


                                      Revenues
Certified Tax Rate--no increase or decrease
(Basic rate increases @$250k)
Payment of $400 In-Lieu per student who attends charter
Park City School District
                                              FOR INFORMATIONAL PURPOSES ONLY
The General Fund                                                                                                                                             Current as of: June 1, 2010
Summary Statement of Revenues, Expenditures, and Changes in Fund Balances

                                                                                                                         -350 Students                              FY2012-FY2013
                                                    Actual             Actual            Revised       Preliminary         Preliminary     Preliminary            Increase     Percent
                                                  2007-2008          2008-2009          2009-2010       2010-2011           2011-2012       2012-2013            (Decrease)    Change
Revenues:
  Local Sources                              $     30,588,383    $    35,247,869    $    36,543,316    $   37,727,955    $   36,589,955    $   36,589,955    $            -          0%
  State Sources                                     7,660,897          4,399,052          2,046,965         2,181,172         1,134,722           994,722            (140,000)     -12%
  Federal Sources                                   1,109,005          2,738,862          2,447,480         1,486,963         1,027,802         1,027,802                 -          0%
                        Total Revenues             39,358,285    $    42,385,783    $    41,037,761    $   41,396,090    $   38,752,479    $   38,612,479    $       (140,000)        0%

Expenditures:
  Instruction                                      23,313,971    $    25,923,311    $    27,593,914    $   28,092,779    $   28,092,779    $   28,092,779    $            -           0%
  Support Services:
     Student Services                               1,436,839          1,571,783          1,604,038         1,674,062    $    1,674,062         1,674,062                 -           0%
     Staff Services                                   734,755          1,609,746          1,424,634         1,819,823         1,819,823         1,819,823                 -           0%
     District Administration                        1,764,313          1,789,618          1,656,176         1,827,944         1,827,944         1,827,944                 -           0%
     School Administration                          2,081,044          2,139,330          2,027,605         2,034,464         2,034,464         2,034,464                 -           0%
     Business Administration                          622,563            502,846            531,454           532,076           532,076           532,076                 -           0%
     Operation & Maintenance of Facilities          4,827,197          5,403,406          5,330,369         5,479,911         5,479,911         5,479,911                 -           0%
     To and From Transportation                     1,548,788          1,877,611          1,723,390         1,748,692         1,748,692         1,748,692                 -           0%
                    Total Expenditures             36,329,470    $    40,817,651    $    41,891,580    $   43,209,751    $   43,209,751    $   43,209,751    $            -           0%

Excess (Deficiency) of Revenues
  Over Expenditures                                 3,028,815    $     1,568,132    $      (853,819)   $   (1,813,661)   $   (4,457,272)   $   (4,597,272)   $       (140,000)        3%

Other Financing Sources (Uses):
  Transfers In (Out)                                  (92,457)   $       (96,357)   $           -      $          -      $          -      $          -      $            -      0%
     Total Other Financing Sources (Uses)             (92,457)   $       (96,357)   $           -      $          -      $          -      $          -      $            -      -----

Excess (Deficiency) of Revenues
  and Other Financing Sources
  Over Expenditures*                                2,936,358    $     1,471,775    $      (853,819)   $   (1,813,661)   $   (4,457,272)   $   (4,597,272)

Fund Balances - Beginning of Year                   7,763,643         10,693,855         12,165,630        11,311,811         9,498,150         5,040,878
Fund Balances - End of Year                  $     10,693,855    $    12,165,630    $    11,311,811    $    9,498,150    $    5,040,878    $     443,606

Summary of Fund Balances - End of Year:
  Reserved for:
    Encumbrances and Inventories              $      292,214     $       292,214    $      300,000     $     300,000     $     300,000     $     300,000
  Designated for:
    Early Retirement Incentive                      1,299,147          1,299,147            621,928           385,424           176,670            26,042
    Self-Funding Reserve                                    0                  0            220,000           440,000           880,000         1,320,000
    Undistributed Reserve (5% of Bdgt Expend)       1,816,474          2,040,883          2,094,579         2,160,488         2,160,488         2,160,488
  Undesignated (Available for Appropriation)        7,292,166          8,533,386          8,075,304         6,212,238         1,523,720        (3,362,924)
    Total Fund Balances                       $    10,700,001    $    12,165,630    $    11,311,811    $    9,498,150    $    5,040,878    $      443,606
Park City School District

The General Fund                                                                                                         Current as of: June 1, 2010
Summary Statement of Revenues, Expenditures, and Changes in Fund Balances

                                                                                                                                FY2010-FY2011
                                                    Actual            Original           Revised       Preliminary            Increase    Percent
                                                  2008-2009          2009-2010          2009-2010       2010-2011            (Decrease)   Change
Revenues:
  Local Sources                              $     35,247,869    $ 34,436,733       $ 36,543,316       $ 37,727,955      $      1,184,639        3%
  State Sources                                     4,399,052       3,946,743          2,046,965          2,181,172               134,207        7%
  Federal Sources                                   2,738,862       2,875,973          2,447,480          1,486,963              (960,517)     -39%
                        Total Revenues       $     42,385,783    $ 41,259,449       $ 41,037,761       $ 41,396,090      $       358,329          1%

Expenditures:
  Instruction                                $     25,923,311    $ 25,674,262       $ 27,593,914       $ 28,092,779      $       498,865          2%
  Support Services:
     Student Services                               1,571,783          1,663,306          1,604,038         1,674,062             70,024         4%
     Staff Services*                                1,609,746          1,778,539          1,424,634         1,819,823            395,189        28%
     District Administration                        1,789,618          1,753,038          1,656,176         1,827,944            171,768        10%
     School Administration                          2,139,330          2,285,029          2,027,605         2,034,464              6,859         0%
     Business Administration                          502,846            549,483            531,454           532,076                622         0%
     Operation & Maintenance of Facilities          5,403,406          5,886,709          5,330,369         5,479,911            149,542         3%
     To and From Transportation                     1,877,611          2,340,727          1,723,390         1,748,692             25,302         1%
                    Total Expenditures       $     40,817,651    $ 41,931,093       $ 41,891,580       $ 43,209,751      $      1,318,171         3%

Excess (Deficiency) of Revenues
  Over Expenditures                          $      1,568,132    $      (671,644)   $      (853,819)   $   (1,813,661)   $       (959,842)    112%

Other Financing Sources (Uses):
  Transfers In (Out)                         $        (96,357)   $           -      $           -      $          -      $            -      0%
     Total Other Financing Sources (Uses)    $        (96,357)   $           -      $           -      $          -      $            -      -----

Excess (Deficiency) of Revenues
  and Other Financing Sources
  Over Expenditures*                         $      1,471,775    $      (671,644)   $      (853,819)   $   (1,813,661)

Fund Balances - Beginning of Year                  10,693,855         12,165,630         12,165,630        11,311,811
Fund Balances - End of Year                  $     12,165,630    $ 11,493,986       $ 11,311,811       $    9,498,150

Summary of Fund Balances - End of Year:
  Reserved for:
    Encumbrances and Inventories              $       292,214    $      300,000     $      300,000     $     300,000
  Designated for:
    Employee Benefits
    Early Retirement Incentive                      1,299,147            621,925            621,928           385,424
    Self-Funding Reserve                                    0                  0            220,000           440,000
    Undistributed Reserve (5% of Bdgt Expend)       2,040,883          2,096,555          2,094,579         2,160,488
  Undesignated (Available for Appropriation)        8,533,386          8,475,506          8,075,304         6,212,238
     Total Fund Balances                     $     12,165,630    $ 11,493,986       $ 11,311,811       $    9,498,150
Park City School District


The General Fund                                                                                                       Current as of: June 1, 2010
Revenues

                                                                                                                           FY2010-FY2011
                                                      Actual         Original        Revised       Preliminary          Increase     Percent
                                                    2008-2009       2009-2010       2009-2010      2010-2011           (Decrease)    Change
Local Sources:
  1100 - Property Taxes
     Basic                                      $    15,114,625    $ 17,168,929    $ 17,419,700    $ 17,452,110    $        32,410            0%
     Voted Leeway                                    17,266,948      15,599,404      15,827,250      16,448,585            621,335            4%
     K-3 Reading                                        677,135         670,942         680,742         645,947            (34,795)          -5%
     Special Transportation                             519,943         263,584         267,434         945,851            678,417          254%
     Tort Liability                                      60,459          35,943          36,468          34,604             (1,864)          -5%
     Judgment                                                 0          59,113          60,781          57,674             (3,107)          -5%
     Ten Percent of Basic                                     0               0       1,507,357       1,430,313            (77,044)          -5%
  1500 - Earnings on Investments                        326,625          33,718          98,584          67,871            (30,713)         -31%
  1900 - Local Revenue                                   49,155           5,100          45,000          45,000                  0            0%
  1960 - Local Governments                              785,733         600,000         600,000         600,000                  0            0%
                       Total Local Sources      $    34,800,623    $ 34,436,733    $ 36,543,316    $ 37,727,955    $     1,184,639            3%

State Sources:
    Minimum School Program
  3010 - Foreign Exchange                       $         2,577    $      2,577    $        -      $        -                    0             0%
  3010 - Charter School Local Replacement                  (785)           (785)         (1,925)         (1,925)                 0             0%
  3010 - Regular School Programs - K-12              10,988,039      10,988,824      11,097,881      11,097,881                  0             0%
  3020 - Professional Staff                           1,130,625       1,130,625       1,109,788       1,109,788                  0             0%
  3025 - Administrative Costs                           123,696         154,620         154,620         154,620                  0             0%
  3100 - Special Education                            1,216,311       1,171,546       1,221,365       1,218,787             (2,578)            0%
  3155 - Career and Technology Education                390,118         369,591         525,869         497,219            (28,650)           -5%
  3230 - Class Size Reduction                           688,689         686,563         705,336         719,052             13,716             2%
    Less Basic Levy                                 (15,017,601)    (17,067,029)    (17,317,800)    (17,375,561)           (57,761)            0%
                 Total Basic School Program     $      (478,331)   $ (2,563,468)   $ (2,504,866)   $ (2,580,139)   $       (75,273)           3%

  Other Minimum School Program
  3211 - Gifted and Talented                    $        27,346    $    19,598     $    15,714     $    15,054     $          (660)          -4%
  3212 - Advanced Placement                              84,703         61,967          68,725          67,311              (1,414)          -2%
  3213 - Concurrent Enrollment                           39,771         43,742               0               0                   0            0%
  3215 - At-Risk Regular Program                         41,109         39,819          36,985          36,105                (880)          -2%
  3218 - At-Risk Homeless & Minority                      7,575          9,500           9,336               0              (9,336)        -100%
  3255 - Quality Teaching Block Grant                   533,712              0               0               0                   0            0%
  3260 - Local Discretionary Block Grant                120,820              0               0               0                   0            0%
  3270 - Interventions for Student Success BG           183,791        143,976         138,386         136,508              (1,878)          -1%
  3405 - SS&R / 2011 Flexible WPU                     1,231,378      1,441,265       1,332,479       1,690,235             357,756           27%
  3415 - Pupil Transportation                           882,605        771,110         769,076         848,066              78,990           10%
  3468 - Nurses                                          11,785          7,575          10,343           9,404                (939)          -9%
  3520 - School LAND Trust                              180,085        188,429         235,862         235,862                   0            0%
  3640 - Extended Day K                                  54,235         54,235          56,110          56,110                   0            0%
  3805 - Reading Achievement                             30,886         30,886          28,571          28,000                (571)          -2%
  3810 - Library Books and Electronic Res.               12,330         12,446           4,077           3,450                (627)         -15%
  3851 - Classroom Supplies and Materials               111,999         91,926         105,448          51,254             (54,194)         -51%
  3876 - Educator Salary Adjustment                   1,556,773      1,422,026       1,562,343       1,562,343                   0            0%
  3877 - One-Time Signing Bonus                          48,422              0               0               0                   0            0%
  3900 - Other State Revenue                            335,757      2,171,711         178,376          21,609            (156,767)         -88%
  State Revenue adjustment                             (677,135)      (670,942)              0               0                   0            0%
    Total Other Minimum School Program                4,817,947      6,510,211       4,551,831       4,761,311             209,480            5%
                          Total State Support   $     4,339,616    $ 3,946,743     $ 2,046,965     $ 2,181,172     $       134,207            7%
FY2010-FY2011
                                                     Actual        Original       Revised      Preliminary         Increase     Percent
                                                   2008-2009      2009-2010      2009-2010     2010-2011          (Decrease)    Change
Federal Sources:
  4520 - IDEA Special Education                $       773,809   $    767,147   $    801,389   $    742,802   $       (58,587)       -7%
  4530 - Applied Technology                             35,530              0         35,528         35,000              (528)       -1%
  4810 - Forest Reserve                                 53,664         50,000         50,000         50,000                 0         0%
  4800 - NCLB                                          213,398        250,000        200,000        200,000                 0         0%
  7661 - ARRA--Stabilization                         1,662,461      1,347,645        895,837              0          (895,837)     -100%
  7662 - ARRA--Title I                                       0         57,768         57,768         57,768                 0         0%
  7664 - ARRA--Special Ed                                    0        401,393        401,393        401,393                 0         0%
  7670 - ARRA--Other                                         0          2,020          5,565              0            (5,565)     -100%
                       Total Federal Sources         2,738,862      2,875,973      2,447,480      1,486,963          (960,517)      -39%
                              Total Revenues   $    41,879,101   $ 41,259,449   $ 41,037,761   $ 41,396,090   $       358,329         1%
Park City School District
The General Fund                                                                                                       Current as of: June 1, 2010
Expenditures

                                                                                                                          FY2010-FY2011
                                                Actual           Original          Revised      Preliminary          Increase       Percent
                                              2008-2009         2009-2010         2009-2010      2010-2011          (Decrease)      Change

Instruction (1000):
  Salaries:
  131 - Teachers - Certificated           $ 15,368,405      $ 14,002,256      $ 15,719,025      $ 16,194,220    $       475,195               3%
  132 - Substitute Teachers                    231,082           243,346           250,492           258,007              7,515               3%
  136 - Teachers - Hourly                      110,760            18,589            23,460            24,164                704               3%
  161 - Paraprofessionals                    2,148,088         1,801,307         2,286,719         2,331,700             44,981               2%
                        Total Salaries    $ 17,858,335      $ 16,065,498      $ 18,279,696      $ 18,808,091    $       528,395               3%

  Employee Benefits:
  210 - State Retirement                        2,670,058         2,453,202         2,816,053       2,936,093           120,040               4%
  220 - Social Security                         1,370,885         1,229,011         1,430,080       1,438,819             8,739               1%
  240 - Group Insurance                         2,403,350         3,747,319         3,074,932       3,132,182            57,250               2%
  290 - District Retiree/Other Benefits           446,306           884,170           662,400         209,265          (453,135)            -68%
     Total Employee Benefits              $     6,890,599   $     8,313,702   $     7,983,465   $   7,716,359   $      (267,106)              -3%

  Purchased Services:
  300 - Purchased Services                       103,660           105,067            73,430          76,000              2,570               3%
  500 - Other Purchased Services                 105,325           142,939           133,213         137,875              4,662               3%
     Total Purchased Services             $      208,985    $      248,006    $      206,643    $    213,875    $         7,232               3%

  Supplies and Materials:
  610 - 640 - Supplies                           637,218           786,365           814,902         843,424             28,522               4%
  641 - Textbooks                                280,639           189,087           236,594         435,875            199,281              84%
  670 - Software                                  47,535            71,604            72,614          75,155              2,541               3%
     Total Supplies and Materials                965,392          1,047,056         1,124,110       1,354,454           230,344              20%
                      Total Instruction   $ 25,923,311      $ 25,674,262      $ 27,593,914      $ 28,092,779    $       498,865               2%

Student Services (2100):
  Salaries:
  142 - Guidance Personnel                       835,809           840,956           806,992         848,956             41,964               5%
  143 - Health Services Personnel                 92,724            93,843            90,664          95,379              4,715               5%
  152 - Secretarial, Clerical and Other          103,155           101,041           104,052         104,052                  0               0%
                        Total Salaries    $     1,031,688   $     1,035,840   $     1,001,708   $   1,048,387   $        46,679               5%

  200 - Employee Benefits                        431,249           517,947           413,116         429,839             16,723               4%
  300 - Purchased Services                        67,383            63,391           107,454         111,215              3,761               4%
  500 - Other Purchased Services                  10,996            10,343            19,667          20,355                688               3%
  600 - Supplies and Materials                    30,467            35,785            62,093          64,266              2,173               3%
               Total Student Services     $     1,571,783   $     1,663,306   $     1,604,038   $   1,674,062   $        70,024               4%
Park City School District
The General Fund                                                                                                       Current as of: June 1, 2010
Expenditures

                                                                                                                          FY2010-FY2011
                                                Actual           Original          Revised      Preliminary          Increase       Percent
                                              2008-2009         2009-2010         2009-2010      2010-2011          (Decrease)      Change

Staff Services (2200):
  Salaries:
  131 - Teacher Prof. Dev.                       519,703           439,239           268,089         568,089            300,000             112%
  132 - Substitutes Prof. Dev.                         0           177,172           141,133         141,133                  0               0%
  145 - Media Personnel                          424,119           440,214           407,848         430,687             22,839               6%
  161 and 162 - Paraprofessionals                 23,055            45,766            73,984          73,984                  0               0%
                        Total Salaries    $      966,877    $     1,102,391   $      891,054    $   1,213,893   $       322,839              36%

  200 - Employee Benefits                        248,835           306,575           235,160         297,065             61,905              26%
  300 - Purchased Services                       129,619           163,862            41,025          42,461              1,436                4%
  500 - Travel, Communication                    102,884            43,142           102,710         106,305              3,595                4%
  610 - 630 Supplies                              50,889            38,074            71,765          74,277              2,512                4%
  644 - Library Books                             52,524            77,971            45,863          47,468              1,605                3%
  645 - Periodicals                               19,072            18,012            19,600          20,286                686                4%
  660 - Audio Visual Materials                    26,526            25,057            17,457          18,068                611                4%
  670 - Software                                  12,520             3,455               -               -                  -                 -----
     Total Instructional Staff Services   $     1,609,746   $     1,778,539   $     1,424,634   $   1,819,823   $       395,189              28%

District Administration (2300):
  Salaries:
  110 - Board and Administration                 170,520           171,020           168,020         168,020                  0               0%
  115 - Supervisors and Directors                378,459           379,077           379,683         491,183            111,500              29%
  152 - Secretarial                              281,918           279,650           275,458         275,458                  0               0%
  100 - All Other                                 99,254            69,869            11,596          11,596                  0               0%
                        Total Salaries    $      930,151    $      899,616    $      834,757    $    946,257    $       111,500              13%

  200 - Employee Benefits                        377,932           411,931           360,819         406,891             46,072              13%
  300 - Purchased Services                       234,176           261,340           239,569         247,954              8,385               4%
  500 - Other Purchased Services                 177,317            51,088            86,553          89,582              3,029               3%
  600 - Supplies and Materials                    68,695            43,483            79,478          82,260              2,782               4%
  800 - Other                                      1,347            85,580            55,000          55,000                  0               0%
          Total District Administration   $     1,789,618   $     1,753,038   $     1,656,176   $   1,827,944   $       171,768              10%

School Administration (2400):
  Salaries:
  121 - Principals and Assistants                953,878           989,669          1,016,042       1,016,042                   0             0%
  152 - Secretarial and Clerical                 444,190           457,890            389,705         389,705                   0             0%
  100 - Other Salaries                            71,483            30,914              9,467           9,467                   0             0%
                        Total Salaries    $     1,469,551   $     1,478,473   $     1,415,214   $   1,415,214   $           -                 0%

  200 - Employee Benefits                        602,378           746,772           574,698         580,238              5,540               1%
  500 - Other Purchased Services                  49,309            37,318            25,138          26,018                880               4%
  600 - Supplies & Materials                      18,092            22,466            12,555          12,994                439               3%
          Total School Administration     $     2,139,330   $     2,285,029   $     2,027,605   $   2,034,464   $         6,859               0%

Business Services (2500):
  100 - Salaries                                 356,512           350,391           364,432         364,432                  0               0%
  200 - Employee Benefits                        122,665           172,016           124,528         123,907               (621)              0%
  500 - Other Purchased Services                   5,397             3,939             6,990           6,990                  0               0%
  600 - Supplies and Materials                     2,029             9,330            18,542          19,191                649               4%
  800 - Other                                     16,243            13,807            16,962          17,556                594               4%
              Total Business Services     $      502,846    $      549,483    $      531,454    $    532,076    $           622               0%
Park City School District
The General Fund                                                                                                        Current as of: June 1, 2010
Expenditures

                                                                                                                           FY2010-FY2011
                                                 Actual           Original          Revised      Preliminary          Increase       Percent
                                               2008-2009         2009-2010         2009-2010      2010-2011          (Decrease)      Change

Operation & Maint. of Facilities (2600):
  Salaries:
  180 - Custodial/Maint./Tech Personnel          1,827,953         1,862,687         1,888,572       1,923,386            34,814               2%
  100 - Other Salaries                              23,700            29,962            26,624          26,624                 0               0%
                       Total Salaries      $     1,851,653   $     1,892,649   $     1,915,196   $   1,950,010   $        34,814               2%

  200 - Employee Benefits                          761,746           848,671           871,554         897,255            25,701               3%
  300 - Purchased Services                           8,987            29,592            24,516          25,374               858               3%
  400 - Purchased Property Services              1,156,325         1,392,440         1,005,823       1,041,027            35,204               4%
  500 - Other Purchased Services                    33,391            22,402            28,715          29,720             1,005               3%
  600 - Supplies and Materials                   1,591,304         1,700,955         1,484,565       1,536,525            51,960               4%
       Total Operation & Maintenance       $     5,403,406   $     5,886,709   $     5,330,369   $   5,479,911   $       149,542               3%

Student Transportation (2700):
  Salaries:
  152 - Secretarial and Clerical                   58,404            58,639            56,855          56,855                    0             0%
  171 - Transportation Supervisors                108,276           121,334            98,542          98,542                    0             0%
  172 - Bus Drivers                               682,417           681,456           586,935         586,935                    0             0%
  173 - Mechanics                                 175,615           206,481           165,487         165,487                    0             0%
                       Total Salaries      $     1,024,712   $     1,067,910   $      907,819    $    907,819    $           -                 0%

  200 - Employee Benefits                         438,236           537,063           386,027         390,362              4,335               1%
  300 - Purchased Services                              0                 0             2,755           2,851                 96               3%
  400 - Purchased Property Services                34,046            33,333            18,588          19,239                651               4%
  500 - Other Purchased Services                   25,634            20,438            12,678          13,122                444               4%
  626 - Motor Fuel                                118,764           261,598           153,729         161,415              7,686               5%
  600 - Other Supplies                            236,219           420,385           241,794         253,884             12,090               5%
         Total Student Transportation      $     1,877,611   $     2,340,727   $     1,723,390   $   1,748,692   $        25,302               1%


                 Total Expenditures        $ 40,817,651      $ 41,931,093      $ 41,891,580      $ 43,209,751    $     1,318,171               3%


Total Expenditures
  Salaries                                 $ 25,489,479      $ 23,892,768      $ 25,609,876      $ 26,654,103    $     1,044,227                4%
  Employee Benefits                           9,873,640        11,854,677        10,949,367        10,841,916           (107,451)              -1%
  Purchased Services                            543,825           623,252           488,749           505,855             17,106                3%
  Purchased Property Services                 1,190,371         1,425,773         1,024,411         1,060,266             35,855                4%
  Other Purchased Services                      510,253           331,609           415,664           429,967             14,303                3%
  Supplies                                    3,192,493         3,703,627         3,331,551         3,645,088            313,537                9%
  Other                                          17,590            99,387            71,962            72,556                594                1%
                 Total Expenditures        $ 40,817,651      $ 41,931,093      $ 41,891,580      $ 43,209,751    $     1,318,171               3%
Park City School District
Student Activity Fund                                                                                                      Current as of: June 1, 2010
Revenues

                                                                                                                                  FY2010-FY2011
                                                     Actual             Original            Revised        Preliminary          Increase    Percent
                                                   2008-2009           2009-2010           2009-2010        2010-2011          (Decrease)   Change
Local Sources:
  1500 - Interest                              $           597     $         3,200                 197     $         158   $           (39)       -20%
  1700 - Student Activities                          2,140,680           1,600,000           1,800,934         1,800,934               -            0%
  1900 - Local                                          98,233             225,000              23,372            23,372                 0          0%
                    Total Local Sources        $     2,239,510     $     1,828,200     $     1,824,503     $   1,824,464   $           (39)         0%


Expenditures

                                                                                                                                  FY2010-FY2011
                                                     Actual             Original            Revised        Preliminary          Increase    Percent
                                                   2008-2009           2009-2010           2009-2010        2010-2011          (Decrease)   Change

Non-Instructional Services
  100 - Salaries                               $        22,305     $        35,000     $         4,998     $       4,998   $           -            0%
  200 - Employee Benefits                                4,241               8,435               1,200             1,200                 0          0%
  300 - Purchased Services                                   0             120,000             107,381           107,381                 0          0%
  400 - Purchased Property Services                     41,713              14,000               7,935             7,935                 0          0%
  500 - Other Purchased Services                         5,130             300,000             224,940           224,940                 0          0%
  600 - Supplies                                     2,185,970           1,400,000           1,633,456         1,633,456                 0          0%
  700 - Equipment                                            0               2,000              20,106             1,000           (19,106)       -95%
  800 - Other                                                0               1,000                 -                 -                   0     #DIV/0!
                     Total Expenditures        $     2,259,359     $     1,880,435     $     2,000,016     $   1,980,910   $       (19,106)        -1%


Excess (Deficiency) for Year                   $       (19,849)    $       (52,235)    $      (175,513)    $   (156,446)   $        19,067        -11%

  Transfers In                                        111,999                      0           91,000                 0            (91,000)     -----

Fund Balances - Beginning of Year                     415,202             507,352             507,352           422,839            (84,513)       -17%
Fund Balances - End of Year                    $      507,352      $      455,117      $      422,839      $    266,393    $      (156,446)       -37%

Summary of Fund Balances - End of Year:
  Reserved for:
    Encumbrances                                               0                   0                   0              0                    0        0%
  Designated for:
    Designated for Schools                            507,352             455,117             422,839           266,393           (156,446)       -37%
  Undesignated (Available for Appropriation)                 0                   0                   0                 0                  0          0
                    Total Fund Balances        $      507,352      $      455,117      $      422,839      $    266,393    $      (312,892)       -74%
Park City School District
Non K-12 Programs Fund                                                                                                       Current as of: June 1, 2010
Revenues

                                                                                                                                   FY2010-FY2011
                                                     Actual             Original            Revised        Preliminary           Increase   Percent
                                                   2008-2009           2009-2010           2009-2010        2010-2011           (Decrease) Change
Local Sources:
  1100 - Property Taxes                        $      829,737      $      874,877      $     1,001,452     $    999,331        $     (2,121)        0%
  1200 - Local Governments, Non-LEAs                    7,000                   0                    0                0                   0         0%
  1300 - Tuition                                      703,861             466,255              460,818          450,000             (10,818)       -2%
  1500 - Earnings on Investments                        8,337               1,098                3,773            3,035                (738)      -20%
  1900 - Other Local Revenue                           75,565             223,651              214,800          259,800              45,000        21%
                    Total Local Sources              1,624,500           1,565,881           1,680,843         1,712,166             31,323          2%

State Sources:
  3115 - Special Education - Pre-School                 97,024             101,900             101,900            76,549            (25,351)      -25%
  3260 - Adult High School                              49,231              48,807              62,707            46,648            (16,059)      -26%
  3656 - ELL Family Literacy                            59,436                 -                31,198            29,910             (1,288)       -4%
     Less Basic Levy                                   (97,024)           (101,900)           (101,900)          (76,549)            25,351       -25%
                    Total State Sources               108,667              48,807              93,905            76,558             (17,347)      (18%)

Federal Sources:
  4511 - Head Start                                    61,343              25,179              64,879            60,000              (4,879)         -8%
  4522 - IDEA Pre-School                               39,083                   0              19,797            19,706                   0           0%
  4900 - Other                                              0              86,038                   0            40,000                   0           0%
  7667 - ARRA--Pre-K                                        0                   0              21,383                 0             (21,383)     -----
                  Total Federal Sources               100,426             111,217             106,059           119,706             (26,262)      (25%)
                        Total Revenues         $     1,833,593     $     1,725,905     $     1,880,807     $   1,908,430       $    (12,286)       (1%)


Expenditures

                                                                                                                                   FY2010-FY2011
                                                     Actual             Original            Revised        Preliminary           Increase   Percent
                                                   2008-2009           2009-2010           2009-2010        2010-2011           (Decrease) Change

Non-Instructional Services
  100 - Salaries                               $     1,295,547     $     1,074,238     $     1,091,420     $   1,254,420       $    163,000        15%
  200 - Employee Benefits                              356,452             333,014             322,920           388,870             65,950        20%
  300 - Purchased Services                              51,864              43,759              35,165            35,165                  0          0%
  400 - Purchased Property Services                      4,477               5,264               7,790            74,819             67,029       860%
  500 - Other Purchased Services                       204,121             160,557             242,400           242,400                  0          0%
  600 - Supplies                                       134,420             130,598             106,821           110,560              3,739          4%
  700 - Equipment                                          715              30,000              25,061            30,000              4,939         -----
  800 - Indirect Costs                                  10,459               9,471               9,050             9,050                  0          0%
                    Total Expenditures         $     2,058,055     $     1,786,901     $     1,840,627     $   2,145,284       $    304,657        17%


Excess (Deficiency) for Year                   $      (224,462)    $      (60,996)     $       40,180      $    (236,854)
Fund Balances - Beginning of Year                      690,123            465,661             465,661            505,841
Fund Balances - End of Year                    $      465,661      $      404,665      $      505,841      $    268,987

Summary of Fund Balances - End of Year:
  Reserved for:
    Encumbrances                                               0                   0                   0                 0
  Designated for:
    Employee Benefits                                  26,086              25,000              25,000            25,000
    Other                                              14,764              15,000              15,000            15,000
  Undesignated (Available for Appropriation)          424,811             364,665             465,841           228,987
                    Total Fund Balances        $      465,661      $      404,665      $      505,841      $    268,987
Park City School District
Debt Service Fund                                                                                          Current as of: June 1, 2010
Revenues

                                                                                                                   FY2010-FY2011
                                          Actual           Original          Revised       Preliminary           Increase    Percent
                                        2008-2009         2009-2010         2009-2010      2010-2011            (Decrease)   Change
Local Sources:
  1100 - Property Tax               $     7,335,824   $     6,301,478   $     6,290,081    $   5,675,108    $      (614,973)    (10%)
  1500 - Earnings on Investments             10,621               975             5,094            2,721             (2,373)    (47%)
  1990 - Other Payments                      25,590            25,000            25,000           25,000                  0        0%
                 Total Revenues     $     7,372,035   $     6,327,453   $     6,320,175    $   5,702,829    $      (617,346)    (10%)


Expenditures

                                                                                                                   FY2010-FY2011
                                          Actual           Original          Revised       Preliminary           Increase    Percent
                                        2008-2009         2009-2010         2009-2010      2010-2011            (Decrease)   Change

Debt Service Payments
  810 - Paying Agent Fees           $         3,500   $         4,000   $         2,720    $       3,500    $           780       29%
  830 - Interest Payments                 1,153,134           746,690           849,802          746,690           (103,112)    (12%)
  840 - Principal Payments                5,930,000         5,535,000         5,642,702        5,050,000           (592,702)    (11%)
             Total Expenditures     $     7,086,634   $     6,285,690   $     6,495,224    $   5,800,190    $      (695,034)    (11%)


Excess (Deficiency) for Year        $      285,401    $       41,763    $      (175,049)   $    (97,361)
Transfers In from General Fund                   0                 0                  0               0
Fund Balances - Beginning of Year          343,121           628,522            628,522         453,473
Fund Balances - End of Year         $      628,522    $      670,285    $       453,473    $    356,112
Park City School District
Capital Projects Fund                                                                                                        Current as of: June 1, 2010
Revenues

                                                                                                                                    FY2010-FY2011
                                                     Actual             Original            Revised        Preliminary            Increase    Percent
                                                   2008-2009           2009-2010           2009-2010        2010-2011            (Decrease)   Change
Local Sources:
  1100 - Property Taxes
    Capital Outlay                             $     4,021,912     $     5,291,870     $     5,822,775     $    4,487,027    $    (1,335,748)     (23%)
    Ten Percent of Basic                             1,463,096           1,565,274                   0                  0                -           0%
  1500 - Earnings on Investments                       371,346              43,957             136,044             98,517            (37,527)     (28%)
  1900 - Other Local Revenue                           518,714             600,000             600,000            600,000                  0         0%
    Total Local Sources                              6,375,068           7,501,101           6,558,819          5,185,544         (1,373,275)     (21%)

State Sources:
  3710 - Driver Education                                  -               30,000              19,000             19,000                   0        0%
    Total State Sources                                    -               30,000              19,000             19,000                   0        0%

Federal Sources:
  4500 - Restricted Grants-in-Aid                              0                   0                   0                 0                 0        0%
    Total Federal Sources                                      0                   0                   0                 0                 0        0%
                       Total Revenues          $     6,375,068     $     7,531,101     $     6,577,819     $    5,204,544    $    (1,373,275)     (21%)


Expenditures

                                                                                                                                    FY2010-FY2011
                                                     Actual             Original            Revised        Preliminary            Increase    Percent
                                                   2008-2009           2009-2010           2009-2010        2010-2011            (Decrease)   Change
Capital Outlay:
  400 - Purchased Property Services                  4,865,810           7,712,390           1,932,422          6,346,056          4,413,634      228%
  451 - Improvements to Land and Site                  183,908             150,000             366,659            446,000             79,341        22%
  500 - Other Purchased Services                       120,003             125,566             125,566            125,566                  0         0%
  600 - Supplies                                       148,040             188,670             157,232            165,000              7,768         5%
  700 - Property                                        80,110             221,947              30,414             65,000             34,586      114%
  732 - School Buses                                       -               260,000             259,830            130,000           (129,830)     (50%)
  733 - Furniture                                      112,513             152,947              50,004             82,500             32,496        65%
  734 - Tech and Security Equipment                  1,178,639           2,125,000           3,164,317          1,840,000         (1,324,317)     (42%)
  735 - Non-Bus Vehicles                               249,581             200,000              35,000             35,000                  0         0%
  739 - Equipment                                      716,931             650,000             825,265            772,153            (53,112)      (6%)
                   Total Expenditures          $     7,655,535     $ 11,786,520        $     6,946,709     $ 10,007,275      $     3,060,566       44%


Excess (Deficiency) for Year                   $    (1,280,467)    $    (4,255,419)    $      (368,890)    $   (4,802,731)

Transfers Out                                               0                   0                   0                  0
Other Financing Sources:                              160,025                   0                   0                  0
  Sale of Capital Assets                                  545              13,000                 200                500

Net Change in Fund Balances                         (1,119,897)         (4,242,419)           (368,690)        (4,802,231)
Fund Balances - Beginning of Year                17,908,069          16,788,172          16,788,172          16,419,482
Fund Balances - End of Year                    $ 16,788,172        $ 12,545,753        $ 16,419,482        $ 11,617,251

Summary of Fund Balances - End of Year:
  Designated for:
    Capital Projects                                16,788,172          12,545,753          16,419,482         11,617,251
  Undesignated (Available for Appropriation)                 0                   0                   0                  0
                   Total Fund Balances         $ 16,788,172        $ 12,545,753        $ 16,419,482        $ 11,617,251
Park City School District
School Meals Program                                                                                                  Current as of: June 1, 2010
Revenues

                                                                                                                              FY2010-FY2011
                                                  Actual            Original           Revised       Preliminary            Increase    Percent
                                                2008-2009          2009-2010          2009-2010       2010-2011            (Decrease)   Change
Local Sources:
  1500 - Earnings on Investments            $       13,963     $        1,758     $        5,731     $      3,688      $        (2,043)    (36%)
  1610 - Sales to Pupils                           650,748            778,063            638,024          638,024                    0        0%
  1620 - Sales to Adults                            13,908             14,522             21,016           21,016                    0        0%
  1690 - Other Local Revenue (Vending)              81,973             95,506             78,944           78,944                    0        0%
                      Total Local Sources          760,592            889,849            743,715          741,672               (2,043)      0%

State Sources:
  3770 - Liquor Tax                                181,743            177,000            203,510          203,510                  -         0%
                      Total State Sources          181,743            177,000            203,510          203,510                  -         0%

Federal Sources:
  4571 - Lunch Reimbursement                       323,866            250,827            394,824          394,824                    0        0%
  4574 - Breakfast Reimbursement                    61,571             37,219             79,889           79,889                    0        0%
  4575 - After School                                2,275                  0              5,381            5,381                    0        0%
  4579 - Fresh Fruit and Other                      27,767                  0             20,044           20,044                    0        0%
  4970 - Donated Commodities                        86,546             72,000             77,253           77,253                    0        0%
  8080 - ARRA--Equipment                                 0                  0              6,418                0               (6,418)   (100%)
                  Total Federal Sources            502,025            360,046            583,809          577,391               (6,418)     (1%)
                         Total Revenues     $     1,444,360    $     1,426,895    $     1,531,034    $   1,522,573     $       (12,836)     (1%)


Expenditures

                                                                                                                              FY2010-FY2011
                                                  Actual            Original           Revised       Preliminary            Increase    Percent
                                                2008-2009          2009-2010          2009-2010       2010-2011            (Decrease)   Change
Food Services:
  100 - Salaries                            $      545,488     $      521,137     $      560,740     $    560,740      $           -           0%
  200 - Employee Benefits                          247,220            206,370            249,138          246,726               (2,412)      (1%)
  300 - Purchased Professional Services                  0                  0                  0                0                    0    -----
  400 - Purchased Property Services                 13,482             34,991             27,963           28,522                  559         2%
  500 - Other Purchased Services                    52,843             49,136             65,382           66,690                1,308         2%
  600 - Supplies                                    58,191             94,461             74,236           76,834                2,598         3%
  630 - Food                                       605,795            608,205            635,576          657,821               22,245         3%
  700 - Equipment                                   60,934            168,431             10,401          120,000              109,599    1054%
                      Total Expenditures    $     1,583,953    $     1,682,731    $     1,623,436    $   1,757,333     $       133,897       8%


Excess (Deficiency) for Year                $      (139,593)   $      (255,836)   $       (92,402)   $    (234,760)

Fund Balances - Beginning of Year                  846,705            707,112            707,112          614,710
Fund Balances - End of Year                 $      707,112     $      451,276     $      614,710     $    379,950

Contenu connexe

Tendances

San Angelo City Council November 6, 2012 Refunding Bond Sale
San Angelo City Council November 6, 2012 Refunding Bond SaleSan Angelo City Council November 6, 2012 Refunding Bond Sale
San Angelo City Council November 6, 2012 Refunding Bond Sale
City of San Angelo Texas
 
City Council March 5, 2013 Risk Management Actuary 2012
City Council March 5, 2013 Risk Management Actuary 2012City Council March 5, 2013 Risk Management Actuary 2012
City Council March 5, 2013 Risk Management Actuary 2012
City of San Angelo Texas
 
universal helath services ar_2002
universal helath services  ar_2002universal helath services  ar_2002
universal helath services ar_2002
finance49
 
2011 Q2 MD&A & Interim Financial Statements
2011 Q2 MD&A & Interim Financial Statements2011 Q2 MD&A & Interim Financial Statements
2011 Q2 MD&A & Interim Financial Statements
Prophecy Corp
 
Division of Business & Finance 2011-2012 Annual Report
Division of Business & Finance 2011-2012 Annual ReportDivision of Business & Finance 2011-2012 Annual Report
Division of Business & Finance 2011-2012 Annual Report
jmgcook
 
fredie mac financial-statement
fredie mac financial-statementfredie mac financial-statement
fredie mac financial-statement
finance6
 
Sambia vuosiraportti 2010
Sambia vuosiraportti 2010Sambia vuosiraportti 2010
Sambia vuosiraportti 2010
SYL
 
walt disney Quarter 2007 1st
walt disney   Quarter 2007 1stwalt disney   Quarter 2007 1st
walt disney Quarter 2007 1st
finance7
 
Apresentacao aes eletropaulo_4_t11_v8_en
Apresentacao aes eletropaulo_4_t11_v8_enApresentacao aes eletropaulo_4_t11_v8_en
Apresentacao aes eletropaulo_4_t11_v8_en
AES Eletropaulo
 

Tendances (20)

Closing the Budget Gap 4.7.2011
Closing the Budget Gap 4.7.2011Closing the Budget Gap 4.7.2011
Closing the Budget Gap 4.7.2011
 
Closing the gap 4.14.2011
Closing the gap 4.14.2011Closing the gap 4.14.2011
Closing the gap 4.14.2011
 
Gvsd Budget Pres Apr 19 2010 B
Gvsd Budget Pres Apr 19 2010 BGvsd Budget Pres Apr 19 2010 B
Gvsd Budget Pres Apr 19 2010 B
 
2013 cecil leadership
2013 cecil leadership2013 cecil leadership
2013 cecil leadership
 
2011 Cook County Pension Fund Actuary Report
2011 Cook County Pension Fund Actuary Report2011 Cook County Pension Fund Actuary Report
2011 Cook County Pension Fund Actuary Report
 
St. George's Annual Parish Meeting
St. George's Annual Parish MeetingSt. George's Annual Parish Meeting
St. George's Annual Parish Meeting
 
Strategies for controlling medical insurance costs
Strategies for controlling medical insurance costsStrategies for controlling medical insurance costs
Strategies for controlling medical insurance costs
 
San Angelo City Council November 6, 2012 Refunding Bond Sale
San Angelo City Council November 6, 2012 Refunding Bond SaleSan Angelo City Council November 6, 2012 Refunding Bond Sale
San Angelo City Council November 6, 2012 Refunding Bond Sale
 
Point Aquarius POA Annual Meeting
Point Aquarius POA Annual MeetingPoint Aquarius POA Annual Meeting
Point Aquarius POA Annual Meeting
 
City Council March 5, 2013 Risk Management Actuary 2012
City Council March 5, 2013 Risk Management Actuary 2012City Council March 5, 2013 Risk Management Actuary 2012
City Council March 5, 2013 Risk Management Actuary 2012
 
2012 City of Brandon Budget Highlights
2012 City of Brandon Budget Highlights2012 City of Brandon Budget Highlights
2012 City of Brandon Budget Highlights
 
universal helath services ar_2002
universal helath services  ar_2002universal helath services  ar_2002
universal helath services ar_2002
 
2011 Q2 MD&A & Interim Financial Statements
2011 Q2 MD&A & Interim Financial Statements2011 Q2 MD&A & Interim Financial Statements
2011 Q2 MD&A & Interim Financial Statements
 
Experinces Deploying Shared Services
Experinces Deploying Shared ServicesExperinces Deploying Shared Services
Experinces Deploying Shared Services
 
FY11 School Committee Approved Budget
FY11 School Committee Approved BudgetFY11 School Committee Approved Budget
FY11 School Committee Approved Budget
 
Division of Business & Finance 2011-2012 Annual Report
Division of Business & Finance 2011-2012 Annual ReportDivision of Business & Finance 2011-2012 Annual Report
Division of Business & Finance 2011-2012 Annual Report
 
fredie mac financial-statement
fredie mac financial-statementfredie mac financial-statement
fredie mac financial-statement
 
Sambia vuosiraportti 2010
Sambia vuosiraportti 2010Sambia vuosiraportti 2010
Sambia vuosiraportti 2010
 
walt disney Quarter 2007 1st
walt disney   Quarter 2007 1stwalt disney   Quarter 2007 1st
walt disney Quarter 2007 1st
 
Apresentacao aes eletropaulo_4_t11_v8_en
Apresentacao aes eletropaulo_4_t11_v8_enApresentacao aes eletropaulo_4_t11_v8_en
Apresentacao aes eletropaulo_4_t11_v8_en
 

En vedette (8)

Smartmusic
SmartmusicSmartmusic
Smartmusic
 
Senior future plans 2010
Senior future plans 2010Senior future plans 2010
Senior future plans 2010
 
2010 AYP SCHOOL REPORTS
2010 AYP SCHOOL REPORTS2010 AYP SCHOOL REPORTS
2010 AYP SCHOOL REPORTS
 
Leveraging Technology in a Music Classroom
Leveraging Technology in a Music ClassroomLeveraging Technology in a Music Classroom
Leveraging Technology in a Music Classroom
 
PCSD Strategic Plan Draft
PCSD Strategic Plan DraftPCSD Strategic Plan Draft
PCSD Strategic Plan Draft
 
011811 Legislation Summary
011811 Legislation Summary011811 Legislation Summary
011811 Legislation Summary
 
Counselor School Board presentation 2 15-11
Counselor School Board presentation 2 15-11Counselor School Board presentation 2 15-11
Counselor School Board presentation 2 15-11
 
PCHS Technology Update
PCHS Technology UpdatePCHS Technology Update
PCHS Technology Update
 

Similaire à Proposed budget fy2011

Northampton Budget FY2012 as of 31 March 2011
Northampton Budget FY2012 as of 31 March 2011Northampton Budget FY2012 as of 31 March 2011
Northampton Budget FY2012 as of 31 March 2011
Adam Cohen
 
Sgs Sfp 2012 15 C
Sgs Sfp 2012 15 CSgs Sfp 2012 15 C
Sgs Sfp 2012 15 C
marsfs
 
Liberty%20Tax%20Finanial%20Statements%20-%20FY%202006
Liberty%20Tax%20Finanial%20Statements%20-%20FY%202006Liberty%20Tax%20Finanial%20Statements%20-%20FY%202006
Liberty%20Tax%20Finanial%20Statements%20-%20FY%202006
finance41
 
Northampton Budget Issues 08 March 2011
Northampton Budget Issues 08 March 2011Northampton Budget Issues 08 March 2011
Northampton Budget Issues 08 March 2011
Adam Cohen
 

Similaire à Proposed budget fy2011 (20)

2012 2013 Budget Presentation March 27 2012
2012 2013 Budget Presentation March 27 20122012 2013 Budget Presentation March 27 2012
2012 2013 Budget Presentation March 27 2012
 
2011 2012 proposed budget 03-21-11
2011 2012 proposed budget 03-21-112011 2012 proposed budget 03-21-11
2011 2012 proposed budget 03-21-11
 
Northampton Budget FY2012 as of 31 March 2011
Northampton Budget FY2012 as of 31 March 2011Northampton Budget FY2012 as of 31 March 2011
Northampton Budget FY2012 as of 31 March 2011
 
Budget Reductions and Revenue Enhancements
Budget Reductions and Revenue EnhancementsBudget Reductions and Revenue Enhancements
Budget Reductions and Revenue Enhancements
 
GPPSS 2013 Fund Equity Alternate Reality
GPPSS 2013 Fund Equity Alternate RealityGPPSS 2013 Fund Equity Alternate Reality
GPPSS 2013 Fund Equity Alternate Reality
 
2010-2011 Adopted Budget Revision #1
2010-2011 Adopted Budget Revision #12010-2011 Adopted Budget Revision #1
2010-2011 Adopted Budget Revision #1
 
2010-2011 Adopted Budget
2010-2011 Adopted Budget2010-2011 Adopted Budget
2010-2011 Adopted Budget
 
Sgs Sfp 2012 15 C
Sgs Sfp 2012 15 CSgs Sfp 2012 15 C
Sgs Sfp 2012 15 C
 
CBC: New York State Budget and Jobs Summit
CBC: New York State Budget and Jobs SummitCBC: New York State Budget and Jobs Summit
CBC: New York State Budget and Jobs Summit
 
Overall of 2012
Overall of 2012Overall of 2012
Overall of 2012
 
Operational budgeting
Operational budgetingOperational budgeting
Operational budgeting
 
Data for campus inservices (1.18.11)
Data for campus inservices (1.18.11)Data for campus inservices (1.18.11)
Data for campus inservices (1.18.11)
 
Campus forum on budget (primary slides)
Campus forum on budget (primary slides)Campus forum on budget (primary slides)
Campus forum on budget (primary slides)
 
Second Interim
Second InterimSecond Interim
Second Interim
 
Liberty%20Tax%20Finanial%20Statements%20-%20FY%202006
Liberty%20Tax%20Finanial%20Statements%20-%20FY%202006Liberty%20Tax%20Finanial%20Statements%20-%20FY%202006
Liberty%20Tax%20Finanial%20Statements%20-%20FY%202006
 
2015 Research Valley Partnership Compliance Report
2015 Research Valley Partnership Compliance Report2015 Research Valley Partnership Compliance Report
2015 Research Valley Partnership Compliance Report
 
Honolulu Police Department FY2013 Presentation
Honolulu Police Department FY2013 PresentationHonolulu Police Department FY2013 Presentation
Honolulu Police Department FY2013 Presentation
 
Budget Workshop Dr. V 9.21.15
Budget Workshop Dr. V 9.21.15Budget Workshop Dr. V 9.21.15
Budget Workshop Dr. V 9.21.15
 
Accountability 101
Accountability 101Accountability 101
Accountability 101
 
Northampton Budget Issues 08 March 2011
Northampton Budget Issues 08 March 2011Northampton Budget Issues 08 March 2011
Northampton Budget Issues 08 March 2011
 

Plus de Park City Education Foundation

Plus de Park City Education Foundation (16)

PCSD Strategic Plan
PCSD Strategic PlanPCSD Strategic Plan
PCSD Strategic Plan
 
Early Childhood Education at PCSD
Early Childhood Education at PCSDEarly Childhood Education at PCSD
Early Childhood Education at PCSD
 
Music Board Presentation
Music Board PresentationMusic Board Presentation
Music Board Presentation
 
Nutrition report 042710
Nutrition report 042710Nutrition report 042710
Nutrition report 042710
 
Programs & Classes 2010
Programs & Classes 2010Programs & Classes 2010
Programs & Classes 2010
 
Fy2011 budget update
Fy2011 budget updateFy2011 budget update
Fy2011 budget update
 
5 Year PCSD Calendar 2010
5 Year PCSD Calendar 20105 Year PCSD Calendar 2010
5 Year PCSD Calendar 2010
 
2010 summer school planning
2010 summer school planning2010 summer school planning
2010 summer school planning
 
2010 Summer School Planning
2010 Summer School Planning2010 Summer School Planning
2010 Summer School Planning
 
Cluster+model+2
Cluster+model+2Cluster+model+2
Cluster+model+2
 
HB129 Dead In Committee
HB129 Dead In CommitteeHB129 Dead In Committee
HB129 Dead In Committee
 
PCSD High Access Feb 2010
PCSD High Access Feb 2010PCSD High Access Feb 2010
PCSD High Access Feb 2010
 
Utah HB129: What You Can Do
Utah HB129: What You Can DoUtah HB129: What You Can Do
Utah HB129: What You Can Do
 
2010 HB128 Bill Overview
2010 HB128 Bill Overview2010 HB128 Bill Overview
2010 HB128 Bill Overview
 
2009 PCSD Student Achievement Gap Report
2009 PCSD Student Achievement Gap Report2009 PCSD Student Achievement Gap Report
2009 PCSD Student Achievement Gap Report
 
Equalization Explained
Equalization ExplainedEqualization Explained
Equalization Explained
 

Dernier

Challenges and Opportunities: A Qualitative Study on Tax Compliance in Pakistan
Challenges and Opportunities: A Qualitative Study on Tax Compliance in PakistanChallenges and Opportunities: A Qualitative Study on Tax Compliance in Pakistan
Challenges and Opportunities: A Qualitative Study on Tax Compliance in Pakistan
vineshkumarsajnani12
 
The Abortion pills for sale in Qatar@Doha [+27737758557] []Deira Dubai Kuwait
The Abortion pills for sale in Qatar@Doha [+27737758557] []Deira Dubai KuwaitThe Abortion pills for sale in Qatar@Doha [+27737758557] []Deira Dubai Kuwait
The Abortion pills for sale in Qatar@Doha [+27737758557] []Deira Dubai Kuwait
daisycvs
 

Dernier (20)

Berhampur 70918*19311 CALL GIRLS IN ESCORT SERVICE WE ARE PROVIDING
Berhampur 70918*19311 CALL GIRLS IN ESCORT SERVICE WE ARE PROVIDINGBerhampur 70918*19311 CALL GIRLS IN ESCORT SERVICE WE ARE PROVIDING
Berhampur 70918*19311 CALL GIRLS IN ESCORT SERVICE WE ARE PROVIDING
 
Call 7737669865 Vadodara Call Girls Service at your Door Step Available All Time
Call 7737669865 Vadodara Call Girls Service at your Door Step Available All TimeCall 7737669865 Vadodara Call Girls Service at your Door Step Available All Time
Call 7737669865 Vadodara Call Girls Service at your Door Step Available All Time
 
HomeRoots Pitch Deck | Investor Insights | April 2024
HomeRoots Pitch Deck | Investor Insights | April 2024HomeRoots Pitch Deck | Investor Insights | April 2024
HomeRoots Pitch Deck | Investor Insights | April 2024
 
Putting the SPARK into Virtual Training.pptx
Putting the SPARK into Virtual Training.pptxPutting the SPARK into Virtual Training.pptx
Putting the SPARK into Virtual Training.pptx
 
Challenges and Opportunities: A Qualitative Study on Tax Compliance in Pakistan
Challenges and Opportunities: A Qualitative Study on Tax Compliance in PakistanChallenges and Opportunities: A Qualitative Study on Tax Compliance in Pakistan
Challenges and Opportunities: A Qualitative Study on Tax Compliance in Pakistan
 
Falcon Invoice Discounting: Unlock Your Business Potential
Falcon Invoice Discounting: Unlock Your Business PotentialFalcon Invoice Discounting: Unlock Your Business Potential
Falcon Invoice Discounting: Unlock Your Business Potential
 
Katrina Personal Brand Project and portfolio 1
Katrina Personal Brand Project and portfolio 1Katrina Personal Brand Project and portfolio 1
Katrina Personal Brand Project and portfolio 1
 
Horngren’s Cost Accounting A Managerial Emphasis, Canadian 9th edition soluti...
Horngren’s Cost Accounting A Managerial Emphasis, Canadian 9th edition soluti...Horngren’s Cost Accounting A Managerial Emphasis, Canadian 9th edition soluti...
Horngren’s Cost Accounting A Managerial Emphasis, Canadian 9th edition soluti...
 
Unveiling Falcon Invoice Discounting: Leading the Way as India's Premier Bill...
Unveiling Falcon Invoice Discounting: Leading the Way as India's Premier Bill...Unveiling Falcon Invoice Discounting: Leading the Way as India's Premier Bill...
Unveiling Falcon Invoice Discounting: Leading the Way as India's Premier Bill...
 
Cannabis Legalization World Map: 2024 Updated
Cannabis Legalization World Map: 2024 UpdatedCannabis Legalization World Map: 2024 Updated
Cannabis Legalization World Map: 2024 Updated
 
Marel Q1 2024 Investor Presentation from May 8, 2024
Marel Q1 2024 Investor Presentation from May 8, 2024Marel Q1 2024 Investor Presentation from May 8, 2024
Marel Q1 2024 Investor Presentation from May 8, 2024
 
The Abortion pills for sale in Qatar@Doha [+27737758557] []Deira Dubai Kuwait
The Abortion pills for sale in Qatar@Doha [+27737758557] []Deira Dubai KuwaitThe Abortion pills for sale in Qatar@Doha [+27737758557] []Deira Dubai Kuwait
The Abortion pills for sale in Qatar@Doha [+27737758557] []Deira Dubai Kuwait
 
PARK STREET 💋 Call Girl 9827461493 Call Girls in Escort service book now
PARK STREET 💋 Call Girl 9827461493 Call Girls in  Escort service book nowPARK STREET 💋 Call Girl 9827461493 Call Girls in  Escort service book now
PARK STREET 💋 Call Girl 9827461493 Call Girls in Escort service book now
 
QSM Chap 10 Service Culture in Tourism and Hospitality Industry.pptx
QSM Chap 10 Service Culture in Tourism and Hospitality Industry.pptxQSM Chap 10 Service Culture in Tourism and Hospitality Industry.pptx
QSM Chap 10 Service Culture in Tourism and Hospitality Industry.pptx
 
Getting Real with AI - Columbus DAW - May 2024 - Nick Woo from AlignAI
Getting Real with AI - Columbus DAW - May 2024 - Nick Woo from AlignAIGetting Real with AI - Columbus DAW - May 2024 - Nick Woo from AlignAI
Getting Real with AI - Columbus DAW - May 2024 - Nick Woo from AlignAI
 
Chennai Call Gril 80022//12248 Only For Sex And High Profile Best Gril Sex Av...
Chennai Call Gril 80022//12248 Only For Sex And High Profile Best Gril Sex Av...Chennai Call Gril 80022//12248 Only For Sex And High Profile Best Gril Sex Av...
Chennai Call Gril 80022//12248 Only For Sex And High Profile Best Gril Sex Av...
 
Organizational Transformation Lead with Culture
Organizational Transformation Lead with CultureOrganizational Transformation Lead with Culture
Organizational Transformation Lead with Culture
 
Buy gmail accounts.pdf buy Old Gmail Accounts
Buy gmail accounts.pdf buy Old Gmail AccountsBuy gmail accounts.pdf buy Old Gmail Accounts
Buy gmail accounts.pdf buy Old Gmail Accounts
 
UAE Bur Dubai Call Girls ☏ 0564401582 Call Girl in Bur Dubai
UAE Bur Dubai Call Girls ☏ 0564401582 Call Girl in Bur DubaiUAE Bur Dubai Call Girls ☏ 0564401582 Call Girl in Bur Dubai
UAE Bur Dubai Call Girls ☏ 0564401582 Call Girl in Bur Dubai
 
JAJPUR CALL GIRL ❤ 82729*64427❤ CALL GIRLS IN JAJPUR ESCORTS
JAJPUR CALL GIRL ❤ 82729*64427❤ CALL GIRLS IN JAJPUR  ESCORTSJAJPUR CALL GIRL ❤ 82729*64427❤ CALL GIRLS IN JAJPUR  ESCORTS
JAJPUR CALL GIRL ❤ 82729*64427❤ CALL GIRLS IN JAJPUR ESCORTS
 

Proposed budget fy2011

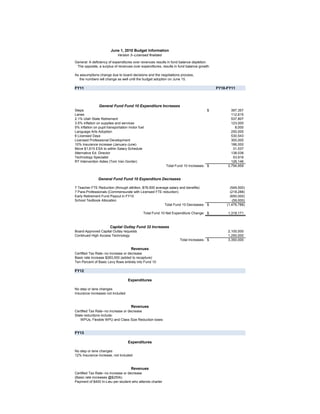
  • 1. June 1, 2010 Budget Information Version 3--Licensed finalized General: A deficiency of expenditures over revenues results in fund balance depletion. The opposite, a surplus of revenues over expenditures, results in fund balance growth. As assumptions change due to board decisions and the negotiations process, the numbers will change as well until the budget adoption on June 15. . FY11 FY10-FY11 General Fund Fund 10 Expenditure Increases Steps $ 397,357 Lanes 112,615 2.1% Utah State Retirement 537,807 3.5% inflation on supplies and services 123,000 5% inflation on pupil transportation motor fuel 8,000 Language Arts Adoption 250,000 6 Licensed Days 530,543 Licensed Professional Development 300,000 10% Insurance increase (January-June) 186,000 Move $1,615 ESA to within Salary Schedule 31,537 Alternative Ed. Director 138,038 Technology Specialist 53,916 RT Intervention Aides (Tom Van Gorder) 126,146 Total Fund 10 Increases: $ 2,794,959 General Fund Fund 10 Expenditure Decreases 7 Teacher FTE Reduction (through attrition, $78,500 average salary and benefits) (549,500) 7 Para-Professionals (Commensurate with Licensed FTE reduction) (218,288) Early Retirement Fund Payout in FY10 (650,000) School Textbook Allocation (59,000) Total Fund 10 Decreases: $ (1,476,788) Total Fund 10 Net Expenditure Change: $ 1,318,171 Capital Outlay Fund 32 Increases Board-Approved Capital Outlay requests 2,100,000 Continued High Access Technology 1,250,000 Total Increases: $ 3,350,000 Revenues Certified Tax Rate--no increase or decrease Basic rate increase $283,000 (added to recapture) Ten Percent of Basic Levy flows entirely into Fund 10 FY12 Expenditures No step or lane changes Insurance increases not included Revenues Certified Tax Rate--no increase or decrease State reductions include: WPUs, Flexible WPU and Class Size Reduction loses FY13 Expenditures No step or lane changes 12% Insurance increase, not included Revenues Certified Tax Rate--no increase or decrease (Basic rate increases @$250k) Payment of $400 In-Lieu per student who attends charter
  • 2. Park City School District FOR INFORMATIONAL PURPOSES ONLY The General Fund Current as of: June 1, 2010 Summary Statement of Revenues, Expenditures, and Changes in Fund Balances -350 Students FY2012-FY2013 Actual Actual Revised Preliminary Preliminary Preliminary Increase Percent 2007-2008 2008-2009 2009-2010 2010-2011 2011-2012 2012-2013 (Decrease) Change Revenues: Local Sources $ 30,588,383 $ 35,247,869 $ 36,543,316 $ 37,727,955 $ 36,589,955 $ 36,589,955 $ - 0% State Sources 7,660,897 4,399,052 2,046,965 2,181,172 1,134,722 994,722 (140,000) -12% Federal Sources 1,109,005 2,738,862 2,447,480 1,486,963 1,027,802 1,027,802 - 0% Total Revenues 39,358,285 $ 42,385,783 $ 41,037,761 $ 41,396,090 $ 38,752,479 $ 38,612,479 $ (140,000) 0% Expenditures: Instruction 23,313,971 $ 25,923,311 $ 27,593,914 $ 28,092,779 $ 28,092,779 $ 28,092,779 $ - 0% Support Services: Student Services 1,436,839 1,571,783 1,604,038 1,674,062 $ 1,674,062 1,674,062 - 0% Staff Services 734,755 1,609,746 1,424,634 1,819,823 1,819,823 1,819,823 - 0% District Administration 1,764,313 1,789,618 1,656,176 1,827,944 1,827,944 1,827,944 - 0% School Administration 2,081,044 2,139,330 2,027,605 2,034,464 2,034,464 2,034,464 - 0% Business Administration 622,563 502,846 531,454 532,076 532,076 532,076 - 0% Operation & Maintenance of Facilities 4,827,197 5,403,406 5,330,369 5,479,911 5,479,911 5,479,911 - 0% To and From Transportation 1,548,788 1,877,611 1,723,390 1,748,692 1,748,692 1,748,692 - 0% Total Expenditures 36,329,470 $ 40,817,651 $ 41,891,580 $ 43,209,751 $ 43,209,751 $ 43,209,751 $ - 0% Excess (Deficiency) of Revenues Over Expenditures 3,028,815 $ 1,568,132 $ (853,819) $ (1,813,661) $ (4,457,272) $ (4,597,272) $ (140,000) 3% Other Financing Sources (Uses): Transfers In (Out) (92,457) $ (96,357) $ - $ - $ - $ - $ - 0% Total Other Financing Sources (Uses) (92,457) $ (96,357) $ - $ - $ - $ - $ - ----- Excess (Deficiency) of Revenues and Other Financing Sources Over Expenditures* 2,936,358 $ 1,471,775 $ (853,819) $ (1,813,661) $ (4,457,272) $ (4,597,272) Fund Balances - Beginning of Year 7,763,643 10,693,855 12,165,630 11,311,811 9,498,150 5,040,878 Fund Balances - End of Year $ 10,693,855 $ 12,165,630 $ 11,311,811 $ 9,498,150 $ 5,040,878 $ 443,606 Summary of Fund Balances - End of Year: Reserved for: Encumbrances and Inventories $ 292,214 $ 292,214 $ 300,000 $ 300,000 $ 300,000 $ 300,000 Designated for: Early Retirement Incentive 1,299,147 1,299,147 621,928 385,424 176,670 26,042 Self-Funding Reserve 0 0 220,000 440,000 880,000 1,320,000 Undistributed Reserve (5% of Bdgt Expend) 1,816,474 2,040,883 2,094,579 2,160,488 2,160,488 2,160,488 Undesignated (Available for Appropriation) 7,292,166 8,533,386 8,075,304 6,212,238 1,523,720 (3,362,924) Total Fund Balances $ 10,700,001 $ 12,165,630 $ 11,311,811 $ 9,498,150 $ 5,040,878 $ 443,606
  • 3. Park City School District The General Fund Current as of: June 1, 2010 Summary Statement of Revenues, Expenditures, and Changes in Fund Balances FY2010-FY2011 Actual Original Revised Preliminary Increase Percent 2008-2009 2009-2010 2009-2010 2010-2011 (Decrease) Change Revenues: Local Sources $ 35,247,869 $ 34,436,733 $ 36,543,316 $ 37,727,955 $ 1,184,639 3% State Sources 4,399,052 3,946,743 2,046,965 2,181,172 134,207 7% Federal Sources 2,738,862 2,875,973 2,447,480 1,486,963 (960,517) -39% Total Revenues $ 42,385,783 $ 41,259,449 $ 41,037,761 $ 41,396,090 $ 358,329 1% Expenditures: Instruction $ 25,923,311 $ 25,674,262 $ 27,593,914 $ 28,092,779 $ 498,865 2% Support Services: Student Services 1,571,783 1,663,306 1,604,038 1,674,062 70,024 4% Staff Services* 1,609,746 1,778,539 1,424,634 1,819,823 395,189 28% District Administration 1,789,618 1,753,038 1,656,176 1,827,944 171,768 10% School Administration 2,139,330 2,285,029 2,027,605 2,034,464 6,859 0% Business Administration 502,846 549,483 531,454 532,076 622 0% Operation & Maintenance of Facilities 5,403,406 5,886,709 5,330,369 5,479,911 149,542 3% To and From Transportation 1,877,611 2,340,727 1,723,390 1,748,692 25,302 1% Total Expenditures $ 40,817,651 $ 41,931,093 $ 41,891,580 $ 43,209,751 $ 1,318,171 3% Excess (Deficiency) of Revenues Over Expenditures $ 1,568,132 $ (671,644) $ (853,819) $ (1,813,661) $ (959,842) 112% Other Financing Sources (Uses): Transfers In (Out) $ (96,357) $ - $ - $ - $ - 0% Total Other Financing Sources (Uses) $ (96,357) $ - $ - $ - $ - ----- Excess (Deficiency) of Revenues and Other Financing Sources Over Expenditures* $ 1,471,775 $ (671,644) $ (853,819) $ (1,813,661) Fund Balances - Beginning of Year 10,693,855 12,165,630 12,165,630 11,311,811 Fund Balances - End of Year $ 12,165,630 $ 11,493,986 $ 11,311,811 $ 9,498,150 Summary of Fund Balances - End of Year: Reserved for: Encumbrances and Inventories $ 292,214 $ 300,000 $ 300,000 $ 300,000 Designated for: Employee Benefits Early Retirement Incentive 1,299,147 621,925 621,928 385,424 Self-Funding Reserve 0 0 220,000 440,000 Undistributed Reserve (5% of Bdgt Expend) 2,040,883 2,096,555 2,094,579 2,160,488 Undesignated (Available for Appropriation) 8,533,386 8,475,506 8,075,304 6,212,238 Total Fund Balances $ 12,165,630 $ 11,493,986 $ 11,311,811 $ 9,498,150
  • 4. Park City School District The General Fund Current as of: June 1, 2010 Revenues FY2010-FY2011 Actual Original Revised Preliminary Increase Percent 2008-2009 2009-2010 2009-2010 2010-2011 (Decrease) Change Local Sources: 1100 - Property Taxes Basic $ 15,114,625 $ 17,168,929 $ 17,419,700 $ 17,452,110 $ 32,410 0% Voted Leeway 17,266,948 15,599,404 15,827,250 16,448,585 621,335 4% K-3 Reading 677,135 670,942 680,742 645,947 (34,795) -5% Special Transportation 519,943 263,584 267,434 945,851 678,417 254% Tort Liability 60,459 35,943 36,468 34,604 (1,864) -5% Judgment 0 59,113 60,781 57,674 (3,107) -5% Ten Percent of Basic 0 0 1,507,357 1,430,313 (77,044) -5% 1500 - Earnings on Investments 326,625 33,718 98,584 67,871 (30,713) -31% 1900 - Local Revenue 49,155 5,100 45,000 45,000 0 0% 1960 - Local Governments 785,733 600,000 600,000 600,000 0 0% Total Local Sources $ 34,800,623 $ 34,436,733 $ 36,543,316 $ 37,727,955 $ 1,184,639 3% State Sources: Minimum School Program 3010 - Foreign Exchange $ 2,577 $ 2,577 $ - $ - 0 0% 3010 - Charter School Local Replacement (785) (785) (1,925) (1,925) 0 0% 3010 - Regular School Programs - K-12 10,988,039 10,988,824 11,097,881 11,097,881 0 0% 3020 - Professional Staff 1,130,625 1,130,625 1,109,788 1,109,788 0 0% 3025 - Administrative Costs 123,696 154,620 154,620 154,620 0 0% 3100 - Special Education 1,216,311 1,171,546 1,221,365 1,218,787 (2,578) 0% 3155 - Career and Technology Education 390,118 369,591 525,869 497,219 (28,650) -5% 3230 - Class Size Reduction 688,689 686,563 705,336 719,052 13,716 2% Less Basic Levy (15,017,601) (17,067,029) (17,317,800) (17,375,561) (57,761) 0% Total Basic School Program $ (478,331) $ (2,563,468) $ (2,504,866) $ (2,580,139) $ (75,273) 3% Other Minimum School Program 3211 - Gifted and Talented $ 27,346 $ 19,598 $ 15,714 $ 15,054 $ (660) -4% 3212 - Advanced Placement 84,703 61,967 68,725 67,311 (1,414) -2% 3213 - Concurrent Enrollment 39,771 43,742 0 0 0 0% 3215 - At-Risk Regular Program 41,109 39,819 36,985 36,105 (880) -2% 3218 - At-Risk Homeless & Minority 7,575 9,500 9,336 0 (9,336) -100% 3255 - Quality Teaching Block Grant 533,712 0 0 0 0 0% 3260 - Local Discretionary Block Grant 120,820 0 0 0 0 0% 3270 - Interventions for Student Success BG 183,791 143,976 138,386 136,508 (1,878) -1% 3405 - SS&R / 2011 Flexible WPU 1,231,378 1,441,265 1,332,479 1,690,235 357,756 27% 3415 - Pupil Transportation 882,605 771,110 769,076 848,066 78,990 10% 3468 - Nurses 11,785 7,575 10,343 9,404 (939) -9% 3520 - School LAND Trust 180,085 188,429 235,862 235,862 0 0% 3640 - Extended Day K 54,235 54,235 56,110 56,110 0 0% 3805 - Reading Achievement 30,886 30,886 28,571 28,000 (571) -2% 3810 - Library Books and Electronic Res. 12,330 12,446 4,077 3,450 (627) -15% 3851 - Classroom Supplies and Materials 111,999 91,926 105,448 51,254 (54,194) -51% 3876 - Educator Salary Adjustment 1,556,773 1,422,026 1,562,343 1,562,343 0 0% 3877 - One-Time Signing Bonus 48,422 0 0 0 0 0% 3900 - Other State Revenue 335,757 2,171,711 178,376 21,609 (156,767) -88% State Revenue adjustment (677,135) (670,942) 0 0 0 0% Total Other Minimum School Program 4,817,947 6,510,211 4,551,831 4,761,311 209,480 5% Total State Support $ 4,339,616 $ 3,946,743 $ 2,046,965 $ 2,181,172 $ 134,207 7%
  • 5. FY2010-FY2011 Actual Original Revised Preliminary Increase Percent 2008-2009 2009-2010 2009-2010 2010-2011 (Decrease) Change Federal Sources: 4520 - IDEA Special Education $ 773,809 $ 767,147 $ 801,389 $ 742,802 $ (58,587) -7% 4530 - Applied Technology 35,530 0 35,528 35,000 (528) -1% 4810 - Forest Reserve 53,664 50,000 50,000 50,000 0 0% 4800 - NCLB 213,398 250,000 200,000 200,000 0 0% 7661 - ARRA--Stabilization 1,662,461 1,347,645 895,837 0 (895,837) -100% 7662 - ARRA--Title I 0 57,768 57,768 57,768 0 0% 7664 - ARRA--Special Ed 0 401,393 401,393 401,393 0 0% 7670 - ARRA--Other 0 2,020 5,565 0 (5,565) -100% Total Federal Sources 2,738,862 2,875,973 2,447,480 1,486,963 (960,517) -39% Total Revenues $ 41,879,101 $ 41,259,449 $ 41,037,761 $ 41,396,090 $ 358,329 1%
  • 6. Park City School District The General Fund Current as of: June 1, 2010 Expenditures FY2010-FY2011 Actual Original Revised Preliminary Increase Percent 2008-2009 2009-2010 2009-2010 2010-2011 (Decrease) Change Instruction (1000): Salaries: 131 - Teachers - Certificated $ 15,368,405 $ 14,002,256 $ 15,719,025 $ 16,194,220 $ 475,195 3% 132 - Substitute Teachers 231,082 243,346 250,492 258,007 7,515 3% 136 - Teachers - Hourly 110,760 18,589 23,460 24,164 704 3% 161 - Paraprofessionals 2,148,088 1,801,307 2,286,719 2,331,700 44,981 2% Total Salaries $ 17,858,335 $ 16,065,498 $ 18,279,696 $ 18,808,091 $ 528,395 3% Employee Benefits: 210 - State Retirement 2,670,058 2,453,202 2,816,053 2,936,093 120,040 4% 220 - Social Security 1,370,885 1,229,011 1,430,080 1,438,819 8,739 1% 240 - Group Insurance 2,403,350 3,747,319 3,074,932 3,132,182 57,250 2% 290 - District Retiree/Other Benefits 446,306 884,170 662,400 209,265 (453,135) -68% Total Employee Benefits $ 6,890,599 $ 8,313,702 $ 7,983,465 $ 7,716,359 $ (267,106) -3% Purchased Services: 300 - Purchased Services 103,660 105,067 73,430 76,000 2,570 3% 500 - Other Purchased Services 105,325 142,939 133,213 137,875 4,662 3% Total Purchased Services $ 208,985 $ 248,006 $ 206,643 $ 213,875 $ 7,232 3% Supplies and Materials: 610 - 640 - Supplies 637,218 786,365 814,902 843,424 28,522 4% 641 - Textbooks 280,639 189,087 236,594 435,875 199,281 84% 670 - Software 47,535 71,604 72,614 75,155 2,541 3% Total Supplies and Materials 965,392 1,047,056 1,124,110 1,354,454 230,344 20% Total Instruction $ 25,923,311 $ 25,674,262 $ 27,593,914 $ 28,092,779 $ 498,865 2% Student Services (2100): Salaries: 142 - Guidance Personnel 835,809 840,956 806,992 848,956 41,964 5% 143 - Health Services Personnel 92,724 93,843 90,664 95,379 4,715 5% 152 - Secretarial, Clerical and Other 103,155 101,041 104,052 104,052 0 0% Total Salaries $ 1,031,688 $ 1,035,840 $ 1,001,708 $ 1,048,387 $ 46,679 5% 200 - Employee Benefits 431,249 517,947 413,116 429,839 16,723 4% 300 - Purchased Services 67,383 63,391 107,454 111,215 3,761 4% 500 - Other Purchased Services 10,996 10,343 19,667 20,355 688 3% 600 - Supplies and Materials 30,467 35,785 62,093 64,266 2,173 3% Total Student Services $ 1,571,783 $ 1,663,306 $ 1,604,038 $ 1,674,062 $ 70,024 4%
  • 7. Park City School District The General Fund Current as of: June 1, 2010 Expenditures FY2010-FY2011 Actual Original Revised Preliminary Increase Percent 2008-2009 2009-2010 2009-2010 2010-2011 (Decrease) Change Staff Services (2200): Salaries: 131 - Teacher Prof. Dev. 519,703 439,239 268,089 568,089 300,000 112% 132 - Substitutes Prof. Dev. 0 177,172 141,133 141,133 0 0% 145 - Media Personnel 424,119 440,214 407,848 430,687 22,839 6% 161 and 162 - Paraprofessionals 23,055 45,766 73,984 73,984 0 0% Total Salaries $ 966,877 $ 1,102,391 $ 891,054 $ 1,213,893 $ 322,839 36% 200 - Employee Benefits 248,835 306,575 235,160 297,065 61,905 26% 300 - Purchased Services 129,619 163,862 41,025 42,461 1,436 4% 500 - Travel, Communication 102,884 43,142 102,710 106,305 3,595 4% 610 - 630 Supplies 50,889 38,074 71,765 74,277 2,512 4% 644 - Library Books 52,524 77,971 45,863 47,468 1,605 3% 645 - Periodicals 19,072 18,012 19,600 20,286 686 4% 660 - Audio Visual Materials 26,526 25,057 17,457 18,068 611 4% 670 - Software 12,520 3,455 - - - ----- Total Instructional Staff Services $ 1,609,746 $ 1,778,539 $ 1,424,634 $ 1,819,823 $ 395,189 28% District Administration (2300): Salaries: 110 - Board and Administration 170,520 171,020 168,020 168,020 0 0% 115 - Supervisors and Directors 378,459 379,077 379,683 491,183 111,500 29% 152 - Secretarial 281,918 279,650 275,458 275,458 0 0% 100 - All Other 99,254 69,869 11,596 11,596 0 0% Total Salaries $ 930,151 $ 899,616 $ 834,757 $ 946,257 $ 111,500 13% 200 - Employee Benefits 377,932 411,931 360,819 406,891 46,072 13% 300 - Purchased Services 234,176 261,340 239,569 247,954 8,385 4% 500 - Other Purchased Services 177,317 51,088 86,553 89,582 3,029 3% 600 - Supplies and Materials 68,695 43,483 79,478 82,260 2,782 4% 800 - Other 1,347 85,580 55,000 55,000 0 0% Total District Administration $ 1,789,618 $ 1,753,038 $ 1,656,176 $ 1,827,944 $ 171,768 10% School Administration (2400): Salaries: 121 - Principals and Assistants 953,878 989,669 1,016,042 1,016,042 0 0% 152 - Secretarial and Clerical 444,190 457,890 389,705 389,705 0 0% 100 - Other Salaries 71,483 30,914 9,467 9,467 0 0% Total Salaries $ 1,469,551 $ 1,478,473 $ 1,415,214 $ 1,415,214 $ - 0% 200 - Employee Benefits 602,378 746,772 574,698 580,238 5,540 1% 500 - Other Purchased Services 49,309 37,318 25,138 26,018 880 4% 600 - Supplies & Materials 18,092 22,466 12,555 12,994 439 3% Total School Administration $ 2,139,330 $ 2,285,029 $ 2,027,605 $ 2,034,464 $ 6,859 0% Business Services (2500): 100 - Salaries 356,512 350,391 364,432 364,432 0 0% 200 - Employee Benefits 122,665 172,016 124,528 123,907 (621) 0% 500 - Other Purchased Services 5,397 3,939 6,990 6,990 0 0% 600 - Supplies and Materials 2,029 9,330 18,542 19,191 649 4% 800 - Other 16,243 13,807 16,962 17,556 594 4% Total Business Services $ 502,846 $ 549,483 $ 531,454 $ 532,076 $ 622 0%
  • 8. Park City School District The General Fund Current as of: June 1, 2010 Expenditures FY2010-FY2011 Actual Original Revised Preliminary Increase Percent 2008-2009 2009-2010 2009-2010 2010-2011 (Decrease) Change Operation & Maint. of Facilities (2600): Salaries: 180 - Custodial/Maint./Tech Personnel 1,827,953 1,862,687 1,888,572 1,923,386 34,814 2% 100 - Other Salaries 23,700 29,962 26,624 26,624 0 0% Total Salaries $ 1,851,653 $ 1,892,649 $ 1,915,196 $ 1,950,010 $ 34,814 2% 200 - Employee Benefits 761,746 848,671 871,554 897,255 25,701 3% 300 - Purchased Services 8,987 29,592 24,516 25,374 858 3% 400 - Purchased Property Services 1,156,325 1,392,440 1,005,823 1,041,027 35,204 4% 500 - Other Purchased Services 33,391 22,402 28,715 29,720 1,005 3% 600 - Supplies and Materials 1,591,304 1,700,955 1,484,565 1,536,525 51,960 4% Total Operation & Maintenance $ 5,403,406 $ 5,886,709 $ 5,330,369 $ 5,479,911 $ 149,542 3% Student Transportation (2700): Salaries: 152 - Secretarial and Clerical 58,404 58,639 56,855 56,855 0 0% 171 - Transportation Supervisors 108,276 121,334 98,542 98,542 0 0% 172 - Bus Drivers 682,417 681,456 586,935 586,935 0 0% 173 - Mechanics 175,615 206,481 165,487 165,487 0 0% Total Salaries $ 1,024,712 $ 1,067,910 $ 907,819 $ 907,819 $ - 0% 200 - Employee Benefits 438,236 537,063 386,027 390,362 4,335 1% 300 - Purchased Services 0 0 2,755 2,851 96 3% 400 - Purchased Property Services 34,046 33,333 18,588 19,239 651 4% 500 - Other Purchased Services 25,634 20,438 12,678 13,122 444 4% 626 - Motor Fuel 118,764 261,598 153,729 161,415 7,686 5% 600 - Other Supplies 236,219 420,385 241,794 253,884 12,090 5% Total Student Transportation $ 1,877,611 $ 2,340,727 $ 1,723,390 $ 1,748,692 $ 25,302 1% Total Expenditures $ 40,817,651 $ 41,931,093 $ 41,891,580 $ 43,209,751 $ 1,318,171 3% Total Expenditures Salaries $ 25,489,479 $ 23,892,768 $ 25,609,876 $ 26,654,103 $ 1,044,227 4% Employee Benefits 9,873,640 11,854,677 10,949,367 10,841,916 (107,451) -1% Purchased Services 543,825 623,252 488,749 505,855 17,106 3% Purchased Property Services 1,190,371 1,425,773 1,024,411 1,060,266 35,855 4% Other Purchased Services 510,253 331,609 415,664 429,967 14,303 3% Supplies 3,192,493 3,703,627 3,331,551 3,645,088 313,537 9% Other 17,590 99,387 71,962 72,556 594 1% Total Expenditures $ 40,817,651 $ 41,931,093 $ 41,891,580 $ 43,209,751 $ 1,318,171 3%
  • 9. Park City School District Student Activity Fund Current as of: June 1, 2010 Revenues FY2010-FY2011 Actual Original Revised Preliminary Increase Percent 2008-2009 2009-2010 2009-2010 2010-2011 (Decrease) Change Local Sources: 1500 - Interest $ 597 $ 3,200 197 $ 158 $ (39) -20% 1700 - Student Activities 2,140,680 1,600,000 1,800,934 1,800,934 - 0% 1900 - Local 98,233 225,000 23,372 23,372 0 0% Total Local Sources $ 2,239,510 $ 1,828,200 $ 1,824,503 $ 1,824,464 $ (39) 0% Expenditures FY2010-FY2011 Actual Original Revised Preliminary Increase Percent 2008-2009 2009-2010 2009-2010 2010-2011 (Decrease) Change Non-Instructional Services 100 - Salaries $ 22,305 $ 35,000 $ 4,998 $ 4,998 $ - 0% 200 - Employee Benefits 4,241 8,435 1,200 1,200 0 0% 300 - Purchased Services 0 120,000 107,381 107,381 0 0% 400 - Purchased Property Services 41,713 14,000 7,935 7,935 0 0% 500 - Other Purchased Services 5,130 300,000 224,940 224,940 0 0% 600 - Supplies 2,185,970 1,400,000 1,633,456 1,633,456 0 0% 700 - Equipment 0 2,000 20,106 1,000 (19,106) -95% 800 - Other 0 1,000 - - 0 #DIV/0! Total Expenditures $ 2,259,359 $ 1,880,435 $ 2,000,016 $ 1,980,910 $ (19,106) -1% Excess (Deficiency) for Year $ (19,849) $ (52,235) $ (175,513) $ (156,446) $ 19,067 -11% Transfers In 111,999 0 91,000 0 (91,000) ----- Fund Balances - Beginning of Year 415,202 507,352 507,352 422,839 (84,513) -17% Fund Balances - End of Year $ 507,352 $ 455,117 $ 422,839 $ 266,393 $ (156,446) -37% Summary of Fund Balances - End of Year: Reserved for: Encumbrances 0 0 0 0 0 0% Designated for: Designated for Schools 507,352 455,117 422,839 266,393 (156,446) -37% Undesignated (Available for Appropriation) 0 0 0 0 0 0 Total Fund Balances $ 507,352 $ 455,117 $ 422,839 $ 266,393 $ (312,892) -74%
  • 10. Park City School District Non K-12 Programs Fund Current as of: June 1, 2010 Revenues FY2010-FY2011 Actual Original Revised Preliminary Increase Percent 2008-2009 2009-2010 2009-2010 2010-2011 (Decrease) Change Local Sources: 1100 - Property Taxes $ 829,737 $ 874,877 $ 1,001,452 $ 999,331 $ (2,121) 0% 1200 - Local Governments, Non-LEAs 7,000 0 0 0 0 0% 1300 - Tuition 703,861 466,255 460,818 450,000 (10,818) -2% 1500 - Earnings on Investments 8,337 1,098 3,773 3,035 (738) -20% 1900 - Other Local Revenue 75,565 223,651 214,800 259,800 45,000 21% Total Local Sources 1,624,500 1,565,881 1,680,843 1,712,166 31,323 2% State Sources: 3115 - Special Education - Pre-School 97,024 101,900 101,900 76,549 (25,351) -25% 3260 - Adult High School 49,231 48,807 62,707 46,648 (16,059) -26% 3656 - ELL Family Literacy 59,436 - 31,198 29,910 (1,288) -4% Less Basic Levy (97,024) (101,900) (101,900) (76,549) 25,351 -25% Total State Sources 108,667 48,807 93,905 76,558 (17,347) (18%) Federal Sources: 4511 - Head Start 61,343 25,179 64,879 60,000 (4,879) -8% 4522 - IDEA Pre-School 39,083 0 19,797 19,706 0 0% 4900 - Other 0 86,038 0 40,000 0 0% 7667 - ARRA--Pre-K 0 0 21,383 0 (21,383) ----- Total Federal Sources 100,426 111,217 106,059 119,706 (26,262) (25%) Total Revenues $ 1,833,593 $ 1,725,905 $ 1,880,807 $ 1,908,430 $ (12,286) (1%) Expenditures FY2010-FY2011 Actual Original Revised Preliminary Increase Percent 2008-2009 2009-2010 2009-2010 2010-2011 (Decrease) Change Non-Instructional Services 100 - Salaries $ 1,295,547 $ 1,074,238 $ 1,091,420 $ 1,254,420 $ 163,000 15% 200 - Employee Benefits 356,452 333,014 322,920 388,870 65,950 20% 300 - Purchased Services 51,864 43,759 35,165 35,165 0 0% 400 - Purchased Property Services 4,477 5,264 7,790 74,819 67,029 860% 500 - Other Purchased Services 204,121 160,557 242,400 242,400 0 0% 600 - Supplies 134,420 130,598 106,821 110,560 3,739 4% 700 - Equipment 715 30,000 25,061 30,000 4,939 ----- 800 - Indirect Costs 10,459 9,471 9,050 9,050 0 0% Total Expenditures $ 2,058,055 $ 1,786,901 $ 1,840,627 $ 2,145,284 $ 304,657 17% Excess (Deficiency) for Year $ (224,462) $ (60,996) $ 40,180 $ (236,854) Fund Balances - Beginning of Year 690,123 465,661 465,661 505,841 Fund Balances - End of Year $ 465,661 $ 404,665 $ 505,841 $ 268,987 Summary of Fund Balances - End of Year: Reserved for: Encumbrances 0 0 0 0 Designated for: Employee Benefits 26,086 25,000 25,000 25,000 Other 14,764 15,000 15,000 15,000 Undesignated (Available for Appropriation) 424,811 364,665 465,841 228,987 Total Fund Balances $ 465,661 $ 404,665 $ 505,841 $ 268,987
  • 11. Park City School District Debt Service Fund Current as of: June 1, 2010 Revenues FY2010-FY2011 Actual Original Revised Preliminary Increase Percent 2008-2009 2009-2010 2009-2010 2010-2011 (Decrease) Change Local Sources: 1100 - Property Tax $ 7,335,824 $ 6,301,478 $ 6,290,081 $ 5,675,108 $ (614,973) (10%) 1500 - Earnings on Investments 10,621 975 5,094 2,721 (2,373) (47%) 1990 - Other Payments 25,590 25,000 25,000 25,000 0 0% Total Revenues $ 7,372,035 $ 6,327,453 $ 6,320,175 $ 5,702,829 $ (617,346) (10%) Expenditures FY2010-FY2011 Actual Original Revised Preliminary Increase Percent 2008-2009 2009-2010 2009-2010 2010-2011 (Decrease) Change Debt Service Payments 810 - Paying Agent Fees $ 3,500 $ 4,000 $ 2,720 $ 3,500 $ 780 29% 830 - Interest Payments 1,153,134 746,690 849,802 746,690 (103,112) (12%) 840 - Principal Payments 5,930,000 5,535,000 5,642,702 5,050,000 (592,702) (11%) Total Expenditures $ 7,086,634 $ 6,285,690 $ 6,495,224 $ 5,800,190 $ (695,034) (11%) Excess (Deficiency) for Year $ 285,401 $ 41,763 $ (175,049) $ (97,361) Transfers In from General Fund 0 0 0 0 Fund Balances - Beginning of Year 343,121 628,522 628,522 453,473 Fund Balances - End of Year $ 628,522 $ 670,285 $ 453,473 $ 356,112
  • 12. Park City School District Capital Projects Fund Current as of: June 1, 2010 Revenues FY2010-FY2011 Actual Original Revised Preliminary Increase Percent 2008-2009 2009-2010 2009-2010 2010-2011 (Decrease) Change Local Sources: 1100 - Property Taxes Capital Outlay $ 4,021,912 $ 5,291,870 $ 5,822,775 $ 4,487,027 $ (1,335,748) (23%) Ten Percent of Basic 1,463,096 1,565,274 0 0 - 0% 1500 - Earnings on Investments 371,346 43,957 136,044 98,517 (37,527) (28%) 1900 - Other Local Revenue 518,714 600,000 600,000 600,000 0 0% Total Local Sources 6,375,068 7,501,101 6,558,819 5,185,544 (1,373,275) (21%) State Sources: 3710 - Driver Education - 30,000 19,000 19,000 0 0% Total State Sources - 30,000 19,000 19,000 0 0% Federal Sources: 4500 - Restricted Grants-in-Aid 0 0 0 0 0 0% Total Federal Sources 0 0 0 0 0 0% Total Revenues $ 6,375,068 $ 7,531,101 $ 6,577,819 $ 5,204,544 $ (1,373,275) (21%) Expenditures FY2010-FY2011 Actual Original Revised Preliminary Increase Percent 2008-2009 2009-2010 2009-2010 2010-2011 (Decrease) Change Capital Outlay: 400 - Purchased Property Services 4,865,810 7,712,390 1,932,422 6,346,056 4,413,634 228% 451 - Improvements to Land and Site 183,908 150,000 366,659 446,000 79,341 22% 500 - Other Purchased Services 120,003 125,566 125,566 125,566 0 0% 600 - Supplies 148,040 188,670 157,232 165,000 7,768 5% 700 - Property 80,110 221,947 30,414 65,000 34,586 114% 732 - School Buses - 260,000 259,830 130,000 (129,830) (50%) 733 - Furniture 112,513 152,947 50,004 82,500 32,496 65% 734 - Tech and Security Equipment 1,178,639 2,125,000 3,164,317 1,840,000 (1,324,317) (42%) 735 - Non-Bus Vehicles 249,581 200,000 35,000 35,000 0 0% 739 - Equipment 716,931 650,000 825,265 772,153 (53,112) (6%) Total Expenditures $ 7,655,535 $ 11,786,520 $ 6,946,709 $ 10,007,275 $ 3,060,566 44% Excess (Deficiency) for Year $ (1,280,467) $ (4,255,419) $ (368,890) $ (4,802,731) Transfers Out 0 0 0 0 Other Financing Sources: 160,025 0 0 0 Sale of Capital Assets 545 13,000 200 500 Net Change in Fund Balances (1,119,897) (4,242,419) (368,690) (4,802,231) Fund Balances - Beginning of Year 17,908,069 16,788,172 16,788,172 16,419,482 Fund Balances - End of Year $ 16,788,172 $ 12,545,753 $ 16,419,482 $ 11,617,251 Summary of Fund Balances - End of Year: Designated for: Capital Projects 16,788,172 12,545,753 16,419,482 11,617,251 Undesignated (Available for Appropriation) 0 0 0 0 Total Fund Balances $ 16,788,172 $ 12,545,753 $ 16,419,482 $ 11,617,251
  • 13. Park City School District School Meals Program Current as of: June 1, 2010 Revenues FY2010-FY2011 Actual Original Revised Preliminary Increase Percent 2008-2009 2009-2010 2009-2010 2010-2011 (Decrease) Change Local Sources: 1500 - Earnings on Investments $ 13,963 $ 1,758 $ 5,731 $ 3,688 $ (2,043) (36%) 1610 - Sales to Pupils 650,748 778,063 638,024 638,024 0 0% 1620 - Sales to Adults 13,908 14,522 21,016 21,016 0 0% 1690 - Other Local Revenue (Vending) 81,973 95,506 78,944 78,944 0 0% Total Local Sources 760,592 889,849 743,715 741,672 (2,043) 0% State Sources: 3770 - Liquor Tax 181,743 177,000 203,510 203,510 - 0% Total State Sources 181,743 177,000 203,510 203,510 - 0% Federal Sources: 4571 - Lunch Reimbursement 323,866 250,827 394,824 394,824 0 0% 4574 - Breakfast Reimbursement 61,571 37,219 79,889 79,889 0 0% 4575 - After School 2,275 0 5,381 5,381 0 0% 4579 - Fresh Fruit and Other 27,767 0 20,044 20,044 0 0% 4970 - Donated Commodities 86,546 72,000 77,253 77,253 0 0% 8080 - ARRA--Equipment 0 0 6,418 0 (6,418) (100%) Total Federal Sources 502,025 360,046 583,809 577,391 (6,418) (1%) Total Revenues $ 1,444,360 $ 1,426,895 $ 1,531,034 $ 1,522,573 $ (12,836) (1%) Expenditures FY2010-FY2011 Actual Original Revised Preliminary Increase Percent 2008-2009 2009-2010 2009-2010 2010-2011 (Decrease) Change Food Services: 100 - Salaries $ 545,488 $ 521,137 $ 560,740 $ 560,740 $ - 0% 200 - Employee Benefits 247,220 206,370 249,138 246,726 (2,412) (1%) 300 - Purchased Professional Services 0 0 0 0 0 ----- 400 - Purchased Property Services 13,482 34,991 27,963 28,522 559 2% 500 - Other Purchased Services 52,843 49,136 65,382 66,690 1,308 2% 600 - Supplies 58,191 94,461 74,236 76,834 2,598 3% 630 - Food 605,795 608,205 635,576 657,821 22,245 3% 700 - Equipment 60,934 168,431 10,401 120,000 109,599 1054% Total Expenditures $ 1,583,953 $ 1,682,731 $ 1,623,436 $ 1,757,333 $ 133,897 8% Excess (Deficiency) for Year $ (139,593) $ (255,836) $ (92,402) $ (234,760) Fund Balances - Beginning of Year 846,705 707,112 707,112 614,710 Fund Balances - End of Year $ 707,112 $ 451,276 $ 614,710 $ 379,950