
Recommandé
Contenu connexe
Tendances
Tendances (20)
En vedette
En vedette (20)
Similaire à Population Indicators
Similaire à Population Indicators (20)
Plus de PLANETGE0GRAPHY
Dernier
Dernier (20)
Population Indicators
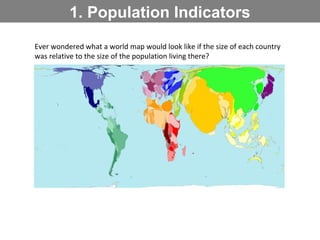
- 1. 1. Population Indicators Ever wondered what a world map would look like if the size of each country was relative to the size of the population living there?
- 2. Background information • At the start of the 20th century the world’s population was 1.65 billion. In October 1999 the world’s population passed 6 billion. • World population is expected to pass 7 billion in 2013 • The rate of population growth has started to slow down from an annual increase of 2.04% in the late 1960s to 1.31% in 2000. • The world’s population is unevenly distributed with over 80% of the population living in less developed regions • The population is also unevenly distributed within most countries as a result of a combination of human and physical factors.
- 3. Population indicators Birth rate The number of live births occurring among the population of a given geographical area during a given year, per 1,000 people Death rate The number of deaths occurring among the population of a given geographical area during a given year per 1,000 Fertility rate The expected number of children a women will have during her lifetime Infant mortality rate The number of deaths of children under one year of age occurring in a given geographical area during a year, per 1,000 live births Life expectancy The average number of years a newborn infant would live given the patterns of mortality at time of birth Migration rate The difference between the number of persons entering and leaving a country during the year per 1,000 persons Population density The population per square kilometre What are population indicators and what do they mean?
- 4. Population indicators Birth rate Death rate Fertility rate Infant mortality rate Life expectancy Migration rate Population density Niger 50.54 Angola 23.4 Niger 7.6 Angola 175.9 Japan 82.25 Zimbabwe 24.83 Monaco 16,500 Uganda 47.49 Afghanistan 17.39 Uganda 6.69 Afghanistan 149.2 San Marino 83.01 United Arab Emirates 19.00 Singapore 7,197 Mali 45.62 South Africa 17.09 Mali 6.44 Niger 112.22 Monaco 89.73 Bahrain 16.10 Malta 1,317 Birth rate Death rate Fertility rate Infant mortality rate Life expectancy Migration rate Population density Monaco 6.94 United Arab Emirates 2.06 Singapore 1.11 Monaco 1.79 Angola 38.76 Tonga –17.94 Mongolia 1.77 Japan 7.31 Kuwait 2.11 Taiwan 1.15 Singapore 2.32 Afghanistan 45.02 Guyana –15.55 Namibia 2.68 Germany 8.30 Qatar 2.43 Japan 1.21 Bermuda 2.47 Nigeria 47.56 Jordan –14.32 Australia 2.92 The table shows the highest figures for each of the population indicators The table shows the lowest figures for each of the population indicators Note that in the case of birth rate, death rate, fertility rate and infant mortality rate the figures drop as the countries develop. Life expectancy increases with development. Do any patterns exist with migration rates and population density?
- 5. Population indicators What patterns exist between the different population indicators?
- 6. Population indicators There is a negative correlation between life expectancy and infant mortality rate As life expectancy increases, infant mortality decreases Afghanistan has the highest infant mortality rate of 165 and the lowest life expectancy of 44 Iceland has the lowest infant mortality rate (1.9) and a very high life expectancy (82). Japan has the highest life expectancy (83) Zimbabwe is an anomaly as it has a life expectancy of 44 (the same as Afghanistan) but has an infant mortality rate of 62. The majority of the countries with high infant mortality rates and low life expectancies are in Africa The majority of countries with low infant mortality rates and high life expectancies are located in Western Europe, Australasia, North America and South East Asia
- 7. Population indicators There is a negative correlation between life expectancy and infant mortality rate As life expectancy increases, infant mortality decreases Afghanistan has the highest infant mortality rate of 165 and the lowest life expectancy of 44 Iceland has the lowest infant mortality rate (1.9) and a very high life expectancy (82). Japan has the highest life expectancy (83) Zimbabwe is an anomaly as it has a life expectancy of 44 (the same as Afghanistan) but has an infant mortality rate of 62. The majority of the countries with high infant mortality rates and low life expectancies are in Africa The majority of countries with low infant mortality rates and high life expectancies are located in Western Europe, Australasia, North America and South East Asia