NISAR NASA-ISRO Synthetic Aperture Radar (NISAR) Damage Mapping
•
0 j'aime•9 vues

NISAR Damage Mapping NASA National Aeronautics and Space Administration NASA-ISRO Synthetic Aperture Radar (NISAR) By Dr. Pankaj Dhussa

Recommandé
Recommandé
Contenu connexe
Similaire à NISAR NASA-ISRO Synthetic Aperture Radar (NISAR) Damage Mapping
Similaire à NISAR NASA-ISRO Synthetic Aperture Radar (NISAR) Damage Mapping (20)
Plus de Dr. Pankaj Dhussa
Plus de Dr. Pankaj Dhussa (20)
Dernier
Dernier (20)
NISAR NASA-ISRO Synthetic Aperture Radar (NISAR) Damage Mapping
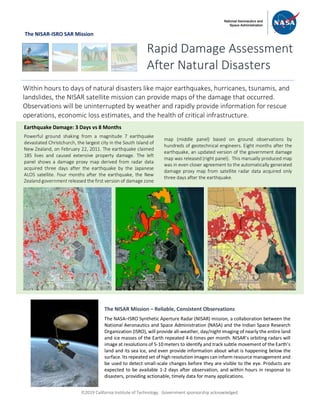
- 1. ã2019 California Institute of Technology. Government sponsorship acknowledged. The NISAR-ISRO SAR Mission Rapid Damage Assessment After Natural Disasters Within hours to days of natural disasters like major earthquakes, hurricanes, tsunamis, and landslides, the NISAR satellite mission can provide maps of the damage that occurred. Observations will be uninterrupted by weather and rapidly provide information for rescue operations, economic loss estimates, and the health of critical infrastructure. Earthquake Damage: 3 Days vs 8 Months Powerful ground shaking from a magnitude 7 earthquake devastated Christchurch, the largest city in the South Island of New Zealand, on February 22, 2011. The earthquake claimed 185 lives and caused extensive property damage. The left panel shows a damage proxy map derived from radar data acquired three days after the earthquake by the Japanese ALOS satellite. Four months after the earthquake, the New Zealand government released the first version of damage zone map (middle panel) based on ground observations by hundreds of geotechnical engineers. Eight months after the earthquake, an updated version of the government damage map was released (right panel). This manually produced map was in even closer agreement to the automatically generated damage proxy map from satellite radar data acquired only three days after the earthquake. The NISAR Mission – Reliable, Consistent Observations The NASA–ISRO Synthetic Aperture Radar (NISAR) mission, a collaboration between the National Aeronautics and Space Administration (NASA) and the Indian Space Research Organization (ISRO), will provide all-weather, day/night imaging of nearly the entire land and ice masses of the Earth repeated 4-6 times per month. NISAR’s orbiting radars will image at resolutions of 5-10 meters to identify and track subtle movement of the Earth’s land and its sea ice, and even provide information about what is happening below the surface. Its repeated set of high resolution images can inform resource management and be used to detect small-scale changes before they are visible to the eye. Products are expected to be available 1-2 days after observation, and within hours in response to disasters, providing actionable, timely data for many applications.
- 2. ã2019 California Institute of Technology. Government sponsorship acknowledged. National Aeronautics and Space Administration For more information, visit http://nisar.jpl.nasa.gov/applications Jet Propulsion Laboratory / California Institute of Technology / Pasadena, California / www.jpl.nasa.gov Wide Coverage with Essential Detail August 24, 2016, Central Italy was struck by an earthquake that killed nearly 300 people. Damage Proxy Maps were derived from ALOS-2 and COSMO- SkyMed radar data. As of August 27, optical image-based manual analysis covered the white box, COSMO-SkyMed has imaged the yellow box, and ALOS-2 has imaged the red box. The NISAR mission would have covered the blue box. Right panels show damage proxy maps of the town of Amatrice derived from ALOS-2 (up), COSMO-SkyMed (middle), and optical image- based manual analysis (bottom). The western part of Amatrice was devastated by the earthquake. Amatrice Damage Proxy Map Synthetic Aperture Radar (SAR) satellites carry their own illumination source - radar - that penetrates clouds and can be used at night. As a result, when disaster events occur, a SAR satellite can acquire a consistently high quality image as soon as it flies over the site, which can be in the range of minutes to days, depending on the satellite’s orbit and field of view. Within several hours of capturing an image, the data are sent from the satellite to the ground, where they are ingested into a server for near-real-time processing. A modern Synthetic Aperture Radar (SAR) mission is designed to image the Earth surface from the same position along its orbit in order to measure how much the surface moved, useful knowledge following an earthquake, for example. The images can be processed automatically to produce damage proxy maps – change detection maps that show areas of potential damage – by comparing scenes from before the disaster to those acquired just after it occurred.