This article examines how climate and herbivory have influenced the evolution of Senecio pterophorus, a plant native to South Africa that has invaded other regions. The study conducted a common garden experiment with populations from throughout the plant's native and introduced ranges, subjecting them to different watering treatments. It found that plants from introduced regions grew smaller and reproduced less than native plants, indicating genetic divergence related to climate differences rather than herbivory. Specifically, introduced plants adapted traits similar to native plants experiencing comparable drought conditions. The results suggest climate, not herbivory, has been the main driver of rapid evolution in S. pterophorus after invasion.
1. AcceptedArticle
This article has been accepted for publication and undergone full peer review but has not been
through the copyediting, typesetting, pagination and proofreading process, which may lead to
differences between this version and the Version of Record. Please cite this article as doi:
10.1111/1365-2435.12463
This article is protected by copyright. All rights reserved.
Received Date : 16-Jun-2014
Revised Date : 25-Mar-2015
Accepted Date : 10-Apr-2015
Article type : Standard Paper
Editor : Edith Allen
Section : Evolutionary Ecology
Contemporary evolution of an invasive plant is associated with climate but not
with herbivory
Ferran Colomer-Ventura a,b
, Jordi Martínez-Vilalta a,b
, Paolo Zuccarini c
, Anna Escolà
d
, Laura Armengot e
, Eva Castells d,
*
a
CREAF, Cerdanyola del Vallès, 08193 Barcelona, Spain
b
Departament de Biologia Animal, Vegetal i Ecologia, Universitat Autònoma Barcelona, Cerdanyola del
Vallès, 08193 Barcelona, Spain
c
IRTA, Caldes de Montbui, Barcelona, Spain
d
Departament de Farmacologia, Terapèutica i Toxicologia, Universitat Autònoma de Barcelona, Cerdanyola
del Vallès, Catalonia, Spain
e
Departament de Biologia Vegetal, Universitat de Barcelona, Barcelona, Spain
*Corresponding author: eva.castells@uab.cat, Fax. +34 935812959
2. AcceptedArticle
This article is protected by copyright. All rights reserved.
Running headline: Contemporary evolution of an invasive plant
Summary
1. Divergence in plant traits and trait plasticity after invasion has been proposed as mechanisms
favouring invasion success. Current hypotheses predict a rapid evolution in response to changes in the
abiotic conditions in the area of introduction or to differences in the herbivore consumption pressure
caused by a decrease in the enemies associated with the area of origin (e.g., evolution of increased
competitive ability –EICA– hypothesis). The importance of these factors in determining plant
geographical divergence has not been yet simultaneously evaluated.
2. Senecio pterophorus (Asteraceae) is a perennial shrub native to Eastern South Africa and a recent
invader in Western South Africa (since ~100 years ago), Australia (>70-100 years) and Europe (>30
years). These areas differ in their summer drought stress (measured as the ratio between summer
precipitation and potential evapotranspiration, P/PET) and their interactions with herbivores.
3. We performed a common garden experiment with S. pterophorus sampled throughout its entire known
distributional area to determine: 1) whether native and non-native populations diverge in their traits,
as well as the plasticity of these traits in response to water availability, and 2) whether climate and
herbivory play a role in the genetic differentiation across regions.
4. Plants from the non-native regions were smaller and had a lower reproductive output than plants from
the indigenous area. No geographical differences in phenotypic plasticity were found in response to
water availability. Herbivory was not related to the plant geographical divergence. In contrast, our
results are consistent with the role of climate as a driver for post-invasive evolution, as suggested by
adaptation of plants to a drought cline in the native range, the analogous change in plant traits in
independently invaded regions, and the convergence of vegetative traits between non-native plants
and native plants under similar drought conditions.
5. Native and non-native populations of S. pterophorus differed in plant traits, but not in trait plasticity,
in response to their local climatic conditions. Our results are contrary to the role of herbivory as a
3. AcceptedArticle
This article is protected by copyright. All rights reserved.
selective factor after invasion and highlight the importance of climate driving rapid evolution of
exotic plants.
Key-words: adaptation, biological invasions, drought, ecological clines, evolution of increased
competitive ability (EICA) hypothesis, herbivory, invasion ecology, phenotypic plasticity, plant traits, Senecio
pterophorus
Introduction
The number of invasive plants has risen dramatically during the last decades, impacting the structure, function
and dynamics of the receiver ecosystems (Mack et al. 2000). Successful plant invaders that become
established and spread into a new habitat, however, represent only few of the overall introduced species
(Williamson 1996; Kolar & Lodge 2001). Understanding why some species become invasive and others do
not is essential to predicting the outcomes of future introductions (Sol et al. 2012) but it remains an open issue
in the study of biological invasions.
During the last decade, the rapid evolution of exotic plants has been proposed as an important
determinant for invasion success (Maron et al. 2004; Prentis et al. 2008; Buswell, Moles & Hartley 2011).
Evolutionary change to novel environmental conditions is revealed by the divergence in genetically
determined traits between the native and the invasive populations. It is commonly expected that plant
genotypes with morphological and physiological traits related to higher fitness, such as an elevated growth,
biomass, reproductive capacity and competitive ability, will increase their frequency in the newly established
populations as a result of natural selection (Crawley 1987; Richards et al. 2006; Lachmuth, Durka & Schurr
2011). The characterization of the traits related to invasion, however, has proven difficult, in part because
successful strategies may vary among ecosystem types and climatic conditions (Sakai et al. 2001; Pyšek &
Richardson 2007). For example, small plants with narrow and thicker leaves perform better, and thus may be
favourably selected, in warm, dry and nutrient-poor environments compared with large plants with a high
foliar area (Westoby et al. 2002; Moles et al. 2009; Buswell, Moles & Hartley 2011). Plants may locally adapt
4. AcceptedArticle
This article is protected by copyright. All rights reserved.
Hijmans, R.J., Cameron, S.E., Parra, J.L., Jones, P.G. & Jarvis, A. (2005) Very high resolution
interpolated climate surfaces for global land areas. International Journal of Climatology, 25,
1965–1978.
Hilliard, O.M. (1977) Compositae in Natal. University of Natal Press, Pietermaritzburg.
Hoffmann, A.A. & Sgrò, C.M. (2011) Climate change and evolutionary adaptation. Nature, 470,
479–485.
Jakobs, G., Weber, E. & Edwards, P.J. (2004) Introduced plants of the invasive Solidago gigantea
(Asteraceae) are larger and grow denser than conspecifics in the native range. Diversity and
Distributions, 10, 11–19.
Kawecki, T.J. & Ebert, D. (2004) Conceptual issues in local adaptation. Ecology letters, 7, 1225–
1241.
Keane, R.M. & Crawley, M.J. (2002) Exotic plant invasions and the enemy release hypothesis.
Trends in Ecology & Evolution, 17, 164–170.
Keller, S. R. & Taylor, D. R. (2008) History, chance and adaptation during biological invasion:
separating stochastic phenotypic evolution from response to selection. Ecology Letters, 11,
852–866.
Kolar, C.S. & Lodge, D.M. (2001) Progress in invasion biology: predicting invaders. Trends in
Ecology & Evolution, 16, 199–204.
Lachmuth, S., Durka, W. & Schurr, F.M. (2011) Differentiation of reproductive and competitive
ability in the invaded range of Senecio inaequidens: the role of genetic Allee effects, adaptive
and nonadaptive evolution. New Phytologist, 192, 529–541.
Lake, J.C. & Leishman, M.R. (2004) Invasion success of exotic plants in natural ecosystems: the role
of disturbance, plant attributes and freedom from herbivores. Biological Conservation, 117,
215–226.
5. AcceptedArticle
This article is protected by copyright. All rights reserved.
Castells et al. 2013) (Table 1; see Fig. S1 in Supporting Information). The distribution of S. pterophorus in its
native range occurs along an ecological cline of drought, but on average its native range is characterized by
wetter and hotter summers compared with all non-native regions. A biogeographical study showed that non-
native plants were released from herbivory after introduction, and this release was more intense in Europe, the
region with a shorter time span since introduction (Castells et al. 2013). These differences make S.
pterophorus a suitable model species to test the simultaneous role of key abiotic and biotic factors as
determinants of plant geographical divergence.
We conducted a common garden experiment using 47 populations of S. pterophorus spanning its
entire known distributional area across the native (Eastern South Africa), the expanded (Western South
Africa) and two introduced ranges (Australia and Europe). We determined the genetic differences in
individual-level traits, leaf-level traits and reproductive traits across regions and their response to water
availability, and we asked two main questions: 1) Do plants from the expanded and introduced populations
diverge in their traits and the phenotypic plasticity of those traits in comparison with the native populations?
2) Are climate and herbivory driving this genetic differentiation across regions?
The reported differences in the abiotic and biotic environment across regions allow us to make predictions
about the factors determining plant adaptation. If climate is driving the biogeographical divergence in plant
traits, we would expect a lower growth and leaf area in the introduced areas, where the plants are subject to
drier conditions, compared with the native populations. Moreover, this pattern should be similar in all of the
introduced areas because they share a similar climate. In contrast, if plant traits are explained by differences in
herbivory among regions, the non-native plants should grow more and have a higher reproductive output
compared with the native plants, especially in Europe, where herbivore release has been more intense
(Castells et al. 2013). Finally, regardless of the factors driving post-invasive changes, plants from the non-
native populations are expected to show a higher phenotypic plasticity in response to an environmental stress
compared with the native populations.
6. AcceptedArticle
This article is protected by copyright. All rights reserved.
Materials and methods
MODEL SPECIES
Senecio pterophorus (Asteraceae) is a perennial shrub of 0.4 to 2 m in height that colonizes open and
disturbed environments, such as grasslands, forest margins and roads (Parsons & Cuthbertson 1992; Castells
et al. 2013). S. pterophorus is native to the Natal province in Eastern Cape, South Africa and was introduced
into the Western Cape Province circa 1918 (Hilliard 1977). The first citation in Australia is from 1908, but the
species became invasive approximately 1930 along the southern coast (Parsons & Cuthbertson 1992). In
continental Europe, S. pterophorus was first found near Barcelona, NE Spain, in 1982 and later in Liguria,
NW Italy, in 1990 (see references in Castells et al. 2013). Since 1994, S. pterophorus has been considered a
noxious weed subject to eradication by the Department of Environment and Primary Industries, Victoria
(Australia), and it has been recently catalogued as an invasive species in Catalonia (NE Spain) (Andreu et al.
2012). A detailed species description, distribution and invasion history of S. pterophorus is provided in
Castells et al. (2013).
FIELD SAMPLING
Senecio pterophorus was collected in 2009 and 2010 from 47 populations across the native range (Eastern
Cape in South Africa), the expanded range (Western Cape in South Africa) and two invasive ranges (Australia
and Europe) (Castells et al. 2013) (Table 1). Populations were at least 30 km apart in South Africa and
Australia and 5 km apart in Europe, covering the entire species’ known range, including the distribution limits
(Castells et al. 2013). In each population we collected seeds from 6 to 15 individuals (referred to here as
mother plants).
We calculated the ratio between summer precipitation and potential evapotranspiration (P/PET)
(Thornthwaite 1948) for each population as a measure of drought stress. Mean temperature and precipitation
during summer (June to August in the Northern Hemisphere and December to February in the Southern
Hemisphere) were obtained from the WorldClim database (Hijmans et al. 2005). Summer P/PET was
preferred over latitude or other climatic variables because it better relates to plant drought stress (e.g.,
7. AcceptedArticle
This article is protected by copyright. All rights reserved.
Martínez-Vilalta et al. 2008). Populations in the native range had, on average, a higher summer P/PET (lower
drought stress) compared with the non-native populations (Table 1). Additionally, native populations showed
a latitudinal cline of summer P/PET, with an increasing summer P/PET (decreasing summer drought) towards
the north (see Table S1).
The intensity of herbivore consumption on reproductive parts (heads and seeds) was characterized at
the original sampling locations on the same individuals used in the common garden experiment. Native and
expanded populations in South Africa had higher predation levels compared with the cross-continental
introductions, with Europe showing nearly a complete release from herbivores (Castells et al. 2013) (Table 1).
COMMON GARDEN EXPERIMENT
Experimental design
In November 2010, seeds from six individuals from 47 populations (a total of 282 mother plants) were
germinated in a mixture of Sphagnum, perlite and vermiculite (2:1:1) at the greenhouse facilities of the
Faculty of Biology, University of Barcelona (Spain). Soil was watered regularly with a Hoagland nutrient
solution. In February 2011, when the seedlings had four to five true leaves (100 days old approximately), two
seedlings per mother plant were transplanted to the common garden. We ignored whether the seedlings from a
mother plant were full-sibs or half-sibs, but for the sake of simplicity we refer to them as half-sibs throughout
this study. The common garden was conducted at the experimental fields of the Autonomous University of
Barcelona (41°29'53.3’’N, 02°06'9.6’’E) located in an old cultivated area surrounded by a Pinus halepensis
forest. The soil is typic calcixerept (Soil Survey Staff 2010) and the mean annual temperature and
precipitation are 14.9 ºC and 562.8 mm, respectively (Ninyerola et al. 2003). The weather in 2011, when the
experiment was performed, was hotter and wetter than the average (15.6 ºC and 853.1 mm) (Meteorological
Service of Catalonia 2015).
The field was divided into six plots of 58 m2
separated by 1.5 m. Three plots were left without
irrigation but receiving rainfall (Not Watered, NW) and three plots were assigned to a drip irrigation treatment
(Watered, W) set at 4.5 L/day/plant. Treatments were randomly assigned to plots. Drought was selected as a
8. AcceptedArticle
This article is protected by copyright. All rights reserved.
stress treatment to characterize phenotypic plasticity, as growth and survival of S. pterophorus are strongly
limited by water availability (Caño, Escarré & Sans 2007). Each treatment (NW and W) contained one half-
sib per mother plant, with a total of 564 individuals (47 populations x six mother plants/population x two
treatments) randomly distributed across plots within a treatment. Individuals within plots were separated by
75 cm.
Plants were watered during seven weeks after transplanting to minimize mortality and dead plants
were replaced as necessary. The irrigation experiment started in April and ran until October. Plants from the
water treatment received approximately 2212 L/m2
throughout the experiment. Drip irrigation was applied
continuously at a slow rate, and in consequence the soil was never saturated. Precipitation during the course of
the experiment was 535 L/m2
; watered plants thus received 413% more water than non-watered plants.
Measurements
Plants were monitored for mortality and phenological stage (vegetative or reproductive) once a week
throughout the experiment. The date of first flowering and the total length of the flowering period were
recorded for each individual, as these characteristics have been related to invasiveness (Pyšek & Richardson
2007). We estimated relative growth rate (RGR) as the increase in plant height, measured at the beginning of
the experiment (week 0) and at weeks 10, 16 and 23. RGR was calculated as the difference in log-transformed
plant height between two consecutive periods divided by the corresponding time interval (first period: 0-10
weeks, second period: 10-16 weeks, and third period: 16-23 weeks). Plant reproductive effort was estimated
by counting the number of flowering and fruiting heads in a plant subsample for each individual in June and
August 2011. Because plant origin and response to irrigation could affect the blooming dynamics, we chose
the highest number of heads counted at either census for each individual as an estimate of head production. To
determine the average number of seeds per head, we counted the number of seeds (achenes) of three heads per
individual plant. Total seed production was estimated by multiplying head production by the average of seeds
per head. Shoot biomass was determined at the end of the experiment (September/October 2011) for all
surviving individuals. Individuals were cut at ground level and leaves were separated from stems. Both
fractions were oven-dried at 65ºC for two to three days and weighed.
9. AcceptedArticle
This article is protected by copyright. All rights reserved.
Three leaves per plant were collected between September and October to estimate leaf-levels traits.
Fresh leaves were scanned, and foliar area and shape was determined using ImageJ (Schneider, Rasband &
Eliceiri 2012). Leaves were then oven-dried for 72 h at 65 °C and weighed. The SLA was calculated by
dividing leaf area by dry weight. A high SLA is normally associated with higher productivity and
invasiveness (Lake & Leishman 2004) and with shorter life-spans and vulnerability to herbivores and drought
stress (Burke & Grime 1996; Maroco, Pereira & Chaves 2000). Leaf shape was estimated as 4·π·leaf area/leaf
perimetre2
(shape = 1 for a perfect circle). Leaves with more dissected margins are frequently associated with
high evaporation and assimilation rates (Schuepp 1993). Total leaf area was calculated by multiplying leaf dry
weight by SLA.
Leaf N concentration, C/N ratio and C isotopic composition were analysed in 116 individuals (see
Table S1). Leaf N concentration was used as a surrogate for maximum photosynthetic capacity and, hence,
potential growth (Reich, Ellsworth & Walters 1998) whereas δ13
C was used as a proxy of water-use efficiency
(Farquhar, Ehleringer & Hubick 1989). All chemical analyses were carried out at the University of California
Davis Stable Isotope Facility (USA) using an IRMS (PDZ Europa ANCA-GSL elemental analyser interfaced
to a PDZ Europa 20-20 isotope ratio mass spectrometer). The relationship between carbon stable isotopes was
expressed in relation to a Pee-Dee Belemnite (PDB) standard. The accuracy of the measurements was
0.015‰.
To characterize the phenotypic plasticity in response to water availability, we calculated a plasticity
index (PI) between half-sibs following Valladares et al. (2000):
PI = [Mean(W) – Mean(NW)] / Max[Mean(W), Mean(NW)]
where Mean(W) and Mean(NW) are trait values of half-sibs growing in the water and non-water treatments,
respectively. PI ranges from 0 (no plasticity) to ±1 (maximum plasticity). A negative PI indicates a higher
mean value under the NW treatment (control) compared with the W treatment.
10. AcceptedArticle
This article is protected by copyright. All rights reserved.
STATISTICAL ANALYSES
A generalized binomial mixed model (logit transformation) was used to determine the effects of region,
treatment and their interactions (fixed effects) on plant survival. Mother plants nested within populations and
both crossed with plots were included as random effects. For the quantitative variables measured only once
during the course of the common garden experiment (biomass, SLA, leaf shape, total leaf area, δ13
C, N
concentration, C/N, first flowering date, flowering period, seeds per head, number of heads and total number
of seeds) a general linear mixed model was used, including region, water treatment and their interaction as
fixed effects, and the same random structure as before. For RGR, a trait measured repeatedly throughout the
experiment, the model also incorporated time as a fixed factor and individual as an additional random effect
(nested within mother plant). The variables SLA, leaf shape, total leaf area, N concentration, C/N, number of
heads and total number of seeds were normalized by a logarithmic transformation. Statistical analyses of
plasticity were conducted using general linear mixed models with region as fixed effect and population and
plot as random effects.
In a next step of our analysis we asked whether the effects of climate (P/PET) and herbivory
(percentage of predated heads) could explain differences among regions in the studied plant traits. We did that
by fitting additional linear mixed models including region, P/PET and predation as fixed effects. These
models included the interaction between region and climate and between region and predation. As before,
random effects (on the intercept of the model) included mother plant nested within population and both
crossed with plot. Two separate models were fitted: one for control (NW) plants and the other for watered (W)
plants. ANOVA Type I tables corresponding to these models are provided in the Supporting Information (see
Tables S7, S8). In these sequential analyses P/PET was introduced before Region to test whether it explained
the differences across regions obtained in the models presented in the previous paragraph. Note that P/PET
and Predation were not correlated (r2
= 0.002, P > 0.05). The variable P/PET was centred at the mean value
for all populations before the analysis (P/PETcentred= 0.76). The variables SLA, leaf shape, total leaf area, N
concentration, C/N, number of heads, total number of seeds and predation were log transformed to meet
11. AcceptedArticle
This article is protected by copyright. All rights reserved.
normality. Significance for all statistical analyses was accepted at P < 0.05. All models were fitted using the R
software v. 3.1.2 (R Development Core Team 2008) with packages nlme and lme4.
Results
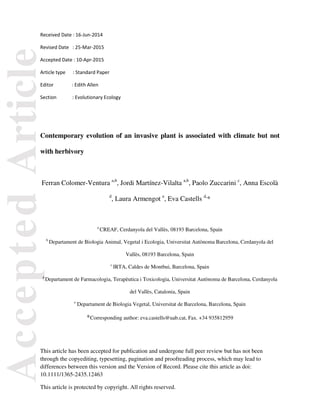
Native and non-native populations of S. pterophorus differed in plant survival, aboveground biomass, total
leaf area, leaf shape and reproductive effort (Fig. 1, see Table S2). Biomass was consistently lower in the non-
native regions, and total leaf area was also lower in Australia and Europe compared with the native range (Fig.
1, see Table S2). Similarly, Australia and Europe had a lower reproductive output (seeds per head, total
number of heads and total number of seeds) although these differences were not always significant (Fig. 1, see
Table S2). Relative to native populations, survival was lower only for Australian plants. No genetic
differences were observed between the native and non-native regions for SLA, δ13
C, N concentration, C/N or
phenology (Fig. 1, see Table S2).
Irrigation resulted in a higher biomass and total leaf area, and lower δ13
C, C/N and number of seeds
per head (Fig.1, see Table S2). Plant traits showed a plastic response to watering (i.e., plasticity index
different from zero) except for leaf shape, C/N, first flowering date, flowering period and head and seed
production (see Table S4). The response to watering was similar for all regions and most plant traits, except
for phenology in the expanded region, biomass and N and C/N in Australia, and survival in Europe (Fig.1, see
Table S2). However, the plasticity index was not different across regions for any plant trait (the only
exception was flowering period in South Africa expanded range), indicating a similar phenotypic plasticity in
the native and non-native populations (see Table S4). The effects of region and water treatment on the plant
relative growth rate (RGR) were consistent with the pattern observed for biomass (see Fig. S2, Table S3).
The role of climate and herbivory on the differences across regions was evaluated simultaneously in a
statistical model that incorporated summer P/PET and the intensity of predation measured at the population
original areas. In the native region, P/PET was positively related with biomass, total leaf area and first
flowering date and negatively related with leaf shape, N, flowering period and reproductive output variables
(Figs 2 and 3; see Tables S5, S6). The general loss of a significant effect of Region when P/PET was included
12. AcceptedArticle
This article is protected by copyright. All rights reserved.
into the model (see Tables S7, S8) and the fact that the intercepts are similar across regions after accounting
for P/PETcentred (see Tables S5, S6) strongly suggests that the genetic differences in plant size and leaf area
between the native and the non-native regions can be explained by differences in P/PET. Biomass and leaf
area of the non-native populations tended to converge with the native populations with similar climatic
conditions (Figs 2 and 3). In Australia, however, the effect of P/PET on some traits was different to the one
observed for the native region, and was mostly driven by two populations with a much higher P/PET (Figs 2
and 3). Predation was generally unrelated to plant traits, particularly for control (NW) plants (see Tables S7,
S8) and the corresponding model coefficients did not differ among regions (see Tables S5, S6). Finally, leaf
shape and reproductive traits (flowering date, flowering period, number of seeds per head, number of heads
and total number of seeds) were related to P/PET at the native range (Figs 2 and 3, see Tables S5, S6).
However, climate did not completely explain the differences across regions; the overall effect of region for
some of these traits was still significant after removing the variation due to P/PET in the ANOVA analyses,
especially for water treatment (Tables S7, S8).
Discussion
DIFFERENCES BETWEEN NATIVE AND NON-NATIVE POPULATIONS
Our results are consistent with the presence of strong genetically based differences in trait values between the
native and the non-native populations of S. pterophorus. Plants from the non-native areas were smaller and
had lower leaf areas and lower reproductive capacities than plants from the native area. Because the
introduction of S. pterophorus to novel areas is relatively recent (Western Cape ~ 100 years; Australia >70-
100 years; Europe >30 years) (Castells et al. 2013), these results strongly suggest that plant traits can diverge
rapidly after invasion. Moreover, the similar pattern found between Europe and the other two non-native areas
suggests that changes may have occurred early on after the introduction. In contrast, S. pterophorus responded
similarly to watering regardless of their geographic origin. The increased plasticity hypothesis predicts that
plants from invasive populations should be more plastic than plants from the native populations (Richards et
al. 2006). Contrary to this hypothesis, we found no differences in trait plasticity between native and non-
13. AcceptedArticle
This article is protected by copyright. All rights reserved.
native S. pterophorus populations. These results are consistent with previous studies finding that trait values
were more important for determining plant invasibility than trait plasticity (Godoy et al. 2011; Matzek 2012).
CLIMATE DRIVES GEOGRAPHICAL DIVERGENCE IN PLANT TRAITS
S. pterophorus in the native region, in Eastern South Africa, is distributed along an ecological cline of
drought, from the southernmost populations subject to a higher drought stress (lower summer P/PET) to the
northernmost populations growing under wet and cool environments (higher summer P/PET). When plants
from these populations grew under the same environmental conditions in the common garden, we observed a
strong correlation between P/PET at the original sampling locations and most of the measured plant traits.
Plants from drier areas were smaller and had lower leaf area, more dissected leaf margins, earlier blooming,
longer reproductive period and higher seed production compared with plants from more humid areas. These
genetically based trends along a climatic gradient suggest that plants are locally adapted to the conditions in
the native area (Kawecki & Ebert 2004). Indeed, short stature, small size and low leaf area are believed to be
advantageous under dry environmental conditions (Martínez-Vilalta et al. 2009; Hartmann 2011).
Because summer drought is more severe in the three non-native areas (Western South Africa,
Australia and Europe) than in the native range, we hypothesize that climate may have also driven divergence
of vegetative traits after invasion. Several pieces of evidence support this idea. First, the direct effect of region
was no longer significant when P/PETcentred was included into the statistical model (see Tables S7, S8).
Second, the estimated trait values at the mean P/PET were similar across regions (see Tables S5, S6)
indicating that geographical differences in plant traits could be explained by differences in climate. Third, the
direction of the changes across regions was, on average, similar for all of the introduced areas: introduced
plants from Western South Africa, Australia and Europe had lower biomass and leaf area than the native
populations. This pattern is only consistent with a response to similar climatic conditions, as these regions
differed in their introduction time, distance from the source populations, and biotic environment. Finally,
differences in individual-level and leaf-level plant traits after introduction were consistent with the climatic
14. AcceptedArticle
This article is protected by copyright. All rights reserved.
effects within the native region. Moreover, the value of individual-level and leaf-level traits in the non-native
populations tended toward convergence with the native populations under similar climatic conditions, except
for two Australian populations from New South Wales (A01 and A02; see Table S1) that experienced a much
higher P/PET than the rest of populations from the same region.
The role of climate as a main driver for changes in reproductive traits between native and non-native
populations was not as consistent as for vegetative traits. Because plants growing under drier conditions in the
native region had a longer flowering period and a higher head and seed production, we would expect
introduced plants to behave similarly in accordance with their climate. However, non-native plants tended to
have a shorter reproductive season and lower seed production than native plants under similar P/PET
conditions (Fig. 3). These results suggest that in addition to climate, other factors not included in this study
were probably determining geographical differences in reproductive traits.
Genetically based differences between regions could also be caused by non-adaptative events such as
demographic bottlenecks and genetic drift or the plant introduction routes (Keller & Taylor, 2008; Lachmuth
et al., 2011). We cannot reject that neutral events contributed to the geographical divergence, but the
relationship between climate and plant traits within the native region and the convergence between introduced
and native plants from similar climates are indicative of adaptive evolution. Moreover, the similar pattern
observed in all non-native regions suggests that a directional change has occurred in three presumed
independent events. Finally, the genetic similarity across the native and non-native areas obtained by neutral
markers (AFLPs) (Vilatersana et al., unpublished data) shows that the S. pterophorus in Western South
Africa, Australia and Europe comes from multiple introductions spanning a range of climates in the native
area. Thus, the convergence observed in the common garden between the introduced populations and the
native populations with a matching climate cannot be explained solely by the invasion routes.
We acknowledge that our conclusions are limited by the fact that only one common garden located
within the European invaded range was used. Reciprocal common garden experiments have been useful to
reveal the interactions between genetically based plant trait expression and the environmental conditions from
the species’ distributional areas (Williams, Auge & Maron 2008; Colautti, Maron & Barrett 2009). However,
15. AcceptedArticle
This article is protected by copyright. All rights reserved.
we found no biogeographical divergence in trait plasticity in response to water availability (P/PET) and thus,
a priori, we would not expect significant interactions between the relative change in plant traits across regions
and the local environmental conditions in the native and introduced areas.
EVIDENCE AGAINST THE ROLE OF HERBIVORY
The release from natural enemies after invasion has been proposed as a driver for post-invasive evolution
(Crawley, 1987; Blossey & Notzold 1995; Keane & Crawley 2002). One of the most invoked hypotheses
explaining the success of invasive species, the Evolution of Increased Competitive Ability (EICA) hypothesis
(Blossey & Notzold 1995) states that under a lower consumption pressure by specialist herbivores, genotypes
allocating more resources to growth and reproduction and less to chemical defences would be favoured in the
introduced range. In our system, we did not find any relationship between herbivore release and genetically
based plant traits across regions. Contrary to the predictions of the EICA hypothesis, plants from the
introduced populations had lower growth and reproductive output compared with the native populations.
Moreover, this pattern was similar for all non-native regions, even though the release in herbivory was more
intense in Europe than in Australia (Castells et al. 2013).
Experimental support of the EICA remains controversial (Willis, Memmott & Forrester 2000; van
Kleunen & Schmid 2003; Vilà, Gómez & Maron 2003; Jakobs, Weber & Edwards 2004). This lack of
consistent results may occur, at least in part, because comparisons between native and introduced populations
tend to use limited sample sizes and cover only part of the species’ distributional areas. Under these
conditions comparisons between native and introduced populations may not use the appropriate controls,
particularly if the invasion routes are unknown (Bossdorf et al. 2005). Additionally, the release from
herbivores in the invasive range, the first premise of the EICA hypothesis, is rarely evaluated quantitatively.
We overcame most of these limitations by performing a common garden experiment with a large number of
individuals and populations from nearly all of the species’ known distributional range and incorporating data
on herbivore consumption measured in situ on the same mother plants used in the experiment. However, our
16. AcceptedArticle
This article is protected by copyright. All rights reserved.
study was limited by the fact that herbivory was estimated only once on the reproductive parts, so we cannot
discard that herbivory on shoots and roots along the entire plant life cycle could be related to plant divergence
across regions.
In addition, changes in chemical defences after invasion are an important aspect of the EICA hypothesis that
has not been covered in our study. We cannot reject that chemical defences of S. pterophorus, such as
pyrrolizidine alkaloids (Castells et al. 2014), are evolving in response to herbivory independently from
morphological traits.
To our knowledge, this is one of the first studies testing simultaneously, on the same plants, the role of climate
and herbivory as the main drivers of post-invasive evolution. A recent meta-analysis on the North American
invasive plant Lythrum salicaria (Lytharaceae) found that local plant adaptation was driven by both climatic
and biotic effects (Colautti & Barrett 2013). The results obtained here for S. pterophorus are solely consistent
with the role of climate as a driver for plant adaptation to novel environments. Our study adds to the recent
reports of rapid evolution after invasion (Maron et al. 2004; Prentis et al. 2008; Buswell, Moles & Hartley
2011; Colautti & Barrett 2013) by showing that contemporary differentiation may occur in several
independent events. The adaptation of S. pterophorus along a climatic gradient in the native range, together
with multiple introductions in each non-native region, suggests that genotypes pre-adapted to drought (with a
lower growth and leaf area) were favourably selected in the introduced areas, resulting in a rapid geographical
divergence. Although reproductive traits also varied across a climatic cline in the native range, other factors in
addition to drought contributed to their genetic divergence among regions. It remains unresolved whether
genetic changes across regions increased plant fitness as a result of local adaptation, the so called “home site
advantage” (Colautti & Barrett 2013), and whether the potential benefits at the individual level translate to
higher invasion success at the population level. Understanding the mechanisms for rapid differentiation in
response to novel climatic conditions improves our ability not only to explain the dynamics of biological
invasions but also to predict the response of native populations under climate change (Hoffmann & Sgrò
2011).
17. AcceptedArticle
This article is protected by copyright. All rights reserved.
Acknowledgements
We thank Miriam Cabezas, Maria Morante, Pere Losada, Guillem Esparza, Xavier Sans and Jose Manuel
Blanco-Moreno for technical assistance. This research was conducted thanks to the financial support provided
to E.C. by Ministerio de Ciencia e Innovación (Spain) (GCL2008-02421/BOS) and Ministerio de Economía y
Competitividad (Spain) (GCL2011-29205). E.C. and J.M.V. belong to the research group “Response of
ecosystems to climate change and environmental gradients” funded by Generalitat de Catalunya (Catalonia)
(2014 SGR-453). We thank an anonymous reviewer for her/his exhaustive contributions which improved the
quality of the final manuscript. The authors declare that they have no conflicts of interests.
Data Accessibility
Data deposited in the repository of Universitat Autònoma de Barcelona: https://ddd.uab.cat/record/131539
References
Andreu, J., Pino, J., Basnou, C., Guardiola, M. & Ordóñez, J.L. (2012) Les Espècies Exòtiques de
Catalunya. Resum Del Projecte EXOCAT 2012 (ed Departament d’Agricultura Ramaderia
Pesca Alimentació i Medi Natural). Generalitat de Catalunya.
Blossey, B. & Notzold, R. (1995) Evolution of increased competitive ability in invasive
nonindigenous plants: a hypothesis. The Journal of Ecology, 83, 887.
Bossdorf, O., Auge, H., Lafuma, L., Rogers, W.E., Siemann, E. & Prati, D. (2005) Phenotypic and
genetic differentiation between native and introduced plant populations. Oecologia, 144, 1–11.
Burke, M.J.W. & Grime, J.P. (1996) An experimental study of plant community invasibility.
Ecology, 77, 776–790.
Buswell, J.M., Moles, A.T. & Hartley, S. (2011) Is rapid evolution common in introduced plant
species? Journal of Ecology, 99, 214–224.
18. AcceptedArticle
This article is protected by copyright. All rights reserved.
Caño, L., Escarré, J. & Sans, F.X. (2007) Factors affecting the invasion success of Senecio
inaequidens and S.pterophorus in Mediterranean plant communities. Journal of Vegetation
Science, 18, 279–286.
Castells, E., Morante, M., Blanco-Moreno, J.M., Sans, F.X., Vilatersana, R. & Blasco-Moreno, A.
(2013) Reduced seed predation after invasion supports enemy release in a broad
biogeographical survey. Oecologia 173, 1397-1409.
Castells, E., Mulder,P.P.J., Pérez-Trujillo, M. (2014) Diversity of pyrrolizidine alkalodis in native
and invasive Senecio pterophorus (Asteraceae): implications for toxicity. Phytochemistry 108,
137-146.
Colautti, R.I. & Barrett, S.C.H. (2013) Rapid adaptation to climate facilitates range expansion of an
invasive plant. Science, 342, 364–366.
Colautti, R.I., Maron, J.L. & Barrett, S.C.H. (2009) Common garden comparisons of native and
introduced plant populations: latitudinal clines can obscure evolutionary inferences.
Evolutionary Applications, 2, 187–199.
Crawley, M. J. (1987) What makes a community invasible? Colonization, succession and stability
(eds A. J. Gray, M. J. Crawley & P. J. Edwards), pp. 429-853. Blackwell Scientific
Publications, Oxford.
Farquhar, G.D., Ehleringer, J.R. & Hubick, K.T. (1989) Carbon isotope discrimination and
photosynthesis. Annual Reviews os Plant Physiology and Plant Molecular Biology, 40, 503–
537.
Godoy, O., Valladares, F. & Castro-Díez, P. (2011) Multispecies comparison reveals that invasive
and native plants differ in their traits but not in their plasticity. Functional Ecology, 25, 1248–
1259.
Hartmann, H. (2011) Will a 385 million year-struggle for light become a struggle for water and for
carbon? – How trees may cope with more frequent climate change-type drought events. Global
Change Biology, 17, 642–655.
19. AcceptedArticle
This article is protected by copyright. All rights reserved.
Hijmans, R.J., Cameron, S.E., Parra, J.L., Jones, P.G. & Jarvis, A. (2005) Very high resolution
interpolated climate surfaces for global land areas. International Journal of Climatology, 25,
1965–1978.
Hilliard, O.M. (1977) Compositae in Natal. University of Natal Press, Pietermaritzburg.
Hoffmann, A.A. & Sgrò, C.M. (2011) Climate change and evolutionary adaptation. Nature, 470,
479–485.
Jakobs, G., Weber, E. & Edwards, P.J. (2004) Introduced plants of the invasive Solidago gigantea
(Asteraceae) are larger and grow denser than conspecifics in the native range. Diversity and
Distributions, 10, 11–19.
Kawecki, T.J. & Ebert, D. (2004) Conceptual issues in local adaptation. Ecology letters, 7, 1225–
1241.
Keane, R.M. & Crawley, M.J. (2002) Exotic plant invasions and the enemy release hypothesis.
Trends in Ecology & Evolution, 17, 164–170.
Keller, S. R. & Taylor, D. R. (2008) History, chance and adaptation during biological invasion:
separating stochastic phenotypic evolution from response to selection. Ecology Letters, 11,
852–866.
Kolar, C.S. & Lodge, D.M. (2001) Progress in invasion biology: predicting invaders. Trends in
Ecology & Evolution, 16, 199–204.
Lachmuth, S., Durka, W. & Schurr, F.M. (2011) Differentiation of reproductive and competitive
ability in the invaded range of Senecio inaequidens: the role of genetic Allee effects, adaptive
and nonadaptive evolution. New Phytologist, 192, 529–541.
Lake, J.C. & Leishman, M.R. (2004) Invasion success of exotic plants in natural ecosystems: the role
of disturbance, plant attributes and freedom from herbivores. Biological Conservation, 117,
215–226.
20. AcceptedArticle
This article is protected by copyright. All rights reserved.
Mack, R.N., Simberloff, D., Lonsdale, W.M., Evans, H., Clout, M. & Bazzaz, F.A. (2000) Biotic
invasions: causes, epidemiology, global consequences, and control. Ecological Applications, 10,
689–710.
Maroco, J.P., Pereira, J.S. & Chaves, M.M. (2000) Growth, photosynthesis and water-use efficiency
of two C4 Sahelian grasses subjected to water deficits. Journal of Arid Environments, 45, 119–
137.
Maron, J.L., Vilà, M., Bommarco, R., Elmendorf, S. & Beardsley, P. (2004) Rapid evolution of an
invasive plant. Ecological Monographs, 74, 261–280.
Martínez-Vilalta, J., Lopez, B.C., Adell, N., Badiella, L. & Ninyerola, M. (2008) Twentieth century
increase of Scots pine radial growth in NE Spain shows strong climate interactions. Global
Change Biology, 14, 2868-2881.
Martínez-Vilalta, J., Cochard, H., Mencuccini, M., Sterck, F., Herrero, A., Korhonen, J.F.J., Llorens,
P., Nikinmaa, E., Nolè, A., Poyatos, R., Ripullone, F., Sass-Klaassen, U. & Zweifel, R. (2009)
Hydraulic adjustment of Scots pine across Europe. New Phytologist, 184, 353–364.
Matzek, V. (2012) Trait Values, Not Trait Plasticity, Best Explain Invasive Species’ Performance in
a Changing Environment. PloS one, 7, e48821.
Meteorological Service of Catalonia (2015), URL www.meteo.cat [accessed 21 January 2015]
Moles, A.T., Warton, D.I., Warman, L., Swenson, N.G., Laffan, S.W., Zanne, A.E., Pitman, A.,
Hemmings, F.A. & Leishman, M.R. (2009) Global patterns in plant height. Journal of Ecology,
97, 923–932.
Ninyerola, M., Pons, X., Roure, J.M., Martin Vide, J., Raso, J.M. & Clavero, P. (2003) Atles
Climàtic Digital de Catalunya. Servei Meteorològic de Catalunya and Departament de Medi
Ambient, Generalitat de Catalunya.
Parsons, W.T. & Cuthbertson, E.G. (1992) Noxious Weeds of Australia. Csiro Pub.
Prentis, P.J., Wilson, J.R.U., Dormontt, E.E., Richardson, D.M. & Lowe, A.J. (2008) Adaptive
evolution in invasive species. Trends in plant science, 13, 288–94.
21. AcceptedArticle
This article is protected by copyright. All rights reserved.
Pyšek, P. & Richardson, D.M. (2007) Traits associated with invasiveness in alien pPlants: Where do
we stand? Biological Invasions (ed W. Nentwig), pp 97-125. Springer, Berlin.
R Development Core Team (2008). R: A language and environment for statistical computing. R
Foundation for Statistical Computing, Vienna, Austria. URL http://www.R-project.org
[accessed 21 January 2015]
Reich, P.B., Ellsworth, D.S. & Walters, M.B. (1998) Leaf structure (specific leaf area) modulates
photosynthesis-nitrogen relations: evidence from within and across species and functional
groups. Functional Ecology, 12, 948–958.
Richards, C.L., Bossdorf, O., Muth, N.Z., Gurevitch, J. & Pigliucci, M. (2006) Jack of all trades,
master of some? On the role of phenotypic plasticity in plant invasions. Ecology letters, 9, 981–
93.
Sakai, A.K., Allendorf, F.W., Holt, J.S., Lodge, D.M., Molofsky, J., With, K.A., Baughman, S.,
Cabin, R.J., Cohen, J.E., Ellstrand, N.C., McCauley, D.E., O’Neil, P., Parker, I.M., Thompson,
J.N. & Weller, S.G. (2001) The population biology of invasive species. Annual Reviews of
Ecology and Systematics, 32, 305–332.
Schneider, C.A., Rasband, W.S., Eliceiri, K.W. (2012) NIH Image to ImageJ: 25 years of image
analysis. Nature Methods, 9, 671-675.
Schuepp, P.H. (1993) Tansley Review No. 59 Leaf boundary layers. New Phytologist, 125, 477–507.
Soil Survey Staff (2010) Keys to Soil Taxonomy, 11th ed. USDA-Natural Resources Conservation
Service, Washington, DC.
Sol, D., Maspons, J., Vall-llosera, M., Bartomeus, I., García-Peña, G.E., Piñol, J. & Freckleton, R.P.
(2012) Unraveling the life history of succesful invaders. Science, 337, 580–583.
Thornthwaite, C. W. (1948) An approach toward a rational classification of climate. Geographical
Review 38, 55–94.
22. AcceptedArticle
This article is protected by copyright. All rights reserved.
Valladares, F., Wright, S.J., Lasso, E., Kitajima, K. & Pearcy, R.W. (2000) Plastic phenotypic
response to light of 16 congeneric shrubs from a Panamanian rainforest. Ecology, 81, 1925–
1936.
Van Kleunen, M. & Schmid, B. (2003) No evidence for an evolutionary increased competitive
ability in an invasive plant. Ecology, 84, 2816–2823.
Vanderhoeven, S., Brown, C.S., Tepolt, C.K., Tsutsui, N.D., Vanparys, V., Atkinson, S., Mahy, G. &
Monty, A. (2010) Perspective: Linking concepts in the ecology and evolution of invasive plants:
network analysis shows what has been most studied and identifies knowledge gaps.
Evolutionary Applications, 3, 193–202.
Vilà, M., Gómez, A. & Maron, J.L. (2003) Are alien plants more competitive than their native
conspecifics? A test using Hypericum perforatum L. Oecologia, 137, 211–215.
Westoby, M., Falster, D.S., Moles, A.T., Vesk, P.A. & Wright, I.J. (2002) Plant ecological strategies:
some leading dimensions of variation between species. Annual Review of Ecology and
Systematics, 33, 125–159.
Williams, J.L., Auge, H. & Maron, J.L. (2008) Different gardens, different results: native and
introduced populations exhibit contrasting phenotypes across common gardens. Oecologia, 157,
239–48.
Williamson, M. (1996) Biological Invasions. Chapman & Hall, London.
Willis, A.J. & Blossey, B. (1999) Benign environments do not explain the increased vigour of non-
indigenous plants: a cross-continental transplant experiment. Biocontrol Science and
Technology, 9, 567–577.
Willis, A.J., Memmott, J. & Forrester, R.I. (2000) Is there evidence for the post-invasion evolution
of increased size among invasive plant species? Ecology letters, 3, 275–283.
Supporting Information
Additional Supporting information may be found in the online version of this article:
23. AcceptedArticle
This article is protected by copyright. All rights reserved.
Table S1. Characteristics of the populations of Senecio pterophorus used in the common garden
experiment
Table S2. Estimates and significance of the effects of region and treatment on individual-level traits,
leaf-level traits and reproductive traits
Table S3. Estimates and significance of the effects of region and treatment on the relative growth
rate
Table S4. Estimates and significance of the plasticity index in response to a water treatment
Table S5. Estimates and significance of the effects of region, drought index and herbivory on
individual-level traits, leaf-level traits and reproductive traits of plants growing under a control (non-
watered) treatment
Table S6. Estimates and significance of the effects of region, drought index and herbivory on
individual-level traits, leaf-level traits and reproductive traits of plants growing under a water
treatment
Table S7. ANOVA Type I table corresponding to the linear mixed model presented in Table S5
Table S8. ANOVA Type I table corresponding to the linear mixed model presented in Table S6
Fig. S1. Monthly temperature and precipitation at the S. pterophorus sampling locations averaged by
region
Fig. S2. Plant height of S. pterophorus from the native region compared to three introduced regions
in a common garden under a water treatment
24. AcceptedArticle
This article is protected by copyright. All rights reserved.
Table 1. Characteristics of the Senecio pterophorus populations used in the common garden experiment,
averaged by region in the native, expanded and introduced ranges (Mean ± SE). Different letters indicate
significant differences between regions by a Tukey post-hoc contrast in a t-test
Region
Plant
Status
Populations and
individuals
Elevation*
(m)
Mean Annual
Temperature*
(ºC)
Mean Annual
Precipitation*
(mm)
Summer
P/PET†
Predation*
(% damaged
heads)
South
Africa
Native 18 pop, 107 ind 792.7 ± 96.3a
16.6 ± 0.2a
746.2 ± 31.8 1.27 ± 0.11a
25.2 ± 1.6a
Expanded 5 pop, 29 ind 133.0 ± 56.1b
16.1 ± 0.4ab
856.4 ± 86.5 0.36 ± 0.04b
33.4 ± 2.8a
Australia Introduce
d
12 pop, 70 ind 140.7 ± 46.9b
15.1 ± 0.4b
754.4 ± 63.0 0.51 ± 0.09b
15.4 ± 1.5b
Europe Introduce
d
12 pop, 72 ind 244.5 ± 46.9b
15.3 ± 0.2b
667.0 ± 19.9 0.37 ± 0.02b
0.2 ± 0.1c
* Data obtained from Castells et al. 2013
†Ratio of precipitation to potential evapotranspiration during summer (December-February in the southern hemisphere
and June-August in the northern hemisphere).
25. AcceptedArticle
This article is protected by copyright. All rights reserved.
Firstflowering(days)
80
100
120
140
160
Floweringperiod(days)
0
20
40
60
80
100
Num.heads(x10
3
)
0
1
2
3
4
Seeds/head 60
80
100
120
Num.Seeds(x10
5
)
0
1
2
3
4
5
C/N
10
15
20
25
30
N(%)
1.5
2.0
2.5
3.0
3.5
4.0
δ
13
C
-32
-30
-28
-26
Leafshape
0.05
0.10
0.15
0.20
0.25
0.30
0.35
Leafarea(dm
2
)
0
200
400
600
800
SLA(cm
2
/gDM)
75
100
125
150
175
200
225
Stembiomass(gDM)
0
250
500
750
1000
1250
1500
Leafbiomass(gDM)
0
100
200
300
400
500
Shootbiomass(gDM)
0
500
1000
1500
2000
Survival(%)
40
60
80
100
Non-watered
Watered
(a)
(b)
(c)
(d)
(e)
(f)
(g)
(i)
(k)
(l)
(m)
(n)
(j) (o)
SA
Native
SA
Exp.
AUS EUR SA
Native
SA
Exp.
AUS EUR SA
Native
SA
Exp.
AUS EUR
(h)
*
**
***
**
**
**
*
**
**
*
*
**
*
** **
*
*
**
*** *
**
**
*
*
*
**
**
**
*
*
*
*
*
Fig. 1 Individual-level traits (a-d), leaf-level traits (e-j) and reproductive traits (k-o) of S. pterophorus from
the South Africa native range (SA Native), South Africa expanded range (SA Exp.) and two introduced
regions in Australia (AUS) and Europe (EUR), growing in a common garden experiment without irrigation
26. AcceptedArticle
This article is protected by copyright. All rights reserved.
(non-watered; light grey) and with irrigation (watered; dark grey). Means ± SE are shown for percentage
survival. The boxplots for the other variables show the 25th
and 75th
percentiles (box limits), the median (inner
line), and the 10th
and 90th
(below and above whiskers, respectively). Statistical significance corresponding to
the linear mixed models of Table S2 is shown as *P < 0.05, **P< 0.01 and ***P < 0.001. The reference level
(intercept) is South Africa native range and non-watered treatment. Asterisks on top of a non-watered
treatment in the non-native regions (South Africa expanded, Australia and Europe) indicate significant
differences in this control treatment between each region and South Africa native range. Significant
differences between regions for the water treatment are not shown for simplicity. Asterisks on top of a
horizontal bar in South Africa native range indicate a significant effect of water treatment in this region.
Finally, asterisks on top of a horizontal bar in the non-native regions indicate differences in the treatment
effect (Region:Treatment) between each of these regions and South Africa native range.
27. AcceptedArticle
This article is protected by copyright. All rights reserved.
P/PET (absolute)
0.0 0.5 1.0 1.5 2.0
P/PET (absolute)
0.0 0.5 1.0 1.5 2.0
NW treatment
Shootbiomass(gDM)
0
250
500
750
1000
1250
1500
Leafbiomass(gDM)
0
100
200
300
400
W treatment
South Africa-native
South Africa-expanded
Australia
Europe
(a)
(b) (g)
(f)
Stembiomass(gDM)
0
200
400
600
800
1000
1200
Totalleafarea(cm2
)
e7
e8
e9
e10
e11
e12
P/PET (centred)
-0.5 0.0 0.5 1.0
Leafshape
e-3
e-2
e-1
P/PET (centred)
-0.5 0.0 0.5 1.0
(c)
(d)
(e)
(h)
(i)
(j)
28. AcceptedArticle
This article is protected by copyright. All rights reserved.
Fig. 2 Relation between drought index and individual-level and leaf-level traits of S. pterophorus from the
native region in South Africa, the expanded region in South Africa and the introduced regions in Australia and
Europe. Drought index was expressed as the ratio of summer precipitation to potential evapotranspiration -
P/PET- centred at the average for all populations. Plants were grown in a common garden experiment without
irrigation (NW treatment) (a-e) and with irrigation (W treatment) (f-j). Each dot represents a population
average. Depicted lines represent the relationships as obtained from the coefficients of the corresponding
linear mixed models (see Tables S5, S6). For clarity, relationships are only shown for the native region (solid
line) and for any region when the slope of the relationship was significantly different from South Africa-
native (in our case only Australia, dashed line). An additional x-axis with the absolute value of P/PET is
shown as a reference.
29. AcceptedArticle
This article is protected by copyright. All rights reserved.
P/PET (absolute)
0.0 0.5 1.0 1.5 2.0
P/PET (absolute)
0.0 0.5 1.0 1.5 2.0
Num.heads(Ln)
5
6
7
8
9
NW treatment
Firstfloweringdate(days)
80
100
120
140
160
180
Floweringperiod(days)
10
30
50
70
90
W treatment
South Africa-native
South Africa-expanded
Australia
Europe
(a)
(b) (g)
(f)
Seeds/head
40
60
80
100
120
P/PET (centred)
-0.5 0.0 0.5 1.0
Totalnum.seeds(Ln)
10
11
12
13
14
P/PET (centred)
-0.5 0.0 0.5 1.0
(c)
(d)
(e)
(h)
(i)
(j)
30. AcceptedArticle
This article is protected by copyright. All rights reserved.
Fig. 3 Relation between drought index and reproductive traits of S. pterophorus from the native region in
South Africa, the expanded region in South Africa and the introduced regions in Australia and Europe.
Drought index was expressed as the ratio of summer precipitation to potential evapotranspiration -P/PET-
centred at the average for all populations. Plants were grown in a common garden experiment without
irrigation (NW treatment) (a-e) and with irrigation (W treatment) (f-j). Each dot represents a population
average. Depicted lines represent the relationships as obtained from the coefficients of the corresponding
linear mixed models (see Tables S5, S6). For clarity, relationships are only shown for the native region (solid
line) and for any region when the slope of the relationship was significantly different from South Africa-
native (in our case only Australia for some traits, dashed line). An additional x-axis with the absolute value of
P/PET is shown as a reference.