Discover Why You Should Utilize Windsor Broker’s Breaking News & Daily Reports
•
2 j'aime•482 vues

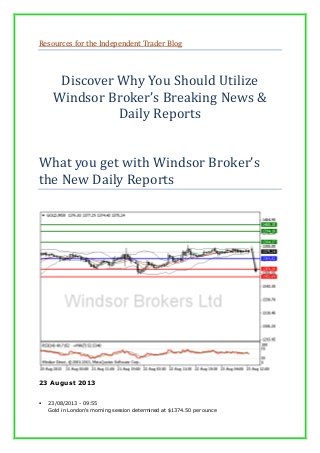
Breaking News: Gold in London's morning session determined at $1374.50 per ounce. On a daily basis our technical analysis gives you bullish and bearish alert signals on 18 instruments. More here

Recommandé
Recommandé
Contenu connexe
Dernier
Dernier (20)
En vedette
En vedette (20)
Discover Why You Should Utilize Windsor Broker’s Breaking News & Daily Reports
- 1. Resources for the Independent Trader Blog Discover Why You Should Utilize Windsor Broker’s Breaking News & Daily Reports What you get with Windsor Broker’s the New Daily Reports 23 August 2013 23/08/2013 - 09:55 Gold in London's morning session determined at $1374.50 per ounce
- 2. GOLD Near Term: Upside favored Time: 23-08-2013 09:59:00 Pivot: 1369 Our View: Long position above 1369. Target 1384. Conversely, break below 1369, to open 13529. Comments: The pair faces corrective pullback before fresh rally. Key levels 1400 1394 1384 1375 Last Price 1369 1359 1352
- 3. Breaking News: GBPCAD hits session high at 1.6498 up from today's low at 1.6386. Last trade at 1.6493. 23/08/2013 - 08:37 GBPUSD prints fresh session high at 1.5629. 23/08/2013 - 08:36 UK Prelim Business Investment JUN Q/Q 0.9% vs Exp. 0.6% Prev. -1.9%. 23/08/2013 - 08:35 GBPJPY tests resistance at 154.60. If it breaks, next resistance level at 155.00. 23/08/2013 - 08:34 UK BBA Mortgage Approvals JUL M/M 37.2K vs Exp. 38.8K Prev. 37.3K. 23/08/2013 - 08:34 GBR GDP (Gross domestic product) Q2 Q/Q 0.7% vs Exp. 0.6% Prev. 0.6%. 23/08/2013 - 00:09 Yen nearing three week low before Kuroda speaks at Jackson hole. Technical Analysis Text •Our preference: The technical preference on the trend and pivot point •Alternative scenario: An alternative scenario that might be followed if the pivot point is broken •Comments: A commentary that briefly describes the arguments underlying the trade strategy •Support and resistances: The support and resistance key levels where liquidity is concentrated •*: Not that strong Support /Resistance •**: Strong Support /Resistance •***: Very Strong Support /Resistance Technical Analysis column's title •Ticker: Instrument Code •Time: date when the analysis was published •Title: name of the analyzed underlying •ST: opinion on a Short-Term (ST) view (=1 to 2 weeks). 5 possible trends: bull, limited upside, consolidation, limited downside, downside. •MT: opinion on a Mid-Term (MT) view (1 to 2 months). 3 possible opinions: bullish, trading range, bearish. •Chg: change of the opinion since previous publication. It indicates the force of the switch and can be graded from -2 to +2 for the Short-Term view, and from -1 to +1 for the Mid-Term view. •Last: last price at the time of the analysis •SUP1 %: distance between last price and the 1st support •RES1 %: distance between last price and the 1st resistance Alerts On a daily basis technical analysis gives bullish and bearish alert signals on 18 instruments: •MM20: latest price has crossed over/through the 20-day moving average (MA20). •MM50: latest price has crossed over/through the 50-day moving average (MA50).
- 4. •MM20_MM50: the 20-day moving average is crossing over or through the 50-day moving average. •MACD_SL: the MACD (12-26) is crossing over or through the 9-day moving average. •MACD_0: the MACD (12-26) is crossing its zero line. •BOLLINGER: lasted price has crossed though the upper (green arrow) or lower (red arrow) Bollinger Band (20 periods, 2 standard deviations). •RSI70: Crossing over (green) or through (red) the 70 level on the RSI, detects overbought signals. •RSI30: Crossing over (green) or through (red) the 30 level on the RSI, detects the oversold signals. •VOLUME: when the volume is sharply higher (green). •Period: time scale of the analysis. Candlesticks Technical department scans all underlying for candlestick patterns. These patterns help you identify trend reversals and accelerations. Candlestick design: The rectangle represent the difference between opening and closing price. Doji: Opening price and closing price are equal. Suggest a bullish/bearish reversal. Hammer: Suggest a bullish reversal. Hanging Man: Suggest a bearish reversal. Inverted Hammer: Suggest a bullish reversal. Shooting star: Suggest a bearish reversal. Morning Star: Suggest a bullish reversal. Evening Star: Suggest a bearish reversal. Bullish Engulfing: Suggest a bullish reversal. Bearish Engulfing: Suggest a bearish reversal.
- 5. Dark Cloud Cover: Suggest a bearish reversal. Piercing Line: Suggest a bullish reversal. Bullish Harami: Suggest a bullish reversal. Bearish Harami: Suggest a bearish reversal. Open Trading Account Pierre A Pienaar
- 6. Retired in 2011 from trading and business. I would like to share my passion, my interests, knowledge & experiences in Forex, Options, Gold Investments, Futures, Stocks, Binary Options, Economics, Life-long Trading Education, Finances, Business, Stamp Collection, Sports, Gardening, Reading, Photography, Politics http://www.facebook.com/pierrea.pienaar https://twitter.com/pienaar_a http://www.goodreads.com/user/show/2580802-pierre-a-pienaar http://resourcesindependenttrader.blogspot.com http://www.viadeo.com/profile/0021ok1u4iwg7pwc https://www.xing.com/profile/PierreA_Pienaar?sc_o=mxb_p http://www.slideshare.net/PierreAPienaar https://plus.google.com/103487646835776536221/about http://weibo.com/3158954871/profile?topnav=1&wvr=5 http://www.linkedin.com/pub/pierre-a-pienaar/64/a4/666/ Xcelwealth Store - Business & Investing Substantial risk of loss There is a substantial risk of loss of stocks, forex, commodities, futures, options, and foreign equities are substantial. You should therefore carefully consider whether such trading is suitable for you in light of your financial condition. You should read, understand, and consider the Risk Disclosure Statement that is provided by your broker before you consider trading.
- 7. Please consider the environment before printing this message.