Las 100 mayores compañías por capitalización bursátil
•
0 j'aime•982 vues

Por primera vez, en 2016, las empresas del sector tecnológico superan a las entidades financieras en capitalización bursátil. Mientras que la cotización de los grandes grupos tecnológicos creció un 7% en 2016 –hasta alcanzar los 2.9 billones de dólares-, la de las compañías del sector financiero ha caído un 13% -para quedarse en 2.6 billones de dólares. Más info: https://www.pwc.com/gx/en/services/audit-assurance/publications/global-top-100-companies-2016.html

Recommandé
Recommandé
Contenu connexe
En vedette
Plus de PwC España
Plus de PwC España (20)
Dernier
Dernier (20)
Las 100 mayores compañías por capitalización bursátil
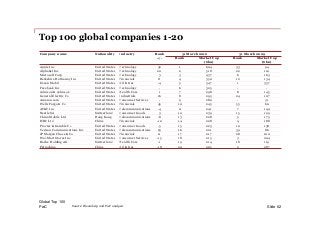
- 1. PwC Top 100 global companies 1-20 Slide 62Source: Bloomberg and PwC analysis Company name Nationality Industry Rank +/- 31 March 2016 31 March 2009 Rank Market Cap ($bn) Rank Market Cap ($bn) Apple Inc United States Technology 32 1 604 33 94 Alphabet Inc United States Technology 20 2 518 22 110 Microsoft Corp United States Technology 3 3 437 6 163 Berkshire Hathaway Inc United States Financials 8 4 350 12 134 Exxon Mobil United States Oil & Gas -4 5 347 1 337 Facebook Inc United States Technology - 6 325 - - Johnson & Johnson United States Health Care 1 7 298 8 145 General Electric Co United States Industrials 16 8 295 24 107 Amazon.com United States Consumer Services - 9 280 - 31 Wells Fargo & Co United States Financials 45 10 245 55 60 AT&T Inc United States Telecommunications -4 11 241 7 149 Nestle SA Switzerland Consumer Goods 3 12 239 15 129 China Mobile Ltd Hong Kong Telecommunications -8 13 228 5 175 ICBC Ltd China Financials -10 14 228 4 188 Procter & Gamble Co United States Consumer Goods -5 15 223 10 138 Verizon Communications Inc United States Telecommunications 23 16 221 39 86 JPMorgan Chase & Co United States Financials 11 17 217 28 100 Wal-Mart Stores Inc United States Consumer Services -15 18 215 3 204 Roche Holding AG Switzerland Health Care -1 19 214 18 119 Petrochina China Oil & Gas -18 20 205 2 287 Global Top 100
- 2. PwC Top 100 global companies 21-40 Slide 63Source: Bloomberg and PwC analysis Company name Nationality Industry Rank +/- 31 March 2016 31 March 2009 Rank Market Cap ($bn) Rank Market Cap ($bn) The Coca-Cola Co United States Consumer Goods 5 21 201 26 102 Anheuser-Busch InBev Belgium Consumer Goods 64 22 200 86 44 Alibaba Group Holding China Consumer Services - 23 196 - - Royal Dutch Shell United KingdomOil & Gas -15 24 195 9 139 Novartis AG Switzerland Health Care 4 25 195 29 100 Tencent Holdings China Technology - 26 192 - 13 Visa Inc United States Financials 51 27 184 78 47 Pfizer Inc United States Health Care 8 28 183 36 92 Chevron United States Oil & Gas -18 29 180 11 135 Toyota Motor Japan Consumer Goods -7 30 177 23 108 Oracle Corp United States Technology 6 31 170 37 90 Home Depot United States Consumer Services - 32 167 - 40 Samsung Electronics South Korea Consumer Goods 20 33 167 53 61 Walt Disney Co United States Consumer Services - 34 162 - 34 China Construction Bank Corp China Financials -22 35 161 13 133 Agricultural Bank of China China Financials - 36 157 - - Intel Corp United States Technology 3 37 153 40 84 Philip Morris International United States Consumer Goods 12 38 152 50 71 Pepsico United States Consumer Goods 3 39 150 42 80 Comcast Corp United States Consumer Services - 40 149 - 39 Global Top 100
- 3. PwC Top 100 global companies 41-60 Slide 64Source: Bloomberg and PwC analysis Company name Nationality Industry Rank +/- 31 March 2016 31 March 2009 Rank Market Cap ($bn) Rank Market Cap ($bn) Merck & Co United States Health Care 22 41 147 63 56 Bank of China Ltd China Financials -21 42 146 21 115 IBM Corp United States Technology -29 43 146 14 130 Cisco Systems United States Technology -14 44 143 30 98 NovoNordisk A/S Denmark Health Care - 45 141 - 24 Bank of America United States Financials 41 46 140 87 44 Unilever NV Netherlands Consumer Goods 13 47 136 60 58 TSMC Taiwan Technology - 48 130 - 39 Gilead Sciences United States Health Care 45 49 124 94 42 HSBC Holdings PLC United Kingdom Financials -7 50 123 43 79 Citigroup United States Financials - 51 123 - 14 Altria Group United States Consumer Goods - 52 123 - 33 UnitedHealth Group United States Health Care - 53 123 - 25 CVS Health Corp United States Consumer Services 46 54 114 100 40 McDonald's Corp United States Consumer Services -1 55 113 54 61 Amgen United States Health Care 18 56 113 74 51 Total France Oil & Gas -37 57 112 20 117 British American Tobacco PLC United Kingdom Consumer Goods 21 58 110 79 46 Bristol-Myers Squibb United States Health Care 31 59 107 90 43 Allergan (ex-Actavis) United States Health Care - 60 106 - 3 Global Top 100
- 4. PwC Top 100 global companies 61-80 Slide 65Source: Bloomberg and PwC analysis Company name Nationality Industry Rank +/- 31 March 2016 31 March 2009 Rank Market Cap ($bn) Rank Market Cap ($bn) Sanofi France Health Care -14 61 106 47 74 Medtronic Ireland Health Care - 62 105 - 33 MasterCard Inc United States Financials - 63 105 - 22 Inditex S.A. Spain Consumer Services - 64 105 - 24 Nike Inc United States Consumer Goods - 65 105 - 23 3M Co United States Industrials - 66 101 - 34 L'Oréal France Consumer Goods 28 67 101 95 41 Sabmiller PLC United Kingdom Consumer Goods - 68 99 - 22 GlaxoSmithkline United Kingdom Health Care -28 69 99 41 81 SAP Germany Technology 19 70 99 89 44 Commonwealth Bank Australia Financials - 71 99 - 36 Bayer AG Germany Basic Materials - 72 97 - 37 Kraft Heinz Co United States Consumer Goods - 73 95 - - China Life Insurance Co China Financials -42 74 95 32 95 BP United Kingdom Oil & Gas -59 75 94 16 126 United Parcel Service Inc United States Industrials -1 76 93 75 50 Schlumberger United States Oil & Gas -1 77 92 76 49 Abbvie Inc United States Health Care - 78 92 - - Walgreens Boots United States Consumer Services - 79 91 - 26 Nippon Telegraph and Telephone Corp Japan Telecommunications -21 80 90 59 59 Global Top 100
- 5. PwC Top 100 global companies 81-100 Slide 66Source: Bloomberg and PwC analysis Company name Nationality Industry Rank +/- 31 March 2016 31 March 2009 Rank Market Cap ($bn) Rank Market Cap ($bn) Siemens AG Germany Industrials -11 81 90 70 52 NTT Docomo Inc Japan Telecommunications -24 82 90 58 59 Ping An Insurance Group China Financials 9 83 89 92 43 Starbucks Corp United States Consumer Services - 84 88 - 8 Sinopec China Oil & Gas -60 85 87 25 102 LVMH SA France Consumer Goods - 86 87 - 31 Royal Bank of Canada Canada Financials 9 87 86 96 41 Honeywell International United States Industrials - 88 85 - 20 Vodafone Group PLC United Kingdom Telecommunications -54 89 85 35 92 United Technologies Corp United States Industrials 8 90 84 98 40 Japan Tobacco Japan Consumer Goods - 91 83 - 26 Ambev Brazil Consumer Goods - 92 83 - 27 Deutsche Telekom Germany Telecommunications -26 93 83 67 54 The Boeing Company United States Industrials - 94 83 - 26 Daimler AG Germany Consumer Goods - 95 82 - 27 Toronto-Dominion Bank Canada Financials - 96 80 - 29 Eli Lilly & Co United States Health Care - 97 80 - 38 Celgene Corp United States Health Care - 98 78 - 20 Westpac Banking Corp Australia Financials - 99 78 - 38 Qualcomm Inc United States Technology -48 100 76 52 64 Global Top 100