13 July Daily technical trader
•
0 j'aime•341 vues

The document provides a technical analysis of the QE Index and key Qatari stocks to consider. It analyzes the short-term trends for each as upmove, pull back or downmove based on indicators like moving averages and momentum. For most stocks, it identifies immediate resistance and support levels. It recommends positions based on a close above or below these levels over the next 1-3 weeks.

Recommandé
Contenu connexe
Tendances
Tendances (20)
En vedette
En vedette (11)
Similaire à 13 July Daily technical trader
Similaire à 13 July Daily technical trader (20)
Plus de QNB Group
Plus de QNB Group (20)
Dernier
Dernier (20)
13 July Daily technical trader
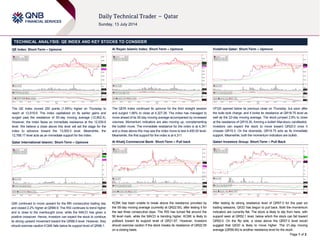
- 1. Page 1 of 2 TECHNICAL ANALYSIS: QE INDEX AND KEY STOCKS TO CONSIDER QE Index: Short-Term – Upmove The QE index moved 200 points (1.59%) higher on Thursday to reach at 12,919.6. The index capitalized on its earlier gains and surged past the resistance of 55-day moving average (12,802.4). However, the index faces an immediate resistance at the 12,939.8 level. We believe a close above this level will set the stage for the index to advance toward the 13,000.0 level. Meanwhile, the 12,768.17 level acts as an immediate support for the index. Qatar International Islamic: Short-Term – Upmove QIIK continued to move upward for the fifth consecutive trading day and closed 2.2% higher at QR86.9. The RSI continues to trend higher and is close to the overbought zone, while the MACD has given a positive crossover. Hence, investors can expect the stock to continue its strong upward movement toward the QR88.0 level. However, they should exercise caution if QIIK falls below its support level of QR86.1. Al Rayan Islamic Index: Short-Term – Upmove The QERI index continued its upmove for the third straight session and surged 1.86% to close at 4,327.28. The index has managed to move ahead of its 55-day moving average accompanied by increased volumes. Momentum indicators are also moving up, complementing the bullish move. The immediate resistance for the index is at 4,341 and a close above this may see the index move to test 4,400.00 level. Meanwhile, the first support for the index is at 4,311. Al Khalij Commercial Bank: Short-Term – Pull back KCBK has been unable to break above the resistance provided by the 55-day moving average (currently at QR22.55), after testing it for the last three consecutive days. The RSI has turned flat around the 56 level mark, while the MACD is trending higher. KCBK is likely to pullback toward its support level of QR21.87. However, investors should exercise caution if the stock breaks its resistance of QR22.55 on a closing basis. Vodafone Qatar: Short-Term – Upmove VFQS opened below its previous close on Thursday, but soon after the bulls took charge, and it broke its resistance at QR18.75 level as well as the 22-day moving average. The stock jumped 2.8% to close at the resistance of QR19.30, forming a bullish Marubozu candlestick. Investors can expect the stock to move toward QR20.0 once it crosses QR19.3. On the downside, QR18.75 acts as its immediate support. Meanwhile, both the momentum indicators are bullish. Qatari Investors Group: Short-Term – Pull Back After testing its strong resistance level of QR57.0 for the past six trading sessions, QIGD has begun to pull back. Both the momentum indicators are currently flat. The stock is likely to slip from here, with support seen at QR52.1 level, below which the stock can fall toward QR50.0. On the flip side, a close above the QR57.0 level would suggest that QIGD is likely to move higher. The 21-day moving average (QR56.90) is another resistance level for the stock.
- 2. Contacts Saugata Sarkar Abdullah Amin, CFA Shahan Keushgerian Sahbi Kasraoui Ahmed Al-Khoudary QNB Financial Services SPC Head of Research Senior Research Analyst Senior Research Analyst Manager - HNWI Head of Sales Trading – Institutional Contact Center: (+974) 4476 6666 Tel: (+974) 4476 6534 Tel: (+974) 4476 6569 Tel: (+974) 4476 6509 Tel: (+974) 4476 6544 Tel: (+974) 4476 6548 PO Box 24025 saugata.sarkar@qnbfs.com.qa abdullah.amin@qnbfs.com.qa shahan.keushgerian@qnbfs.com.qa sahbi.alkasraoui@qnbfs.com.qa ahmed.alkhoudary@qnbfs.com.qa Doha, Qatar DISCLAIMER: This publication has been prepared by QNB Financial Services SPC (“QNBFS”) a wholly-owned subsidiary of Qatar National Bank (“QNB”). QNBFS is regulated by the Qatar Financial Markets Authority and the Qatar Exchange; QNB is regulated by the Qatar Central Bank. This publication expresses the views and opinions of QNBFS at a given time only. It is not an offer, promotion or recommendation to buy or sell securities or other investments, nor is it intended to constitute legal, tax, accounting, or financial advice. We therefore strongly advise potential investors to seek independent professional advice before making any investment decision. Although the information in this report has been obtained from sources that QNBFS believes to be reliable, we have not independently verified such information and it may not be accurate or complete. While this publication has been prepared with the utmost degree of care by our analysts, QNBFS does not make any representations or warranties as to the accuracy and completeness of the information it may contain, and declines any liability in that respect. QNBFS reserves the right to amend the views and opinions expressed in this publication at any time. It may also express viewpoints or make investment decisions that differ significantly from, or even contradict, the views and opinions included in this report. COPYRIGHT: No part of this document may be reproduced without the explicit written permission of QNBFS. Page 2 of 2 *These stocks are today’s suggested ideas Overall Methodology: The charts and descriptions on Page 1 provide an indicative view of the future direction of the equities mentioned. The table on page 2 has been provided to denote historical movements in certain stocks. The historical trend analysis uses 21- and 55- day SMAs for indicating short-term and long-term trends, respectively. Based on these SMAs, the historical direction of the trend is denoted as UP, DOWN or FLAT. Selection of Key Stocks of the Day: Key stocks’ selection is based on our analysis of 19 members of the QE Index (excludes QNBK QD). Analysis includes identifying trends (short-term as well as long-term), patterns and support/resistance levels. Trend Direction: The methods used to determine trend direction are subjective in nature. We use 21-day SMA and 55-day SMA, absolute price movements, price movements relative to SMAs and accurately drawn trend lines and chart patterns to determine the short- and long-term trends. Investment Horizon: The definition of short term and long term depends upon investors’ preferences and their investment objectives. As a rule of thumb, the time horizon for traders/short-term trend is 1-3 weeks while it is 1-3 months for investors/long-term trend. Combining Technical and Fundamental Analysis: Investors can combine technical analysis (TA) with fundamental analysis (FA) to maximize their investment returns. While the “True Value” of stocks could be estimated by FA, the entry and exit timings could be fine tuned using technical analysis to benefit from short-term movements in stock prices. Trading Tactics: The trend direction should be analyzed based on the time-horizon of your investments. In general, investors attempt selling close to resistance levels during a downtrend and attempt buying close to support levels during uptrend. Definitions: 1> Simple Moving Average (SMA): A SMA is the average of the closing price of a security for a given period. 2> RSI (Relative Strength Index): A technical momentum indicator that ranges from 0 to 100 and compares the stock’s recent price movements by evaluating recent gains and losses. Stocks with RSI above 70 could be considered overbought and below 30 could be considered oversold. If the RSI falls below 70, it is a bearish signal. On the other hand, if the RSI rises above 30 it is considered bullish. We use a RSI of 14 days. 3> MACD (Moving Average Convergence Divergence): MACD denotes the relationship between two moving averages, which is used to spot changes in strength, direction, momentum and duration of a stock price trend. The MACD is calculated by subtracting the 26-day exponential moving average (EMA) from the 12-day EMA. A nine-day EMA of the MACD, called the signal line, is also plotted on top of the MACD, functioning as a trigger for buy/sell signals. The MACD line above the signal line provides a positive signal and vice versa. Name (Ticker) Last Close Trend Support Resistance Short Term Long Term First Second First Second Qatar Exchange Index (QE Index) 12,919.63 UP FLAT 12,768.17 12,678.84 12,939.80 13,079.52 Al Rayan Islamic Index (QERI Index) 4,327.28 UP FLAT 4,311.51 4,247.34 4,341.10 4,444.86 Banks and Financial Services Banks and Masraf Al Rayan (MARK QD) 55.10 UP UP 54.00 52.60 57.30 59.90 Commercial Bank of Qatar (CBQK QD) 68.40 UP FLAT 68.30 67.30 69.50 70.00 Doha Bank (DHBK QD) 58.00 DOWN DOWN 57.40 56.50 58.10 59.00 Qatar Islamic Bank (QIBK QD) 101.00 UP UP 98.40 96.00 102.36 104.42 Qatar International Islamic Bank (QIIK QD)* 86.90 UP UP 86.10 85.00 88.00 88.50 Qatar Insurance (QATI QD) 84.50 UP UP 83.90 82.50 85.50 86.50 Al Khalij Commercial Bank (KCBK QD)* 22.50 UP UP 22.35 21.87 22.60 22.99 Consumer Goods and Services Consumer G Medicare Group (MCGS QD) 87.40 UP UP 86.00 83.40 87.80 89.80 Al Meera Consumer Goods Co. (MERS QD) 175.50 UP DOWN 173.89 164.00 179.00 180.00 Industrials Industrials Industries Qatar (IQCD QD) 179.80 UP DOWN 178.30 174.90 180.10 182.50 Qatar Electricity & Water Co. (QEWS QD) 186.00 UP DOWN 185.20 182.00 186.50 188.90 Gulf International Services (GISS QD) 102.50 UP UP 101.50 100.00 103.50 104.00 Qatari Investors Group (QIGD QD)* 56.00 DOWN DOWN 52.10 50.00 57.00 60.60 Real Estate Real Estate Barwa Real Estate Co. (BRES QD) 41.50 UP UP 41.00 40.10 42.00 44.50 United Development Co. (UDCD QD) 25.40 UP UP 25.30 24.75 26.00 26.25 Telecom Telecom Ooredoo (ORDS QD) 135.50 UP DOWN 133.90 130.00 136.00 139.00 Vodafone Qatar (VFQS QD)* 19.30 UP UP 18.75 18.00 19.30 20.00 Transportation Transportat Nakilat (QGTS QD) 22.30 DOWN DOWN 22.19 21.80 22.45 23.00 Milaha (QNNS QD) 97.70 UP UP 96.50 95.10 98.00 99.00