QNBFS Daily Technical Trader Qatar - September 07, 2023 التحليل الفني اليومي ...
23 July Daily market report
1. Page 1 of 7
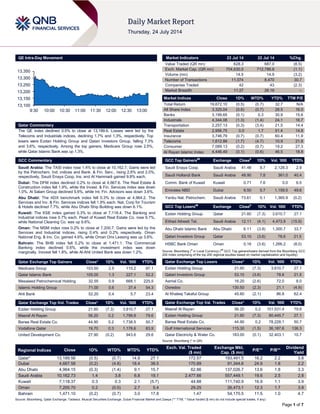
QE Intra-Day Movement
Qatar Commentary
The QE index declined 0.5% to close at 13,189.6. Losses were led by the
Telecoms and Industrials indices, declining 1.7% and 1.3%, respectively. Top
losers were Ezdan Holding Group and Qatari Investors Group, falling 7.3%
and 3.6%, respectively. Among the top gainers, Medicare Group rose 2.5%,
while Qatar Islamic Bank was up 1.3%.
GCC Commentary
Saudi Arabia: The TASI index rose 1.4% to close at 10,162.7. Gains were led
by the Petrochem. Ind. indices and Bank. & Fin. Serv., rising 2.6% and 2.0%,
respectively. Saudi Enaya Coop. Ins. and Al Hammadi gained 9.8% each.
Dubai: The DFM index declined 0.2% to close at 4,667.6. The Real Estate &
Construction index fell 1.9%, while the Invest. & Fin. Services index was down
1.0%. Al Salam Group declined 5.6%, while Int. Fin. Advisors was down 3.6%.
Abu Dhabi: The ADX benchmark index fell 0.3% to close at 4,964.2. The
Services and Inv. & Fin. Services indices fell 1.9% each. Nat. Corp for Tourism
& Hotels declined 7.7%, while Abu Dhabi Ship Building was down 6.1%.
Kuwait: The KSE index gained 0.3% to close at 7,118.4. The Banking and
Industrial indices rose 0.7% each. Pearl of Kuwait Real Estate Co. rose 9.7%,
while National Cleaning Co. was up 9.6%.
Oman: The MSM index rose 0.2% to close at 7,200.7. Gains were led by the
Services and Industrial indices, rising 0.4% and 0.2% respectively. Oman
National Eng. & Inv. Co. gained 4.6%, while Oman Orix Leasing was up 3.6%.
Bahrain: The BHB index fell 0.2% to close at 1,471.1. The Commercial
Banking index declined 0.6%, while the investment index was down
marginally. Inovest fell 1.8%, while Al-Ahli United Bank was down 1.2%.
Qatar Exchange Top Gainers Close* 1D% Vol. ‘000 YTD%
Medicare Group 103.50 2.5 115.2 97.1
Qatar Islamic Bank 105.00 1.3 227.1 52.2
Mesaieed Petrochemical Holding 32.55 0.9 668.1 225.5
Islamic Holding Group 71.00 0.6 37.4 54.3
Ahli Bank 52.20 0.4 5.7 23.4
Qatar Exchange Top Vol. Trades Close* 1D% Vol. ‘000 YTD%
Ezdan Holding Group 21.60 (7.3) 3,610.7 27.1
Masraf Al Rayan 56.20 0.2 1,799.8 79.6
Barwa Real Estate Co. 44.90 0.2 1,738.5 50.7
Vodafone Qatar 19.70 0.3 1,176.6 83.9
United Development Co. 27.90 (0.2) 943.6 29.6
Market Indicators 23 Jul 14 22 Jul 14 %Chg.
Value Traded (QR mn) 628.3 687.0 (8.5)
Exch. Market Cap. (QR mn) 704,630.5 712,786.8 (1.1)
Volume (mn) 14.5 14.9 (3.2)
Number of Transactions 11,074 8,470 30.7
Companies Traded 42 43 (2.3)
Market Breadth 11:27 26:16 –
Market Indices Close 1D% WTD% YTD% TTM P/E
Total Return 19,672.10 (0.5) (0.7) 32.7 N/A
All Share Index 3,325.04 (0.6) (0.7) 28.5 16.0
Banks 3,199.65 (0.1) 0.3 30.9 15.6
Industrials 4,344.08 (1.3) (1.4) 24.1 16.7
Transportation 2,257.13 (0.3) (3.4) 21.5 14.4
Real Estate 2,956.75 0.0 1.7 51.4 14.8
Insurance 3,746.79 (0.7) (0.7) 60.4 11.9
Telecoms 1,612.88 (1.7) (4.7) 10.9 21.8
Consumer 7,089.13 (0.2) (0.7) 19.2 27.3
Al Rayan Islamic Index 4,446.49 (0.1) (0.6) 46.5 18.8
GCC Top Gainers##
Exchange Close#
1D% Vol. ‘000 YTD%
Saudi Enaya Coop. Saudi Arabia 41.48 9.7 2,128.3 2.9
Saudi Hollandi Bank Saudi Arabia 48.90 7.8 361.0 40.4
Comm. Bank of Kuwait Kuwait 0.71 7.6 0.0 6.5
Emirates NBD Dubai 9.50 5.7 1,159.5 49.6
Yanbu Nat. Petrochem. Saudi Arabia 73.61 5.1 1,365.9 (0.2)
GCC Top Losers##
Exchange Close#
1D% Vol. ‘000 YTD%
Ezdan Holding Group Qatar 21.60 (7.3) 3,610.7 27.1
Etihad Atheeb Tel. Saudi Arabia 12.11 (4.1) 4,473.9 (15.9)
Abu Dhabi Islamic Bank Abu Dhabi 6.11 (3.8) 1,300.7 33.7
Qatari Investors Group Qatar 53.10 (3.6) 78.6 21.5
HSBC Bank Oman Oman 0.16 (3.6) 1,266.2 (8.0)
Source: Bloomberg (
#
in Local Currency) (
##
GCC Top gainers/losers derived from the Bloomberg GCC
200 Index comprising of the top 200 regional equities based on market capitalization and liquidity)
Qatar Exchange Top Losers Close* 1D% Vol. ‘000 YTD%
Ezdan Holding Group 21.60 (7.3) 3,610.7 27.1
Qatari Investors Group 53.10 (3.6) 78.6 21.5
Aamal Co. 16.20 (2.6) 72.0 8.0
Ooredoo 130.50 (2.3) 21.1 (4.9)
Al Khaleej Takaful Group 45.60 (2.1) 86.8 62.4
Qatar Exchange Top Val. Trades Close* 1D% Val. ‘000 YTD%
Masraf Al Rayan 56.20 0.2 101,531.4 79.6
Ezdan Holding Group 21.60 (7.3) 80,445.7 27.1
Barwa Real Estate Co. 44.90 0.2 78,228.1 50.7
Gulf International Services 115.30 (1.5) 36,187.6 136.3
Qatar Electricity & Water Co. 183.00 (0.1) 32,403.1 10.7
Source: Bloomberg (* in QR)
Regional Indices Close 1D% WTD% MTD% YTD%
Exch. Val. Traded
($ mn)
Exchange Mkt.
Cap. ($ mn)
P/E** P/B**
Dividend
Yield
Qatar* 13,189.56 (0.5) (0.7) 14.8 27.1 172.57 193,491.5 16.2 2.2 3.8
Dubai 4,667.58 (0.2) (4.8) 18.4 38.5 170.89 91,344.6 24.9 1.8 2.2
Abu Dhabi 4,964.15 (0.3) (1.4) 9.1 15.7 62.86 137,026.7 13.6 1.8 3.3
Saudi Arabia 10,162.73 1.4 3.8 6.8 19.1 2,477.66 557,449.1 19.6 2.5 2.8
Kuwait 7,118.37 0.3 0.3 2.1 (5.7) 44.88 111,740.9 16.9 1.1 3.9
Oman 7,200.70 0.2 (0.0) 2.7 5.4 29.25 26,473.1 12.3 1.7 3.9
Bahrain 1,471.10 (0.2) (0.7) 3.0 17.8 1.47 54,170.5 11.5 1.0 4.7
Source: Bloomberg, Qatar Exchange, Tadawul, Muscat Securities Exchange, Dubai Financial Market and Zawya (** TTM; * Value traded ($ mn) do not include special trades, if any)
13,100
13,150
13,200
13,250
13,300
13,350
9:30 10:00 10:30 11:00 11:30 12:00 12:30 13:00
2. Page 2 of 7
Qatar Market Commentary
The QE index declined 0.5% to close at 13,189.6. The Telecoms
and Industrials indices led the losses. The index fell on the back
of selling pressure from Qatari shareholders despite buying
support from non-Qatari shareholders.
Ezdan Holding Group and Qatari Investors Group were the top
losers, falling 7.3% and 3.6% respectively. Among the top
gainers, Medicare Group rose 2.5%, while Qatar Islamic Bank
was up 1.3%.
Volume of shares traded on Wednesday fell by 3.2% to 14.5mn
from 14.9mn on Tuesday. However, as compared to the 30-day
moving average of 14.1mn, volume for the day was 2.7% higher.
Ezdan Holding Group and Masraf Al Rayan were the most active
stocks, contributing 25.0% and 12.4% to the total volume
respectively.
Source: Qatar Exchange (* as a % of traded value)
Ratings, Earnings and Global Economic Data
Ratings Updates
Company Agency Market Type* Old Rating New Rating Rating Change Outlook Outlook Change
Invest Bank
(INVESTB)
Capital
Intelligence
Abu
Dhabi
FSR/LT FCR/ST
FCR/SR
BBB/BBB/A3/3 BBB/BBB/A3/3 – Stable –
Source: News reports (* LT – Long Term, ST – Short Term, FSR- Financial Strength Rating, FCR – Foreign Currency Rating, LCR – Local Currency Rating, IDR – Issuer Default Rating, SR – Support Rating, LC
– Local Currency)
Earnings Releases
Company Market Currency
Revenue
(mn)1Q2014
% Change
YoY
Operating Profit
(mn) 1Q2014
% Change
YoY
Net Profit (mn)
1Q2014
% Change
YoY
Dunia Finance* Duabi AED – – – – 82.6 48.6%
Deyaar Development Dubai AED 488.3 421.6% 73.4 -28.8% 62.5 129.2%
United Kaipara Diaries Co.* Dubai AED 170.0 16.9% -22.5 NA -20.7 NA
Majid Al Futtaim Holding
(MAF)*
Dubai AED 12800.0 NA – – 0.0 NA
Abu Dhabi Aviation (ADA)* Abu Dhabi AED 734.4 -6.1% 209.1 9.3% 109.7 16.2%
Ras Al Khaimah Poultry &
Feeding Co. (RAPCO)*
Abu Dhabi AED 25.4 NA – – 23.5 564.4%
Kuwait Projects Co. (KIPCO) Kuwait KD – – – – 11.4 NA
Al Mazaya Holding Co. Kuwait KD 5.7 -26.4% – – 1.6 673.5%
Shell Oman Marketing Co.
(SOMS)*
Oman OMR 188.5 -9.7% – – 5.7 -6.1%
Al-Hassan Engineering Co.
(AHEC)*
Oman OMR – – – – -1.8 NA
Sohar Poultry Co. (SPC)** Oman OMR 8.1 7.9% – – 0.6 77.3%
Al Maha Petroleum Products
Marketing Co.*
Oman OMR 174.8 13.9% – – 5.6 7.6%
Bahrain Commercial
Facilities Company (BCFC)
Bahrain BHD – – – – 4.2 35.5%
Source: Company data, DFM, ADX, MSM (** FY2014 results, * 1H2014 results)
Global Economic Data
Date Market Source Indicator Period Actual Consensus Previous
07/23 US MBA MBA Mortgage Applications 18 July 2.40% – -3.60%
07/23 EU European Commission Consumer Confidence July -8.4 -7.5 -7.5
07/23 France INSEE Business Survey Overall Demand July -6.0 – 7.0
07/23 France INSEE Production Outlook Indicator July -18.0 – -19.0
07/23 France INSEE Manufacturing Confidence July 97.0 98.0 97.0
07/23 France INSEE Business Confidence July 93.0 92.0 93.0
07/23 UK BBA BBA Loans for House Purchase June 43265 41375 41881
07/23 UK CBI CBI Reported Sales July 21.0 15.0 4.0
Source: Bloomberg (s.a. = seasonally adjusted; n.s.a. = non-seasonally adjusted; w.d.a. = working day adjusted)
Overall Activity Buy %* Sell %* Net (QR)
Qatari 71.59% 74.09% (15,676,968.37)
Non-Qatari 28.41% 25.91% 15,676,968.37
3. Page 3 of 7
News
Qatar
CBQK 2Q2014 profitability slightly misses estimates on the
back of higher-than-expected provisions. CBQK posted a net
profit of QR489.8mn, slightly below (5.5%) our estimate of
QR518.5mn (Bloomberg & Reuters consensus of QR513mn and
QR512.75mn). Net income declined by 8.3% and 5.5% QoQ
and YoY, respectively. A surge in provisions was the primary
cause of drop in profitability and the miss. The bank posted net
provisions (credit and investment impairments) of QR227.1mn
vs. QR59.3mn in 1Q2014 (2Q2013: QR148.2mn). CBQK
exhibited healthy performance from core banking income.
Net interest income climbed up by 5.1% QoQ (+41.9% YoY;
note YoY comparisons are impacted by Abank’s consolidation)
to QR652.7mn. The bank’s NIM has shown signs of
improvement, improving to 2.7% in 2Q2014 vs. 2.6% in 1Q2014.
Fees & commissions surged by 28.1% QoQ (+64.2% YoY) to
QR271.0mn. On the other hand, FX income was weak at
QR24.3mn (down 42.5% and 39.1% QoQ and YoY,
respectively). Share of profit from associates (QR101.8mn)
displayed positive performance, growing by 11.1% QoQ and
27.7% YoY. Operating expenses marginally increased by 3.6%
QoQ (+62.8% YoY). On the positive side, CBQK’s efficiency
ratio improved from 39.6% in 1Q2014 to 36.3% in 2Q2014
(2Q2013: 38.8%). Loan growth is yet to materialize. CBQK’s
loan book grew by 1.0% QoQ (3.8% YTD), reaching QR69.4bn.
On the other hand, deposits receded by 3.7% QoQ (down 5.6%
YTD) to QR59.8bn. As such, the LDR jumped to 116% in
2Q2014 vs. 111% in 1Q2013 (2013: 105%). Abank contributed
18.2% and 14.7% to overall loans and deposits, respectively.
(QE, QNBFS)
QISI reports QR48.6mn net profit in 1H2014 – Qatar Islamic
Insurance Company’s (QISI) net profit increased to QR48.6mn
in 1H2014 from QR35.8mn in 1H2013. EPS stood at QR3.24 in
1H2014 as compared to QR2.39 in 1H2013. (QE)
ORDS registers 2% YoY decline in 1H2014 net profit –
Ooredoo’s (ORDS) net profit fell by 2% YoY to QR1.7bn in
1H2014. ORDS’ revenue dipped to QR16.5bn in 1H2014, down
3% compared to 1H2013, despite the strong performance in
Qatar, Oman and Algeria that was offset by decline in revenue
in Indonesia, Kuwait and Iraq. ORDS’ EBITDA decreased by
10% YoY to QR6.8bn in 1H2014 (1H2013: QR 7.6bn) with
EBITDA margin decreasing to 42% (1H2013: 45%) due to lower
revenues and the continued investment across the business into
customer acquisition and retention, global brand roll-out, service
launches and customer experience. The company’s customer
base rose 2% YoY to 93.9 mn in 1H2014 backed by its
increasing share across markets. (Peninsula Qatar)
UDCD 1H2014 profit up 34% to QR521mn – United
Development Company (UDCD) posted a 34% increase in net
profit to QR521mn in 1H2014 compared with QR389mn in
1H2013 riding on strong show by group companies. UDCD’ EPS
reached QR1.41 for 1H2014, compared with QR0.92 in 1H2013,
up 53%. The Company’s gross profit stood at QR702mn in
1H2014, compared with QR508mn in 1H2013. (Gulfbase.com)
BRES posts QR222.2mn net profit in 1H2014 – Barwa Real
Estate Company (BRES) reported a net profit of QR222.2mn in
1H2014 as compared to QR199.2mn in 1H2013. The
Company’s EPS amounted to QR0.58 in 1H2014 versus
QR0.52 in 1H2013. (QE)
GDI awards N-KOM contracts worth $110mn – Gulf Drilling
International (GDI) Limited, a subsidiary of Gulf International
Services (GISS), has awarded two contracts worth $110mn to
Nakilat-Keppel Offshore & Marine (N-KOM). N-KOM is a joint
venture shipyard between Nakilat (QNNS) and Singapore’s
Keppel Offshore & Marine (Keppel O&M). The first contract is for
the construction of a self-propelled and self-elevating liftboat,
which is customized for field transit operations in the MENA
region in water depths of up to 65 meters. The liftboat, which will
be completed at the end of 2015, will provide accommodation
and platform support services for customers with operations in
Qatar. N-KOM has also bagged a six-year repair and
maintenance contract for GDI’s existing fleet of jack-up rigs
operating in the Middle East. (QE)
IBB offers UK real estate financing for GCC clients – The
Islamic Bank of Britain (IBB) is offering its UK real estate finance
products to Gulf-based clients this summer. A member of Masraf
Al Rayan Group (MARK), the IBB’s offering is tailored toward
discerning individuals seeking to purchase a property in London
or the UK for investment purposes or as a holiday home. As the
oldest Shariah-compliant retail bank in the UK, IBB is offering a
premium service for clients seeking established local expertise
and insights into the property buying process in the UK. The
bank also offers attractive financing rates and is complemented
by assistance from a dedicated team based in the Knightsbridge
area of London that specializes in assisting GCC nationals with
their property purchase in the UK. MARK intends to build upon
IBB’s excellent foundations and has invested over £100mn to
support its expansion. These include Shari’ah-compliant savings
& property finance products for retail & commercial customers
based locally and for those investing in the UK from the Gulf.
(Gulfbase.com)
MDPS: Monthly Industrial PPI rises by 0.3% month-on-
month (up 3.1% year-on-year) in May – The Ministry of
Development Planning and Statistics (MDPS) has released the
monthly Producer Price Index (PPI) of the industrial sector which
covers mining, electricity & water and manufacturing activities
for May 2014. The PPI for May 2014 stood at 170.3, which
showed an increase of 0.3% month-on-month and a year-on-
year increase of 3.1%. The mining group (with 77% weightage)
PPI increased by 0.1% month-on-month (2.9% year-on-year),
primarily due to the overall price increase seen in the crude
petroleum and natural gas group by the same percentage. The
manufacturing group (with a weight of 21%) PPI showed a rise
of 1.3% month-on-month (4.3% year-on-year). (MDPS)
QCFS to announce results on August 10 – Qatar Cinema and
Film Distribution Company (QCFS) will disclose its financial
reports for the period ending June 30, 2014, on August 10,
2014. (QE)
IQCD to announce results on August 10 – Industries Qatar
(IQCD) will disclose its financial reports for the period ending
June 30, 2014, on August 10, 2014. (QE)
QSTec strikes deal with Qatar Rail to explore solar energy
prospects – Qatar Solar Technologies (QSTec) has signed a
deal with Qatar Railways Company (Qatar Rail) to explore
opportunities that may lead to the installation of up to 80
megawatts (MW) of solar technology within Qatar’s upcoming
rail network. The company is currently building a 150 MW solar
module manufacturing facility and an 8,000-ton polysilicon
manufacturing plant in Qatar. The first stage of the deal will look
at installing ground and rooftop mounted solar PV installations
on the proposed three million square meter rail depot facility that
will be located near the new Sheikh Hamad International Airport.
(Bloomberg)
4. Page 4 of 7
International
IMF cuts US 2014 growth forecast to 1.7% – The International
Monetary Fund expects the US economy to grow 1.7% in 2014,
even more slowly than it predicted a month ago, as weakness in
the first quarter offsets an expected pick-up in the second half of
2014. The IMF, which in June forecasted a 2% growth for the
US in 2014, said US activity should accelerate to 3% to 3.5% in
the remainder of 2014, and grow by 3% in 2015 and 2016. The
IMF said that the drag on growth from the first quarter
contraction will still not be offset. US GDP contracted at an
annual pace of 2.9% in the first three months of 2014, dragged
down by a weak housing market, a slower pace of restocking by
businesses and lower exports. It was the sharpest decline in five
years. The Fund said that the lower growth expectations should
contribute to continued slack in the labor market for the next
three to four years, with the US remaining below full
employment until 2018. The IMF added that the US Federal
Reserve could keep its benchmark interest rates at zero beyond
the middle of 2015, the date implied by policy maker forecasts,
as long as inflation and financial stability concerns remain
subdued. The Fund believed the US central bank could then
raise rates at every other policy meeting, in what would be a
more gradual approach than what the median Fed forecasts
currently suggest. According to the IMF, further US growth could
be disappointing if US interest rates rise too quickly, there is a
broader & concerted slowdown in emerging markets, and
increasing geopolitical tensions in Iraq and Ukraine prompt
higher energy prices and severe financial & trade disruptions.
(Reuters)
MBA: US mortgage applications rise in latest week –
Applications for US home mortgages rose last week as both
purchase and refinancing applications picked up. The Mortgage
Bankers Association said its seasonally adjusted index of
mortgage application activity, which includes both refinancing
and home purchase demand, rose 2.4% in the week ended July
18. The MBA's seasonally adjusted index of refinancing
applications climbed 4.1%, while the gauge of loan requests for
home purchases, a leading indicator of home sales, rose 0.3%.
The fixed 30-year mortgage rates averaged 4.33% in the week,
unchanged from the week before. (Reuters)
Eurozone confidence falls in July, bodes ill for recovery –
According to the European Commission preliminary data,
consumer confidence in the Eurozone deteriorated much more
than expected in July, adding to worries about the health of the
bloc's economic recovery. The 18 countries using the Euro saw
consumer confidence falling to -8.4 in July from a revised -7.5 in
June, showing the worst reading since April, when it stood at -
8.6. Analysts surveyed by Reuters expected the bloc's
consumer confidence to edge down to -7.5 in July from the
originally reported -7.4 in June. IHS Global Insight’s Chief
European economist Howard Archer said a second successive,
and deeper dip in Eurozone consumer confidence in July will
fuel mounting concerns that already weak growth is faltering. He
added while the Eurozone consumer confidence is still clearly
above its long-term average, the recent about-turn in sentiment
is an unwelcome and worrying development. In another sign of
the fragility of the recovery, Eurozone industrial production
dropped sharply in May with only the energy sector thriving. The
confidence is suffering partly because of the conflict in eastern
Ukraine, where separatists backed by Russia are fighting
government forces. As a result, the European Union is
considering economic sanctions against Russia, but such action
would also hurt the Eurozone economy. (Reuters)
China July HSBC flash PMI rises to 18-month high –
According to a preliminary HSBC survey, activities in China's
factory sector expanded at its fastest pace in 18 months in July,
as a raft of government stimulus measures kicked in. The
HSBC/Markit Flash China Manufacturing Purchasing Managers'
Index rose to 52.0 in July from June's final reading of 50.7,
beating a forecast of 51.0 in a Reuters poll. It was the highest
reading since January 2013, and above the 50-point level that
separates growth in activity from contraction for the second
consecutive month. A sub-index measuring new orders, a gauge
of demand at home and abroad, hit a 18-month high of 53.7,
while the sub-index for output also rose to a 16-month high in
June. The final Markit/HSBC manufacturing PMI for July is due
on August 1. China's economy grew slightly faster than
expected in the second quarter as a burst of government
stimulus paid dividends, but analysts said Beijing will likely need
to offer further support to meet its growth target of around 7.5%
for 2014. (Reuters)
Japan trade deficit expands after exports unexpectedly
drop – Japan’s trade deficit was larger than forecast after
exports unexpectedly fell, dragging on an economy squeezed by
a sales-tax increase in April. The finance ministry reported that
the shortfall in June was 822.2bn Yen, surpassing the 643bn
Yen median estimate in a Bloomberg News survey of 32
economists. Exports shrank 2% from a year earlier, while
imports rose 8.4%. The government this week cut its growth
forecast for the year ending March 2015, citing weak foreign
demand and a fall in consumption after the tax rise. With fossil-
fuel imports swelling the trade deficit, now at a record 24
months, a pick-up in exports is needed to help Prime Minister
Shinzo Abe sustain growth in the world’s third-largest economy.
Citigroup’s Chief Economist Kiichi Murashima said that the trade
deficit will remain at the current level through the end of this year
with both exports and imports growing slightly. He said the
export recovery will be sluggish mainly due to structural
reasons, as Japanese companies are producing products
abroad for foreign demand. Exports to the US fell 2.2% from a
year earlier, with automobiles shipments dropping 6.8%. Exports
to Asia were down 3.8%. (Bloomberg)
Regional
Moody’s: Mideast firms face $91bn refinancing needs –
According to a Moody’s report, Middle East investment grade
companies are facing refinancing needs of about $91bn from
bank and bond debt due to mature over the next four years.
Moody’s pointed out that this accounts for about 8% of the total
EMEA bank and debt maturities of $1.17tn. The report analyses
the refinancing needs of its EMEA-based investment grade (IG)
issuers by examining their bond and bank loans maturities on an
annual basis. Among EMEA countries, companies in Germany,
France and the UK represent the greatest amounts of bank and
bond maturities (each at 15%) in the next four years. Moody’s
said refinancing concerns may shift to Russia, which now
constitutes 10% of the total EMEA (11% of European) bank &
bond maturities over the same period. The report stated that the
average investment grade corporate credit quality over the next
four years will be stable to slightly improving, with liquidity
remaining solid supported by the gradual macroeconomic
recovery. The report further added that despite the trillion debt
figure, the investment grade refinancing volumes in EMEA are
manageable within the normal capacity of capital markets.
(GulfBase.com)
Savola signs non-binding MoU to sell Savola Packaging to
Takween – Savola Group (Savola) has signed a non-binding
MoU to sell its entire share capital of Savola Packaging
Company to Takween Advanced Industries Company. The
proposed transaction is subject to various conditions and
approvals including, without limitation, Takween completing
5. Page 5 of 7
detailed due diligence on Savola Packaging to its reasonable
satisfaction, the negotiation & entry by Takween and Savola into
definitive agreements in relation to the proposed transaction, the
approval by each party board of directors as well as any
necessary shareholders and regulatory consents. HSBC Saudi
Arabia is acting as financial advisor to Takween for the
transaction. The MOU will be effective from the date of
signature, with an initial term of up to 16 weeks i.e., up to
November 11, 2014. (Tadawul)
Maaden to start commercial production of aluminum
smelter – Saudi Arabian Mining Company (Maaden) announced
that it will begin the commercial production of the aluminum
smelter at its subsidiary Maaden Aluminum Company (MAC) on
September 1, 2014. MAC is 74.9% owned by Maaden, and
25.1% owned by Alcoa – the aluminum Smelter is designed to
produce 740,000 tons per year. (Tadawul)
DHHC BoD approves expansion plan; to buy land plot for
SR97.5mn – Dallah Healthcare Holding Company’s (DHHC)
board of directors approved the company's expansion plan in its
own lands surrounding Dallah Hospital in Nakheel District,
Riyadh. This initial plan included developing three spots around
Dallah Hospital to include 150 beds, 60 clinics, housing and
services with an initial budgeted cost of SR500mn. On the same
day, the company’s board approved to buy a 6,300 square
meters land plot next to Dallah Hospital for SR97.5mn. The
move is part of the company’s plan to construct medical tower
including clinics, specialized medical centers, medical
commercial center and other facilities to be an extension of the
Dallah Hospital Complex. This project will be financed through
the company's operations and long-term Islamic financing.
(Tadawul)
Sobha Group in talks with banks for AED14.69bn project –
India-based developer Sobha Group is engaged in talks with
local and international banks to secure financing for its
AED14.69bn Sobha Hartland development in Dubai’s
Mohammad Bin Rashid City. The funding for the development
will come from a combination of internal cash and bank
financing. Work has already begun on the site with construction
underway on two schools in the new community. Sobha is
aiming to complete the phase one of the project by 1Q 2017,
while the entire development is scheduled to be completed by
2020. (GulfBase.com)
Damac’s latest project in Akoya sells out in one night –
Damac Properties’ latest project, which offers nearly 300 luxury
apartments in Loretto, located in Downtown Akoya, have been
sold out during a suhoor taking place in six venues across the
UAE in just one evening. More than 300 investors, from as far
as Saudi Arabia, Qatar, Kuwait, India, Pakistan, Russia and the
CIS countries, flocked to venues throughout the country to
capitalize on the strength and future growth of the Dubai real
estate market. The project, which will begin handing over units
in 2015, will be fully completed in 2018 and include hotels, hotel
apartments, a 1.3km outdoor retail strip, private park, schools
and hospitals. (GulfBase.com)
Mashreq Bank profit jumps 40% to AED1.16bn in 1H2014 –
Mashreq Bank reported a 40% increase in its net profit for
1H2014, climbing to AED1.16bn as compared to AED828mn in
1H2013. The net profit increased by 45% to AED585mn in
2Q2014 as compared to AED403mn in 2Q2013. The bank's net
interest income at the end of June 2014 increased by 38.1% to
AED1.44bn as compared to AED1.04bn a year earlier. EPS
strengthened to AED6.86 at the end of June 2014 as compared
to AED4.90 a year earlier. Mashreq’s total assets increased by
15.9% to reach AED103.9bn in June 2014 as compared to
AED89.7bn at the end of 2013. Loans & advances grew by
11.0% during 1H2014 to reach AED56bn, as compared to
AED50.4bn at the end of December 2013. Customer deposits
increased by 20.7%, during the same period to AED70.6bn at
the end of June 2014. (DFM)
DLD: Dubai real estate transactions for 1H2014 top
AED113bn – The Dubai Land Department (DLD) announced
that the total amount of real estate transactions recorded in
Dubai exceeded AED113bn in 1H2014. According to a financial
report issued by Real Estate Research and Studies Department,
sales accounted for 54% of the total transactions over the same
period, numbering 22,096 deals worth AED61.5bn. Sales
relating to land transactions accounted for the major share of
real estate transactions in 1H2014, amounting to AED35bn and
comprising 5,516 deals. Sales relating to units totaled
AED24.7bn for 15,997 transactions. Buildings transactions held
the third place with a figure of AED1.8bn, with the combined
total for all three categories being AED61.5bn. (Bloomberg)
CBRE: Dubai prime office rents surges 25% YoY – According
to the CBRE Group, 2Q 2014 office rents in Dubai’s Central
Business District (CBD) surged 25% YoY while it was up 3%
QoQ amid strong economic growth and rising business
confidence. Occupancy rates within prime CBD offices have
been rising steadily over the past 12 months, with less than 16%
vacancy rate as compared to an average of 40% vacancy for all
Dubai office stock. The supply of offices in Dubai will grow
significantly, with more than 1.8mn square meters to be
completed by the end of 2017. Almost 500,000 square meters of
office space is scheduled for completion in 2014, with more than
30% of that in the Business Bay area. (Bloomberg)
JLL: Abu Dhabi residential property prices up 17% in
1H2014 – According to Jones Lang LaSalle (JLL), sales prices
in Abu Dhabi’s residential property sector have increased by
average 17% in 1H2014. It was also the sixth successive
quarter of increases in sales prices for residential units, with a
7% rise over 2Q2014. Total residential stock in Abu Dhabi is
now around 240,000 units after 1,750 units were completed in
Reem Island, Danet Abu Dhabi and Al Reef during 2Q2014.
Rents in Abu Dhabi have increased following the recent removal
of the rental cap. JLL said that the increase has brought rent
prices in line with the current market levels. The average rent for
a two-bedroom increased by 3% in 2Q2014 to AED150,000,
according to JLL. The vacancy rate in Abu Dhabi office space is
expected to increase past its current rate of 30% due to
additional space scheduled to come online over the next two
years. However, office rental spaces remained unchanged in
2Q2014 with prime space averaging AED1,540 a square meter
and secondary space averaging AED1,180 a square meter. JLL
said the stock remains stable at 3.1mn square meters and there
were no major new deliveries between April and June.
Downward pressure on office rents is expected in 2014 with
130,000 square meters expected to enter the market in 2014.
Average line store retails rents for malls on Abu Dhabi Island
remained stable at AED3,000 a square meter as well as outside
Abu Dhabi at AED1,820 a square meter. The emirate’s total
retail stock is now 2.2mn square meters. Over 400,000 square
meters is expected to enter the market by the end of 2014. Hotel
occupancies year to May 2014 stood at 77% in Abu Dhabi. JLL
said the hotel market is expected to improve in 2H2014.
(GulfBase.com)
NBQ reports net profit of AED186.3mn in 1H2014 – National
Bank of Umm Al-Qaiwain (NBQ) reported a net profit of
AED186.3mn for 1H2014 as compared to AED184.7mn in
1H2013. Net profit for 2Q2014 declined to AED91mn as
compared to AED97mn in 2Q2013. EPS for 1H2014 remained
6. Page 6 of 7
flat at AED0.11 as compared to 1H2013. Net interest income for
1H2014 increased to AED224mn as compared to AED211mn in
1H2013. Total assets stood at AED12.56bn at the end of June
2014 as compared to AED12.54bn at the end of December
2013. Loans & advances stood at AED7.38bn, while customer
deposits amounted to AED7.49bn as of June 30, 2014. (ADX)
DI’s Marmum to export over 1.8mn liters Raha long-life
juices in 2014 – Marmum Dairy Farm (Marmum), a subsidiary
of Dubai Investments (DI), is planning to export over 1.8mn liters
of its Raha long-life juices across the Middle East and Africa in
2014. Marmum has set ambitious growth targets in exports with
plans to touch 3mn liters in exports by 2015 and 10mn liters by
2018. (DFM)
Jet Airways, Etihad unveil plans to reinforce commitment to
growth of India’s aviation industry – India-based Jet Airways
and Etihad have outlined plans to reinforce their long-term
commitment to the growth of India’s economy and aviation
industry, including a major new turnaround strategy for Jet
Airways to return to profitability in three years. Additionally, Jet
Airways mulls selling planes and restructuring its debts as it tries
to find ways to end the losses that have plagued it for years. The
Indian airline has lost a combined $1.3bn in the year to March
2014. (Reuters, Bloomberg)
ADPC: Abu Dhabi cargo shipments surged by 37% in
1H2014 – According to the Abu Dhabi Ports Company (ADPC),
general cargo moving through Abu Dhabi’s commercial ports
surged by 37% in 1H2014. ADPC’s commercial ports (Musaffah,
Khalifa, and Zayed Ports) handled 6.4mn freight tones (FT) of
general cargo in 1H2014 as compared to 4.7mn FT in 1H2013.
The increased volume is attributed to Abu Dhabi’s ongoing
economic growth, as well as ADPC’s work with key customers to
maximize their supply chain efficiencies. The company is
expecting to handle more than 12mn FT by the end 2014 as
compared to 9.5mn FT handled in 2013. (Bloomberg)
Ahli Bank reports net profit of OMR13.1mn in 1H2014 – Ahli
Bank reported a net profit of OMR13.1mn in 1H2014 as
compared to OMR12.5mn in 1H2013, reflecting an increase of
5%. The bank’s total assets have increased by 17% YoY to
OMR1.5bn at the end of June 2014, as compared to OMR1.3bn
at the end of June 2013. Loans & advances and financing
increased by 20% YoY to OMR1.25bn. Customer deposits rose
by 8% YoY to OMR996mn at the end of June 2014. (MSM)
NBK Bahrain reports net profit of $74.1mn in 1H2014 –
National Bank of Kuwait - Bahrain (NBK Bahrain) reported a net
profit of BHD74.1mn for 1H2014 as compared to BHD53.9mn
for 1H2013, indicating a growth of 38% YoY. The bank’s total
assets have increased by 19% to $9.2bn at the end of June
2014 as compared to $7.7bn at the end of December 2013.
Shareholders’ equity increased by 14% to $851.1mn as
compared to $745.6mn at the end of December 2013.
(GulfBase.com)
BHB announces change in GHF paid-up capital – Bahrain
Bourse (BHB) announced that the paid-up capital of Gulf
Finance House (GFH) has been increased due to the issuance
of 112,198,863 shares, pursuant to the approval from the
extraordinary general meeting held on April 14, 2014, and this
will be effective July 24, 2014. The previous total outstanding
shares was 3,161,889,967 & the new outstanding shares is
3,274,088,830, whereas the previous total paid-up capital was
$972.3mn and the new total paid up capital is $1bn. (Bahrain
Bourse)
CBB: Bahrain insurance premiums grow 8% – According to
the Central Bank of Bahrain (CBB), Bahrain’s insurance market
has posted a gross premium increase of 8% to BHD258.41mn in
2013, as compared to 2012. Motor insurance attributed a
significant part of this increase, with BHD68.05mn in 2013, up
10% from 2012. Medical insurance increased from BHD37.17mn
in 2012 to BHD40.83mn in 2013, also rising about 10% and
representing nearly 16% of the total premiums written in the
insurance market. The Takaful industry in Bahrain has
experienced a growth in gross contributions by 7% to
BHD57.22mn in 2013, with the gross contributions representing
around 22% of 2013. The total assets of insurance and takaful
firms in 2013 stood at BHD1,698.33mn as compared to BHD
1,613.28mn in 2012, up 5%. The gross premiums of reinsurance
and retakaful firms reached BHD336.57mn at the end of 2013
as compared to BHD312.12mn in 2012, indicating an increase
of around 8%. (Bloomberg)
7. Contacts
Saugata Sarkar Abdullah Amin, CFA Shahan Keushgerian
Head of Research Senior Research Analyst Senior Research Analyst
Tel: (+974) 4476 6534 Tel: (+974) 4476 6569 Tel: (+974) 4476 6509
saugata.sarkar@qnbfs.com.qa abdullah.amin@qnbfs.com.qa shahan.keushgerian@qnbfs.com.qa
Sahbi Kasraoui Ahmed Al-Khoudary QNB Financial Services SPC
Manager – HNWI Head of Sales Trading – Institutional Contact Center: (+974) 4476 6666
Tel: (+974) 4476 6544 Tel: (+974) 4476 6548 PO Box 24025
sahbi.alkasraoui@qnbfs.com.qa ahmed.alkhoudary@qnbfs.com.qa Doha, Qatar
DISCLAIMER: This publication has been prepared by QNB Financial Services SPC (“QNBFS”) a wholly-owned subsidiary of Qatar National Bank (“QNB”). QNBFS is regulated by the Qatar
Financial Markets Authority and the Qatar Exchange; QNB is regulated by the Qatar Central Bank. This publication expresses the views and opinions of QNBFS at a given time only. It is not an
offer, promotion or recommendation to buy or sell securities or other investments, nor is it intended to constitute legal, tax, accounting, or financial advice. We therefore strongly advise potential
investors to seek independent professional advice before making any investment decision. Although the information in this report has been obtained from sources that QNBFS believes to be
reliable, we have not independently verified such information and it may not be accurate or complete. While this publication has been prepared with the utmost degree of care by our analysts,
QNBFS does not make any representations or warranties as to the accuracy and completeness of the information it may contain, and declines any liability in that respect. QNBFS reserves the
right to amend the views and opinions expressed in this publication at any time. It may also express viewpoints or make investment decisions that differ significantly from, or even contradict, the
views and opinions included in this report.
COPYRIGHT: No part of this document may be reproduced without the explicit written permission of QNBFS.
Page 7 of 7
Rebased Performance Daily Index Performance
Source: Bloomberg Source: Bloomberg
Source: Bloomberg Source: Bloomberg
80.0
90.0
100.0
110.0
120.0
130.0
140.0
150.0
160.0
170.0
180.0
190.0
200.0
210.0
Jul-10 Jul-11 Jul-12 Jul-13 Jul-14
QE Index S&P Pan Arab S&P GCC
1.4%
(0.5%)
0.3%
(0.2%)
0.2%
(0.3%) (0.2%)
(0.8%)
0.0%
0.8%
1.6%
SaudiArabia
Qatar
Kuwait
Bahrain
Oman
AbuDhabi
Dubai
Asset/Currency Performance Close ($) 1D% WTD% YTD% Global Indices Performance Close 1D% WTD% YTD%
Gold/Ounce 1,304.63 (0.1) (0.5) 8.2 DJ Industrial 17,086.63 (0.2) (0.1) 3.1
Silver/Ounce 20.92 (0.2) 0.2 7.4 S&P 500 1,987.01 0.2 0.4 7.5
Crude Oil (Brent)/Barrel (FM
Future)
108.03 0.7 0.7 (2.5) NASDAQ 100 4,473.70 0.4 0.9 7.1
Natural Gas (Henry
Hub)/MMBtu
3.79 (0.1) (3.0) (12.7) STOXX 600 342.86 0.1 0.9 4.4
LPG Propane (Arab Gulf)/Ton 104.38 0.4 0.8 (17.5) DAX 9,753.56 0.2 0.3 2.1
LPG Butane (Arab Gulf)/Ton 122.50 0.2 0.4 (9.8) FTSE 100 6,798.15 0.0 0.7 0.7
Euro 1.35 (0.0) (0.4) (2.0) CAC 40 4,376.32 0.2 0.9 1.9
Yen 101.48 0.0 0.1 (3.6) Nikkei 15,328.56 (0.1) 0.7 (5.9)
GBP 1.70 (0.1) (0.3) 2.9 MSCI EM 1,077.70 0.3 1.4 7.5
CHF 1.11 0.0 (0.4) (1.0) SHANGHAI SE Composite 2,078.49 0.1 0.9 (1.8)
AUD 0.95 0.7 0.7 6.0 HANG SENG 23,971.87 0.8 2.2 2.9
USD Index 80.82 0.1 0.4 1.0 BSE SENSEX 26,147.33 0.5 2.0 23.5
RUB 34.84 (0.4) (0.8) 6.0 Bovespa 57,419.96 (1.0) 0.7 11.5
BRL 0.45 (0.3) 0.3 6.5 RTS 1,272.02 0.4 (0.3) (11.8)
189.5
157.4
141.8