Andheri Call Girls In 9825968104 Mumbai Hot Models
5 March Daily technical trader
1. TECHNICAL ANALYSIS: QE INDEX AND KEY STOCKS TO CONSIDER
QE Index: Short-Term – Neutral
Al Rayan Islamic Index: Short-Term – Neutral
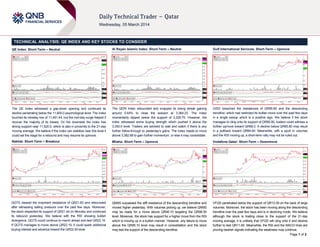
Gulf International Services: Short-Term – Upmove
The QE Index witnessed a gap-down opening and continued its
decline penetrating below the 11,600.0 psychological level. The index
touched its intraday low of 11,491.44, but the mid-day surge helped it
recover the majority of its losses. On the downside the index has
strong support near 11,520.0, which is also in proximity to the 21-day
moving average. We believe if the index can stabilize near this level it
could set the stage for a rebound and may resume its upmove.
The QERI Index rebounded and snapped its losing streak gaining
around 0.64% to close the session at 3,364.23. The index
momentarily dipped below the support of 3,329.75. However, the
index witnessed some buying strength which pushed it above the
3,350.0 level. Traders are advised to wait and watch if there is any
further follow-through to yesterday’s gains. The index needs to move
above 3,382.68 to gain further momentum, or else it may consolidate.
GISS breached the resistances of QR85.80 and the descending
trendline, which had restricted its bullish move over the past few days
in a single swoop which is a positive sign. We believe if the stock
manages to cling onto its support of QR85.80, traders could witness a
further upmove toward QR88.0. A decline below QR85.80 may result
in a pullback toward QR84.60. Meanwhile, with a spurt in volumes
and the RSI moving up, a short-term rally may not be ruled out.
Nakilat: Short-Term – Breakout
Milaha: Short-Term – Upmove
Vodafone Qatar: Short-Term – Downmove
QGTS cleared the important resistance of QR21.83 and rebounded
after witnessing selling pressure over the past few days. Moreover,
the stock respected its support of QR21.44 on Monday and continued
its rebound yesterday. We believe with the RSI showing bullish
divergence, QGTS could continue to march ahead and test QR22.19.
If QGTS manages to move above QR22.19, it could spark additional
buying interest and advance toward the QR22.45 level.
QNNS surpassed the stiff resistance of the descending trendline and
moved higher yesterday. With volumes picking up, we believe QNNS
may be ready for a move above QR95.10 targeting the QR96.50
level. Moreover, the stock has support for a higher move from the RSI
which is moving up in a bullish manner. However, any failure to move
above the QR95.10 level may result in consolidation and the stock
may test the support of the descending trendline.
VFQS penetrated below the support of QR12.09 on the back of large
volumes. Moreover, the stock has been moving along the descending
trendline over the past few days and is in declining mode. We believe
although the stock is trading close to the support of the 21-day
moving average, it is unlikely that VFQS will cling onto it and decline
further to test QR11.60. Meanwhile, the RSI and the MACD lines are
proving bearish signals indicating the weakness may continue.
Page 1 of 2
2. Name (Ticker)
Last Close
Trend
Short Term
Support
Long Term
First
Resistance
Second
First
Second
Qatar Exchange Index (QE Index)
11,588.24
UP
UP
11,520.45
11,484.00
11,660.50
11,700.00
Al Rayan Islamic Index (QERI Index)
3,364.23
UP
UP
3,350.00
3,329.75
3,382.68
3,400.30
Masraf Al Rayan (MARK QD)
37.30
DOWN
UP
36.55
35.10
38.00
39.10
Commercial Bank of Qatar (CBQK QD)
77.00
UP
UP
77.00
76.00
78.20
78.80
Doha Bank (DHBK QD)
60.90
DOWN
DOWN
60.00
58.20
62.00
63.30
Qatar Islamic Bank (QIBK QD)
75.50
DOWN
FLAT
75.00
74.50
76.00
77.00
Qatar International Islamic Bank (QIIK QD)
75.30
UP
UP
73.30
72.80
75.30
76.20
Qatar Insurance (QATI QD)
65.00
FLAT
UP
64.00
62.56
66.90
67.50
National Leasing Holding Co. (NLCS QD)
28.85
DOWN
DOWN
28.50
28.00
29.15
29.95
Widam Food Co. (WDAM QD)
41.00
DOWN
DOWN
40.45
38.70
41.90
42.30
Al Meera Consumer Goods Co. (MERS)
151.00
FLAT
UP
148.90
147.00
151.50
153.70
Industries Qatar (IQCD QD)
194.00
UP
UP
190.00
185.64
195.00
197.70
Qatar Electricity & Water Co. (QEWS QD)
167.70
DOWN
UP
165.36
164.00
170.91
172.00
Gulf International Services (GISS QD)*
86.50
UP
UP
85.80
84.60
88.00
90.00
Qatari Investors Group (QIGD QD)
41.60
DOWN
DOWN
41.00
39.50
43.45
44.20
Barwa Real Estate Co. (BRES QD)
32.10
UP
UP
31.60
30.85
32.85
33.00
United Development Co. (UDCD QD)
21.50
DOWN
DOWN
21.00
20.50
21.70
22.00
Ooredoo (ORDS QD)
146.70
DOWN
UP
145.90
143.50
149.00
151.00
Vodafone Qatar (VFQS QD)*
12.05
DOWN
UP
11.60
11.44
12.09
12.40
Nakilat (QGTS QD)*
22.00
UP
UP
21.83
21.44
22.19
22.45
Milaha (QNNS QD)*
94.90
UP
UP
93.00
91.30
95.10
96.50
Banks and Financial Services
Banks and
Consumer Goods and Services
Consumer G
Industrials
Real Estate
Telecom
Transportat
*These stocks are today’s suggested ideas
Overall Methodology: The charts and descriptions on Page 1 provide an indicative view of the future direction of the equities mentioned. The table on page 2 has been provided to denote historical movements in certain stocks. The historical trend analysis uses 21- and 55day SMAs for indicating short-term and long-term trends, respectively. Based on these SMAs, the historical direction of the trend is denoted as UP, DOWN or FLAT.
Selection of Key Stocks of the Day: Key stocks’ selection is based on our analysis of 19 members of the QE Index (excludes QNBK QD). Analysis includes identifying trends (short-term as well as long-term), patterns and support/resistance levels.
Trend Direction: The methods used to determine trend direction are subjective in nature. We use 21-day SMA and 55-day SMA, absolute price movements, price movements relative to SMAs and accurately drawn trend lines and chart patterns to determine the short- and
long-term trends.
Investment Horizon: The definition of short term and long term depends upon investors’ preferences and their investment objectives. As a rule of thumb, the time horizon for traders/short-term trend is 1-3 weeks while it is 1-3 months for investors/long-term trend.
Combining Technical and Fundamental Analysis: Investors can combine technical analysis (TA) with fundamental analysis (FA) to maximize their investment returns. While the “True Value” of stocks could be estimated by FA, the entry and exit timings could be fine
tuned using technical analysis to benefit from short-term movements in stock prices.
Trading Tactics: The trend direction should be analyzed based on the time-horizon of your investments. In general, investors attempt selling close to resistance levels during a downtrend and attempt buying close to support levels during uptrend.
Definitions:
1>
Simple Moving Average (SMA): A SMA is the average of the closing price of a security for a given period.
2>
RSI (Relative Strength Index): A technical momentum indicator that ranges from 0 to 100 and compares the stock’s recent price movements by evaluating recent gains and losses. Stocks with RSI above 70 could be considered overbought and below 30 could be
considered oversold. If the RSI falls below 70, it is a bearish signal. On the other hand, if the RSI rises above 30 it is considered bullish. We use a RSI of 14 days.
3>
MACD (Moving Average Convergence Divergence): MACD denotes the relationship between two moving averages, which is used to spot changes in strength, direction, momentum and duration of a stock price trend. The MACD is calculated by subtracting the 26-day
exponential moving average (EMA) from the 12-day EMA. A nine-day EMA of the MACD, called the signal line, is also plotted on top of the MACD, functioning as a trigger for buy/sell signals. The MACD line above the signal line provides a positive signal and vice versa.
Contacts
Saugata Sarkar
Ahmed M. Shehada
Keith Whitney
Sahbi Kasraoui
QNB Financial Services SPC
Head of Research
Tel: (+974) 4476 6534
saugata.sarkar@qnbfs.com.qa
Head of Trading
Tel: (+974) 4476 6535
ahmed.shehada@qnbfs.com.qa
Head of Sales
Tel: (+974) 4476 6533
keith.whitney@qnbfs.com.qa
Manager - HNWI
Tel: (+974) 4476 6544
sahbi.alkasraoui@qnbfs.com.qa
Contact Center: (+974) 4476 6666
PO Box 24025
Doha, Qatar
DISCLAIMER: This publication has been prepared by QNB Financial Services SPC (“QNBFS”) a wholly-owned subsidiary of Qatar National Bank (“QNB”). QNBFS is regulated by the Qatar Financial Markets Authority and the Qatar Exchange; QNB is
regulated by the Qatar Central Bank. This publication expresses the views and opinions of QNBFS at a given time only. It is not an offer, promotion or recommendation to buy or sell securities or other investments, nor is it intended to constitute legal,
tax, accounting, or financial advice. We therefore strongly advise potential investors to seek independent professional advice before making any investment decision. Although the information in this report has been obtained from sources that QNBFS
believes to be reliable, we have not independently verified such information and it may not be accurate or complete. While this publication has been prepared with the utmost degree of care by our analysts, QNBFS does not make any representations or
warranties as to the accuracy and completeness of the information it may contain, and declines any liability in that respect. QNBFS reserves the right to amend the views and opinions expressed in this publication at any time. It may also express
viewpoints or make investment decisions that differ significantly from, or even contradict, the views and opinions included in this report.
COPYRIGHT: No part of this document may be reproduced without the explicit written permission of QNBFS.
Page 2 of 2