QNBFS Weekly Market Report August 08, 2019
•
0 j'aime•95 vues

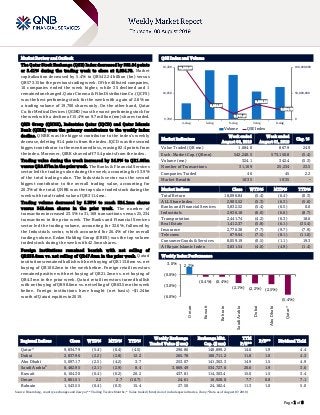
The Qatar Stock Exchange (QSE) Index decreased by 562.84 points or 5.41% during the trading week to close at 9,834.79

Recommandé
Recommandé
Contenu connexe
Plus de QNB Group
Plus de QNB Group (20)
Dernier
Dernier (20)
QNBFS Weekly Market Report August 08, 2019
- 1. ` Page 1 of 8 Market Review and Outlook QSE Index and Volume The Qatar Stock Exchange (QSE) Index decreased by 562.84 points or 5.41% during the trading week to close at 9,834.79. Market capitalization decreased by 5.4% to QR542.24 billion (bn) versus QR573.15bn the previous trading week. Of the 46 listed companies, 10 companies ended the week higher, while 35 declined and 1 remainedunchanged.QatarCinema&FilmDistributionCo. (QCFS) was the best performing stock for the week with a gain of 2.8% on a trading volume of 19,700 shares only. On the other hand, Qatar Co.forMedicalDevices(QGMD)wastheworstperformingstockfor the week with a decline of 15.4% on 9.7 million (mn) shares traded. QNB Group (QNBK), Industries Qatar (IQCD) and Qatar Islamic Bank (QIBK) were the primary contributors to the weekly index decline. QNBK was the biggest contributor to the index’s weekly decrease, deleting 91.4 points from the index. IQCD was the second biggest contributor to the mentioned loss, erasing 82.4 points from the index. Moreover, QIBK shaved off 75.4 points from the index. Trading value during the week increased by 24.9% to QR1.08bn versus QR0.87bn in the prior week. The Banks & Financial Services sector led the trading value during the week, accounting for 53.9% of the total trading value. The Industrials sector was the second biggest contributor to the overall trading value, accounting for 20.3% of the total. QNBK was the top value traded stock during the week with total traded value of QR311.4mn. Trading volume decreased by 5.35% to reach 324.1mn shares versus 342.4mn shares in the prior week. The number of transactions increased 23.5% to 31,169 transactions versus 25,234 transactions in the prior week. The Banks and Financial Services sector led the trading volume, accounting for 32.6%, followed by the Industrials sector, which accounted for 26.4% of the overall trading volume. Ezdan Holding Group (ERES) was the top volume traded stock during the week with 42.5mn shares. Foreign institutions remained bearish with net selling of QR233.6mn vs. net selling of QR47.0mn in the prior week. Qatari institutionsremainedbullishwithnetbuyingofQR113.8mnvs.net buying of QR106.2mn in the week before. Foreign retail investors remained positive with net buying of QR21.2mn vs. net buying of QR4.3mn in the prior week. Qatari retail investors turned bullish with net buying of QR98.6mn vs. net selling of QR63.5mn the week before. Foreign institutions have bought (net basis) ~$1.24bn worth of Qatari equities in 2019. Market Indicators Week ended August 08, 2019 Week ended August 01, 2019 Chg. % Value Traded (QR mn) 1,084.0 867.9 24.9 Exch. Market Cap. (QR mn) 542,240.5 573,150.8 (5.4) Volume (mn) 324.1 342.4 (5.3) Number of Transactions 31,169 25,234 23.5 Companies Traded 46 45 2.2 Market Breadth 10:35 10:35 – Market Indices Close WTD% MTD% YTD% Total Return 18,096.84 (5.4) (6.4) (0.3) ALL Share Index 2,905.52 (5.3) (6.3) (5.6) Banks and Financial Services 3,832.52 (5.4) (6.5) 0.0 Industrials 2,936.18 (6.0) (6.6) (8.7) Transportation 2,441.74 (4.2) (6.3) 18.6 Real Estate 1,412.37 (5.8) (6.1) (35.4) Insurance 2,770.38 (7.7) (9.7) (7.9) Telecoms 879.04 (7.5) (8.1) (11.0) Consumer Goods & Services 8,059.19 (0.5) (1.1) 19.3 Al Rayan Islamic Index 3,831.54 (4.0) (4.9) (1.4) Market Indices Weekly Index Performance Regional Indices Close WTD% MTD% YTD% Weekly Exchange Traded Value ($ mn) Exchange Mkt. Cap. ($ mn) TTM P/E** P/B** Dividend Yield Qatar* 9,834.79 (5.4) (6.4) (4.5) 296.86 148,899.2 14.6 1.9 4.4 Dubai 2,837.96 (2.2) (2.8) 12.2 265.78 100,711.2 11.8 1.0 4.3 Abu Dhabi 5,097.17 (2.5) (4.2) 3.7 253.07 141,363.3 14.9 1.5 4.9 Saudi Arabia# 8,482.95 (2.1) (2.9) 8.4 3,869.49 534,727.6 20.6 1.9 3.6 Kuwait 6,104.30 (0.4) (0.2) 20.2 437.81 114,303.4 15.0 1.5 3.4 Oman 3,861.51 2.2 2.7 (10.7) 24.61 16,928.0 7.7 0.8 7.1 Bahrain 1,543.55 (0.4) (0.3) 15.4 27.50 24,182.4 11.3 1.0 5.0 Source: Bloomberg, country exchanges and Zawya (** Trailing Twelve Months; * Value traded ($ mn) do not include special trades, if any; #Data as of August 07, 2019) 10,356.07 9,924.87 9,777.47 9,898.10 9,834.79 0 50,000,000 100,000,000 9,700 10,050 10,400 4-Aug 5-Aug 6-Aug 7-Aug 8-Aug Volume QSE Index 2.2% (0.4%) (0.4%) (2.1%) (2.2%) (2.5%) (5.4%) (6.0%) (3.0%) (0.0%) 3.0% Oman Kuwait Bahrain SaudiArabia Dubai AbuDhabi Qatar*
- 2. Page 2 of 8 News Economic & Market News Qatar Central Bank cuts lending rate by 25 basis points – Taking into account the evolving domestic and international macroeconomic developments, Qatar Central Bank (QCB) decided to reduce the QCB lending rate (QCBLR) by 25 basis points (bps) to 4.75%. The QCB decision comes in line with the US Federal Reserve’s move on Wednesday to cut the benchmark overnight lending rate for the first time since 2008 by a quarter points to a range of 2.00% to 2.25%. (Peninsula Qatar) IQCD posts 36.7% YoY decrease but 16.5% QoQ increase in net profit in 2Q2019, beating our estimate – Industries Qatar's (IQCD) net profit declined 36.7% YoY (but rose 16.5% on QoQ basis) to QR785.6mn in 2Q2019, beating our estimate of QR681.5mn (variation of +15.3%). The company's Revenue came in at QR1051.3mn in 2Q2019, which represents a decrease of 36.1% YoY (-16.7% QoQ). EPS amounted to QR0.24 in 6M2019 as compared to QR0.41 in 6M2018. IQCD recorded a net profit of QR1.5bn and EPS of QR0.24 for the period ended June 30, 2019. This compares with net profit of QR2.5bn and earnings per share of QR0.41 for the same period of 2018. The cash position across the group remained strong with total cash across the group of QR10.7bn after paying the 2018 annual dividend of QR3.6bn, and total debt of only QR10.9mn, reflecting the group’s strong liquidity position. During the current reporting period, the group operated under tightened trading conditions, as demand for products remained somewhat low and the product prices have softened. Product prices on average have declined by 10%, which has contributed for a QR0.6bn reduction in the group’s net earnings. Overall sales volumes, on the other hand, were also slightly down on the backdrop of lower production due to periodic maintenance. However, the group was able to improve its performance during the second quarter compared to the first quarter of 2019. This improvement was primarily driven by a gradual recovery in product prices, most notably in the prices of polyethylene and steel products. Reported revenue for the period ended June 30, 2019 was QR2.3bn, a decrease of 24%, over the same period of 2018. This YoY reduction was due to a moderate fall in the sales volumes and prices of the group’s steel products following muted demand in the domestic market and increasing international competition. On the other hand, on a like-for-like basis, management reporting revenue – assuming proportionate consolidation — was QR6.7bn, a decrease of QR1.5bn or 18%, versus the same period of 2018. This YoY reduction was primarily driven by a moderate reduction in the product prices and sales volumes across all segments. Product prices were down by 10% on the backdrop of lower crude oil prices, while sales volumes decreased by 9% on account of weaker demand, periodic planned maintenance and unplanned outages. Prices of petrochemical products were moderately down compared to the same period of 2018. A marginal reduction in crude oil prices, and muted demand in some major markets due to unfavorable economic conditions resulted in weaker petrochemical product prices. Petrochemicals sales volumes were also down last year due to periodic planned shutdowns and unplanned outages. Fertilizer prices, on the other hand, have improved marginally compared to the same period of 2018. The increase was driven by improved demand from some of the large agricultural economies, together with increased raw material costs and regulatory pressure on non- environment compliant producers. Sales volumes, however, were marginally down last year. Prices in the steel segment were also down YoY due to a number of reasons, including lower demand and higher competition. In the domestic market, prices were affected by the relatively lower demand in the current period, while the regional demand was also affected by the availability of low price steel from non-GCC producers, especially Turkey. Prices in other markets, like the Far East, were affected by the supply of low cost steel from countries like China. The fierce international competitions together with muted local consumption of steel have affected the volumes sold during the current year, and the steel sales volumes were slightly down last year. Total debt across the group is only QR10.9mn. This debt is expected to be settled during the second half of 2019. Moody’s Investor Services (MIS) has updated its credit opinion on the group and maintained ‘A1’ rating with a ‘Stable’ Outlook. (QNB FS Research, QSE, Peninsula Qatar) GISS' net profit declines 83.7% YoY and 84.1% QoQ in 2Q2019, misses our estimate – Gulf International Services’ (GISS) net profit declined 83.7% YoY (-84.1% QoQ) to QR4.0mn in 2Q2019. The company's revenue came in at QR751.9mn in 2Q2019, which represents an increase of 15.9% YoY (+4.6% QoQ). In 1H2019, GISS’ revenue for the period ended 30 June 2019 was QR1.5bn compared to revenue of QR1.3bn in the previous year, up by 17%. The insurance segment was the largest source of revenue to GISS during this period. The group’s net profit amounted to QR29.3mn, with earnings per share of QR0.016, compared to net profit of QR34.2mn and earnings per share of QR0.018 in the previous year. The earnings per share of the prior period have been reported taking into effect the stock split transaction mandated by Qatar Financial Markets Authority. In the six-month period GISS’ earnings before interest, taxes, depreciation, and amortization (EBITDA) stood at QR366mn.The overall reduction in the group's net profit was primarily affected by the insurance segment. Revenue in the insurance segment has improved significantly versus last year as a result of securing a number of new major clients in both the medical and energy lines of business and regaining some of the previously lost businesses. On the other hand, due to the nature of the insurance business, the segment's operating cost has increased with the improved revenue, which has resulted in the segment reporting lower operating margins compared to last year. The impact of this decline was partially reduced by better performance of the segment's investment portfolio. The drilling segment has reported a marginal growth in revenue, mainly due to the deployment of the new offshore drilling rig “West Tucana” contracted to Qatar Gas via a strategic partnership with Seadrill. In addition, the company will continue bidding for future contracts whenever an opportunity arises. The segment's net loss witnessed a year-on-year reduction of 15% despite an increase in financing cost, primarily due to increased revenue together with reduction in G&A expenses. The aviation
- 3. Page 3 of 8 segment has reported a moderate growth in revenue compared to last year, mainly as a result of the growth of activities in the segment’s international operations supported by short-term contracts in Pakistan, Turkey and South Africa, while maintaining its commercial aviation position locally. The growth in the international operations along with savings in G&A expenses contributed to the growth in net profit. The catering segment, on the other hand, has reported a reduction in revenue due to the demobilization of major contracts and reduction in camps occupancy. However, the segment continues to actively seek opportunities from both industrial and non-oil and gas sectors. Net profit in the segment witnessed a year-on-year reduction of 24%, mainly due to reduced revenue from the catering and accommodation services. The group’s closing cash (including short-term investments) stood at QR892mn as at 30 June 2019 with total debt of 4.8bn. The drilling segment represents 92% of the group's debt. The group is continuing the execution of some of the previously identified initiatives, which are in various stages of completion and are progressing well. These initiatives include the recently announced award of contracts by Qatar Petroleum to provide six-premium jack up rigs for the North Field Expansion project in the drilling segment, the acquisition of a 49% stake in Air Ocean Maroc in the aviation segment, and wining three major insurance contracts in the medical insurance segment. In addition, the insurance segment has decided to share the medical insurance risk via reinsurance. Additionally, the group was able to reduce its G&A expenses during the period by QR15mn, or 14%, compared to the same period of 2018. GISS will continue the assessment of the group's operation to capture additional potential revenue enhancement and cost improvement opportunities. (QNB FS Research, Company financials) IGRD posts 36.8% YoY increase but 22.5% QoQ decline in net profit in 2Q2019, beating our estimate – Investment Holding Group's (IGRD) net profit rose 36.8% YoY (but declined 22.5% on QoQ basis) to QR12.2mn in 2Q2019, beating our estimate of QR8.0mn. The company's revenue came in at QR115.4mn in 2Q2019, which represents an increase of 5.8% YoY (+19.9% QoQ). In 1H2019, IGRD reported a net profit of QR27.8mn as compared to QR23.3mn in 1H2018. EPS amounted to QR0.034 in 1H2019 as compared to QR0.028 in 1H2018. (QSE) BRES' net profit declines ~76% YoY and ~77% QoQ in 2Q2019 – Barwa Real Estate Company's (BRES) net profit declined ~76% YoY (~-77% QoQ) to ~QR96mn in 2Q2019. In 1H2019, BRES net profit attributable to shareholders of the parent company stood at QR510mn and earnings per share amounted to QR0.13, a decrease from the net profit for the corresponding period of 2018. The decrease in net profit was mainly due to the drop in profits of some non-recurring items in nature such as profit from debt scheduling and the application of IFRS 16. Total assets of the Group amounted to QR31bn and total equity attributable to the equity holders of the parent company amounted to QR18.9bn, in addition to maintaining a cash balance of QR1bn. In spite of the challenges currently facing the real estate market, Barwa Real Estate is working to strengthen its operating revenues during the second half of 2019 by completing the development of its ongoing projects which will contribute to the development of the operational real estate portfolio of the Group. These projects include affordable housing project for laborers at a construction cost of QR1.34bn. The project includes 25,360 residential rooms in addition to shops, hypermarkets and mosques. In July 2019, Barwa Real Estate started leasing activities through its subsidiary Waseef Asset & Facility Management in preparation for the completion of its full implementation during the fourth quarter of 2019. The labor housing project is one of the fruits of cooperation between Barwa Real Estate Company and the Government of the State of Qatar with the aim of strengthening the efforts exerted by the Government to improve the conditions of workers ‘accommodation and meet the needs of the local market for workers’ housing in line with the objectives of Qatar National Vision 2030 and Qatar’s preparations to host the 2022 World Cup. Another key project is setting up warehouses and workshops project in Barwa Al Baraha, which includes 561 warehouses with an area of 300 square meters for each warehouse and 118 workshops with an area of 144 square meters for each workshop. The total construction area of the project is about 187 thousand square meters in addition to the development of infrastructure and all the necessary services for the project. The importance of this project stems from providing suitable spaces and warehouses for small and medium sized companies. It will also provide mechanical and electrical workshops to meet the needs of the market. The leasing of this project will start at the beginning of the fourth quarter of 2019. Dara (A) project, which is located within Lusail area and includes 271 apartments ranging from one to three rooms and this project is in the final stages of delivery. Phase Two of proposed Al-Khor Sports Facilities project includes 516 apartments with a total construction area of 53,639 square meters in addition to a hypermarket and multi-purpose hall. The Barwa announced the award of the contract for the construction of phase two of the project during 2018 at a value of QR105mn. In addition, the development activities started in the third phase of the Madinat Al Mawater project at a construction cost of QR335mn, which Barwa Real Estate started to develop in 2019. The total area of construction in this phase is 167,072 square meters, including used car showrooms, Shops, workshops, an integrated car service center, a commercial vehicle spare parts complex, a dealership showroom, a hypermarket and a mosque. Barwa is currently working on the completion of designs and investment plans for many projects, which are expected to be tendered in 2019, including Barwa Al Baraha Project Phase Three, which includes residential apartments, shops and offices, in addition to a hypermarket, a clinic and a mosque. (QSE, Peninsula Qatar) MPHC's net profit declines ~92% YoY and QoQ in 2Q2019 – Mesaieed Petrochemical Holding Company's (MPHC) net profit declined ~92% YoY and QoQ to ~QR24mn in 2Q2019. MPHC reported a net profit of QR305mn for the half year ended June 2019 (1H2019). The first half net profit for 2019 is down by 54% of QR361mn compared to the corresponding period of the previous year. MPHC’s earnings per share stood at QR0.024 for the first half of 2019 vs. QR0.053 in first half of 2018, taking into effect the stock split transaction mandated by Qatar Financial Markets Authority. The decrease in MPHC’s profit for 1H2019 was due to reduction in selling prices in line with the drop in crude oil prices at the end of 2018. The group continued to
- 4. Page 4 of 8 benefit from the supply of competitively priced ethane feedstock and fuel gas under long-term supply agreements. These contracting arrangements are an important value driver for the group’s profitability in a competitive market environment. The petrochemical segment’s revenue for the six months stood at QR1.2bn, a decrease of 13% from previous year. The profit was QR379mn compared to the profit in the corresponding period in the previous year of QR524mn. The revenue was impacted by the drop in selling prices compared to the previous year and the profit was impacted by higher operating costs. Production was down by 3% on the previous year and sales volumes were marginally up by 1% on the previous year. The chlor-alkali segment reported revenue of QR353mn, a decrease of 14% from previous year. The profit was QR73mn compared to the profit in the corresponding period in the previous year of QR65mn. Sales revenue was impacted by the decrease in sales volumes by 2% and decrease in selling prices by 12%. Production was lower by 5% from the previous year. The profit improved on previous year primarily due to the reduction in operating costs. The MPHC’s closing cash position after the first six months of operations in 2019 was a robust QR1.4bn. Total assets stood at QR14.6bn, compared to QR15.3bn as of at 31 December 2018. (QSE, Peninsula Qatar) MCCS' net profit declines 50.3% YoY and 23.5% QoQ in 2Q2019 – Mannai Corporation's (MCCS) net profit declined 50.3% YoY (- 23.5% QoQ) to QR37.9mn in 2Q2019. The company's revenue came in at QR2,846.6mn in 2Q2019, which represents an increase of 6.6% YoY. However, on QoQ basis, revenue fell 0.2%. EPS amounted to QR0.19 in 1H2019 as compared to QR0.37 in 1H2018. MCCS’ half yearly revenue increased by 10.2% to QR5,700.3mn compared to QR5,171.1mn in the same period last year. The gross profit of the MCCS stood at QR1.2bn. Earnings before interest, tax, depreciation and amortization (EBITDA) in the first half rose by 21% to QR536mn compared to QR444mn in the same period last year. While profit before interest and tax expenses increased to QR341mn. During the period, interest expenses increased by 58% to QR205.1mn compared to QR129.8mn last year as a result of the increased investments in the Information Technology segment. The Information Technology segment delivered increased revenues of 17%, 80% of the group’s first half revenues and EBITDA growth of 45% compared to first half of 2018, the company stated. (Company financials, Gulf-Times.com) MERS' bottom line rises ~2% YoY and ~14% QoQ in 2Q2019 – Al Meera Consumer Goods Company's (MERS) net profit rose ~2% YoY (~+14% QoQ) to ~QR51mn in 2Q2019. The company's sales came in at ~QR822mn in 2Q2019, which represents a decrease of ~1% YoY. However, on QoQ basis, sales rose ~8%. In 1H2019, MERS reported a net profit of QR95.0mn as compared to QR93.3mn in 1H2018. Consolidated sales for six months ended June 30, 2019 was QR1,581.0mn, an increase of 1.1% compared to the same period last year. EPS amounted to QR0.475 in 1H2019 as compared to QR0.466 in 1H2018. (Gulf-Times.com)
- 5. Page 5 of 8 Qatar Stock Exchange Top Gainers Top Decliners Source: Qatar Stock Exchange (QSE) Source: Qatar Stock Exchange (QSE) Most Active Shares by Value (QR Million) Most Active Shares by Volume (Million) Source: Qatar Stock Exchange (QSE) Source: Qatar Stock Exchange (QSE) Investor Trading Percentage to Total Value Traded Net Traded Value by Nationality (QR Million) Source: Qatar Stock Exchange (QSE) Source: Qatar Stock Exchange (QSE) 2.8% 2.7% 1.9% 1.4% 1.3% 0.0% 1.0% 2.0% 3.0% Qatar Cinema & Film Distribution Co. Doha Insurance Group The Group Islamic Insurance Co. United Development Company Salam International Inv. Ltd. -15.4% -9.2% -9.1% -9.1% -8.4% -18.0% -12.0% -6.0% 0.0% QatariGermanCo. forMedical Dev. GulfInternational Services DlalaBrokerage & Inv.HoldingCo. QatarInsurance Company The Commercial Bank 311.4 81.7 78.7 78.4 50.2 0.0 108.0 216.0 324.0 QNB Group Masraf Al Rayan Industries Qatar Qatar Islamic Bank Mesaieed Petrochemical Holding Co. 42.5 33.3 22.7 19.9 16.8 0.0 15.0 30.0 45.0 Ezdan Holding Group Qatar First Bank Masraf Al Rayan Mesaieed Petrochemical Holding Co. QNB Group 0% 20% 40% 60% 80% 100% Buy Sell 33.45% 24.35% 20.95% 10.45% 10.97% 9.02% 34.63% 56.17% Qatari Individuals Qatari Institutions Non-Qatari Individuals Non-Qatari Institutions 590 494 377 707 212 (212) (400) (200) - 200 400 600 800 Qatari Non-Qatari Net Investment Total Sold Total Bought
- 6. Page 6 of 8 TECHNICAL ANALYSIS OF THE QSE INDEX Source: Bloomberg The QE Index closed down by 5.411% from the week before, and closed at 9,834.79. The Index moved into the corrective channel but we keep our next expected weekly-resistance level at 10,800 points and the 9,700 level as our weekly support. DEFINITIONS OF KEY TERMS USED IN TECHNICAL ANALYSIS RSI (Relative Strength Index) indicator – RSI is a momentum oscillator that measures the speedand change of price movements. The RSI oscillates between 0 to 100. The index is deemed to be overbought once the RSI approaches the 70 level, indicating that a correction is likely. On the other hand, if the RSI approaches 30, it is an indication that the index may be getting oversold and therefore likely to bounce back. MACD (Moving Average Convergence Divergence) indicator – The indicator consists of the MACD line and a signal line. The divergence or the convergence of the MACD line with the signal line indicates the strength in the momentum during the uptrend or downtrend, as the case may be. When the MACD crosses the signal line from below and trades above it, it gives a positive indication. The reverse is the situation for a bearish trend. Candlestick chart – A candlestick chart is a price chart that displays the high, low, open, and close for a security. The ‘body’ of the chart is portion between the open and close price, while the high and low intraday movements form the ‘shadow’. The candlestick may represent any time frame. We use a one-day candlestick chart (every candlestick represents one trading day) in our analysis. Doji candlestick pattern – A Doji candlestick is formed when a security's open and close are practically equal. The pattern indicates indecisiveness, and based on preceding price actions and future confirmation, may indicate a bullish or bearish trend reversal. ShootingStar/Inverted Hammer candlestick patterns – These candlestick patterns have a small real body (open price and close price are near to each other), and a long upper shadow (large intraday movement on the upside). The Shooting Star is a bearish reversal pattern that forms after a rally. The Inverted Hammer looks exactly like a Shooting Star, but forms after a downtrend. Inverted Hammers represent a potential bullish trend reversal.
- 7. Page 7 of 8 Source: Bloomberg Company Name Price August 08 % Change WTD % Change YTD Market Cap. QR Million TTM P/E P/B Div. Yield Qatar National Bank 18.23 (5.64) (6.51) 168,380 13.1 2.5 3.3 Qatar Islamic Bank 15.10 (6.33) (0.66) 35,680 13.5 2.3 3.3 Commercial Bank of Qatar 4.35 (8.42) 10.43 17,606 11.8 1.1 3.4 Doha Bank 2.57 (3.38) 15.77 7,968 12.0 0.9 3.9 Al Ahli Bank 3.20 0.63 25.71 7,405 11.0 1.3 2.8 Qatar International Islamic Bank 7.63 1.06 15.40 11,549 13.6 2.0 5.2 Masraf Al Rayan 3.60 (5.26) (13.63) 27,000 12.6 2.1 5.6 Al Khaliji Bank 1.16 0.87 0.52 4,176 7.3 0.7 6.5 Qatar First Bank 0.35 (6.38) (13.73) 704 N/A 1.0 N/A National Leasing 0.66 (7.99) (25.37) 325 44.7 0.5 7.6 Dlala Holding 0.73 (9.09) (27.00) 207 N/A 1.0 N/A Qatar & Oman Investment 0.51 (5.20) (4.49) 161 56.2 0.6 5.9 Islamic Holding Group 2.18 (5.22) (0.23) 123 340.2 0.9 N/A Banking and Financial Services 281,284 Zad Holding 13.98 (0.07) 34.42 2,012 16.0 2.1 6.1 Qatar German Co. for Medical Devices 0.63 (15.36) 10.95 73 N/A 2.0 N/A Salam International Investment 0.41 1.25 (6.47) 463 N/A 0.4 N/A Medicare Group 7.08 (4.84) 12.20 1,993 25.4 2.0 25.4 Qatar Cinema & Film Distribution 2.21 2.79 16.19 139 17.7 1.0 6.8 Qatar Fuel 21.10 0.43 27.12 20,979 17.4 2.7 3.8 Qatar Meat and Livestock 6.15 0.00 (12.14) 1,107 10.0 3.4 7.3 Mannai Corp. 3.55 (6.82) (35.40) 1,619 5.2 0.6 5.6 Al Meera Consumer Goods 14.75 0.68 (0.34) 2,950 16.0 2.3 5.8 Consumer Goods and Services 31,334 Qatar Industrial Manufacturing 3.30 (7.30) (22.72) 1,568 10.9 1.0 7.6 Qatar National Cement 5.86 (1.51) (1.51) 3,830 14.5 1.3 8.5 Industries Qatar 10.40 (6.56) (22.16) 62,920 15.8 1.9 5.8 Qatari Investors Group 2.07 (4.61) (25.57) 2,574 18.6 0.9 3.6 Qatar Electricity and Water 14.53 (6.62) (21.46) 15,983 11.9 1.7 5.3 Aamal 0.73 (6.99) (17.19) 4,612 11.6 0.1 8.2 Gulf International Services 1.58 (9.20) (7.06) 2,936 N/A 0.8 N/A Mesaieed Petrochemical Holding 2.50 (4.21) 66.33 31,408 30.6 2.2 3.2 Invesment Holding Group 0.56 (2.11) 14.11 463 8.1 0.6 4.5 Qatar Aluminum Manufacturing 0.81 (8.41) (39.63) 4,498 N/A N/A 2.5 Industrials 130,791 Qatar Insurance 3.10 (9.09) (13.65) 10,125 17.4 1.2 4.8 Doha Insurance 1.13 2.73 (13.67) 565 9.3 0.5 7.1 Qatar General Insurance & Reinsurance 3.35 (8.22) (25.36) 2,931 14.0 4.7 3.0 Al Khaleej Takaful Insurance 1.69 (5.06) 96.74 431 15.8 8.2 3.0 Qatar Islamic Insurance 5.86 1.91 9.10 879 14.9 2.6 6.0 Insurance 14,932 United Development 1.41 1.44 (4.41) 4,993 12.1 4.7 7.1 Barw a Real Estate 3.30 (6.78) (17.31) 12,841 8.4 0.7 7.6 Ezdan Real Estate 0.63 (7.13) (51.85) 16,578 55.9 0.5 N/A Mazaya Qatar Real Estate Development 0.74 (5.22) (4.62) 861 N/A 0.6 6.7 Real Estate 35,273 Ooredoo 6.53 (8.42) (12.93) 20,917 15.6 9.4 3.8 Vodafone Qatar 1.31 (5.76) (16.13) 5,537 46.8 6.2 3.8 Telecoms 26,454 Qatar Navigation (Milaha) 6.21 (6.33) (5.92) 7,112 14.1 5.0 4.8 Gulf Warehousing 4.90 (2.39) 27.37 287 15.3 1.7 3.9 Qatar Gas Transport (Nakilat) 2.20 (3.51) 22.70 12,189 17.2 19.3 4.5 Transportation 19,588 Qatar Exchange 542,240
- 8. Contacts Saugata Sarkar, CFA, CAIA Shahan Keushgerian Zaid al-Nafoosi , CMT, CFTe Head of Research Senior Research Analyst Senior Research Analyst Tel: (+974) 4476 6534 Tel: (+974) 4476 6509 Tel: (+974) 4476 6535 saugata.sarkar@qnbfs.com.qa shahan.keushgerian@qnbfs.com.qa zaid.alnafoosi@qnbfs.com.qa Mehmet Aksoy, PhD QNB Financial Services Co. W.L.L. Senior Research Analyst Contact Center: (+974) 4476 6666 Tel: (+974) 4476 6589 PO Box 24025 mehmet.aksoy@qnbfs.com.qa Doha, Qatar Disclaimer and Copyright Notice: This publication has been prepared by QNB Financial Services Co. W.L.L. (“QNB FS”) a wholly-owned subsidiary of Qatar National Bank (Q.P.S.C.). QNB FS is regulated by the Qatar Financial Markets Authority and the Qatar Exchange. Qatar National Bank (Q.P.S.C.) is regulated by the Qatar Central Bank. This publication expresses the views and opinions of QNB FS at a given time only. It is not an offer, promotion or recommendation to buy or sell securities or other investments, nor is it intended to constitute legal, tax, accounting, or financial advice. QNB FS accepts no liability whatsoever for any direct or indirect losses arising from use of this report. Any investment decision should depend on the individual circumstances of the investor and be based on specifically engaged investment advice. We therefore strongly advise potential investors to seek independent professional advice before making any investment decision. Although the information in this report has been obtained from sources that QNB FS believes to be reliable, we have not independently verified such information and it may not be accurate or complete. QNB FS does not make any representations or warranties as to the accuracy and completeness of the information it may contain, and declines any liability in that respect. For reports dealing with Technical Analysis, expressed opinions and/or recommendations may be different or contrary to the opinions/recommendations of QNB FS Fundamental Research as a result of depending solely on the historical technical data (price and volume). QNB FS reserves the right to amend the views and opinions expressed in this publication at any time. It may also express viewpoints or make investment decisions that differ significantly from, or even contradict, the views and opinions included in this report. This report may not be reproduced in whole or in part without permission from QNB FS COPYRIGHT: No part of this document may be reproduced without the explicit written permission of QNB FS. Page 8 of 8