QNBFS Weekly Market Report August 09, 2018
•
0 j'aime•19 vues

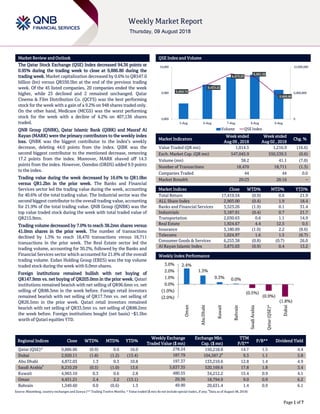
The Qatar Stock Exchange (QSE) Index decreased 94.36 points or 0.95% during the trading week to close at 9,886.86 during the trading week.

Recommandé
Recommandé
Contenu connexe
Tendances
Tendances (20)
Similaire à QNBFS Weekly Market Report August 09, 2018
Similaire à QNBFS Weekly Market Report August 09, 2018 (20)
Plus de QNB Group
Plus de QNB Group (20)
Dernier
Dernier (20)
QNBFS Weekly Market Report August 09, 2018
- 1. ` Page 1 of 7 Market Review and Outlook QSE Index and Volume The Qatar Stock Exchange (QSE) Index decreased 94.36 points or 0.95% during the trading week to close at 9,886.86 during the trading week. Market capitalization decreased by 0.6% to QR547.0 billion (bn) versus QR550.5bn at the end of the previous trading week. Of the 45 listed companies, 20 companies ended the week higher, while 23 declined and 2 remained unchanged. Qatar Cinema & Film Distribution Co. (QCFS) was the best performing stock for the week with a gain of a 9.2% on 948 shares traded only. On the other hand, Medicare (MCGS) was the worst performing stock for the week with a decline of 4.2% on 407,136 shares traded. QNB Group (QNBK), Qatar Islamic Bank (QIBK) and Masraf Al Rayan (MARK) were the primary contributors to the weekly index loss. QNBK was the biggest contributor to the index’s weekly decrease, deleting 44.0 points from the index. QIBK was the second biggest contributor to the mentioned decrease, removing 17.2 points from the index. Moreover, MARK shaved off 14.3 points from the index. However, Ooredoo (ORDS) added 9.9 points to the index. Trading value during the week decreased by 16.6% to QR1.0bn versus QR1.2bn in the prior week. The Banks and Financial Services sector led the trading value during the week, accounting for 40.6% of the total trading value. The Industrial sector was the second biggest contributor to the overall trading value, accounting for 21.9% of the total trading value. QNB Group (QNBK) was the top value traded stock during the week with total traded value of QR215.9mn. Trading volume decreased by 7.0% to reach 38.2mn shares versus 41.0mn shares in the prior week. The number of transactions declined by 1.3% to reach 18,470 transactions versus 18,711 transactions in the prior week. The Real Estate sector led the trading volume, accounting for 30.2%, followed by the Banks and Financial Services sector which accounted for 21.8% of the overall trading volume. Ezdan Holding Group (ERES) was the top volume traded stock during the week with 6.0mn shares. Foreign institutions remained bullish with net buying of QR147.9mn vs. net buying of QR203.0mn in the prior week. Qatari institutions remained bearish with net selling of QR96.6mn vs. net selling of QR88.3mn in the week before. Foreign retail investors remained bearish with net selling of QR17.7mn vs. net selling of QR26.5mn in the prior week. Qatari retail investors remained bearish with net selling of QR33.5mn vs. net selling of QR88.2mn the week before. Foreign institutions bought (net basis) ~$1.5bn worth of Qatari equities YTD. Market Indicators Week ended Aug 09 , 2018 Week ended Aug 02 , 2018 Chg. % Value Traded (QR mn) 1,014.5 1,216.9 (16.6) Exch. Market Cap. (QR mn) 547,045.9 550,539.5 (0.6) Volume (mn) 38.2 41.1 (7.0) Number of Transactions 18,470 18,711 (1.3) Companies Traded 44 44 0.0 Market Breadth 20:23 26:16 – Market Indices Close WTD% MTD% YTD% Total Return 17,419.54 (0.9) 0.6 21.9 ALL Share Index 2,903.00 (0.4) 1.9 18.4 Banks and Financial Services 3,523.26 (1.9) 0.1 31.4 Industrials 3,187.91 (0.4) 0.7 21.7 Transportation 2,030.63 0.6 1.1 14.9 Real Estate 1,924.67 4.4 12.5 0.5 Insurance 3,180.89 (1.0) 2.2 (8.6) Telecoms 1,024.97 1.6 1.5 (6.7) Consumer Goods & Services 6,253.38 (0.8) (0.7) 26.0 Al Rayan Islamic Index 3,875.03 (0.9) 0.4 13.2 Market Indices Weekly Index Performance Regional Indices Close WTD% MTD% YTD% Weekly Exchange Traded Value ($ mn) Exchange Mkt. Cap. ($ mn) TTM P/E** P/B** Dividend Yield Qatar (QSE)* 9,886.86 (0.9) 0.6 16.0 278.24 150,218.8 14.7 1.5 4.4 Dubai 2,920.11 (1.8) (1.2) (13.4) 187.79 104,587.2# 9.3 1.1 5.8 Abu Dhabi 4,872.03 1.3 0.3 10.8 197.37 133,210.6 12.8 1.4 4.9 Saudi Arabia# 8,210.29 (0.5) (1.0) 13.6 5,637.35 520,169.6 17.8 1.8 3.4 Kuwait 4,963.10 0.3 0.6 2.8 480.55 34,212.2 15.4 0.9 4.1 Oman 4,431.21 2.4 2.2 (13.1) 20.36 18,794.9 9.0 0.9 6.2 Bahrain 1,349.60 0.0 (0.6) 1.3 49.90 20,631.4 1.4 0.9 6.1 Source: Bloomberg, country exchanges and Zawya (** Trailing Twelve Months; * Value traded ($ mn) do not include special trades, if any; # Data as of August 08, 2018) 9,896.74 9,933.22 9,973.97 9,961.55 9,886.86 0 6,000,000 12,000,000 9,800 9,900 10,000 5-Aug 6-Aug 7-Aug 8-Aug 9-Aug Volume QSE Index 2.4% 1.3% 0.3% 0.0% (0.5%) (0.9%) (1.8%) (2.0%) (1.0%) 0.0% 1.0% 2.0% 3.0% Oman AbuDhabi Kuwait Bahrain SaudiArabia Qatar(QSE)* Dubai
- 2. Page 2 of 7 News Economic & Market News PwC report: Qatar’s sovereign bond of $12bn largest in 2Q2018 – Qatar has issued the highest value of sovereign bond at $12.0bn in 2Q2018, according to a report by PwC Middle East (PwC). The report stated Qatar issued a bond, which consisted of three tranches: a $3.0bn 5-year tranche, a $3.0bn 10-year tranche, and a $6.0bn 30-year tranche. In addition, the government of Saudi Arabia issued a triple-tranche bond total valued at $10.9bn. Led by Qatar and Saudi Arabia, the GCC sovereign bond market witnessed proceeds of $22.9bn in 2Q2018 from its two largest sovereign bond issuers, PwC stated. The $12.0bn sovereign bond issued by Qatar represents the largest placement by an emerging market sovereign so far this year. On the corporate front, debt activity has been relatively slow. However, with the recent recovery in oil prices and improvement in government fiscal deficits, sovereign debt issuances are expected to taper in the latter half of 2018, according to PwC. (Gulf-Times.com) IQCD reports in-line 2Q2018 with 82.1% YoY increase but 2.1% QoQ decline in net profit – Industries Qatar’s (IQCD) net profit rose 82.1% YoY (but declined 2.1% QoQ) to QR1,241.71mn in 2Q2018, in line with our estimate of QR1,204.48mn (variation of +3.1%). The company’s consolidated revenue, which represents the steel segment, came in at QR1,645.37mn in 2Q2018, which represents an increase of 79.4% YoY (+19.4% QoQ). Steel was again stronger-than-expected with revenue beating our estimate of QR1,308.94mn by 25.7%. EPS increased to QR4.15 in 1H2018 from QR2.66 in 1H2017. According to the company, 1H results are well ahead of the group budget expectations for 2018. Further, improved product prices, stable sales volumes, efficiently managed operating assets base, and continued focus on cost improvements were the driving forces behind its performance. In 1H2018, steel revenue jumped significantly by 49.3% to QR3.02bn, following a combination of moderate improvement in sales volumes and selling prices. On the other hand, on a like-for-like basis, management reporting revenue, assuming proportionate consolidation, was QR8.1bn, up 24% over 1H2017 due to the combined effect of improved prices and volumes versus the previous year. The group’s sales volumes improved moderately on last year, despite a number of planned and unplanned shutdowns in some facilities. Polyethylene sales improved through higher production, as the segment was on an extended unplanned shutdown during 1H2017, specifically during 1Q2017. Recovery in global demand has aided the group’s fertilizer segment, while the sales of steel products have improved due to the change of geographical mix. Product prices across most segments moderately increased versus the comparable period of 2017. Polyethylene prices have started to stabilize, while fuel additive prices have improved notably compared to last year. Increase in raw materials costs and resurgence of demand in some geographies were the key factors those contributed to the increase in the steel prices, IQCD stated. The group’s financial position remains solid, as cash across the group stands at QR10.2bn after paying 2017’s dividend of QR3.0bn, with periodic debt payments amounting to QR0.3bn. Total debt across the group now stands at QR0.2bn, down from QR0.5bn as of December 31, 2017. In July, rating agency Moody’s Investors Service affirmed its ‘A1’ rating for IQCD and changed the outlook to ‘Stable’ from ‘Negative’. We are of the view that these are a strong set of results and bottom-line performance would have been even stronger if the company did not report a loss of QR77.13mn from its steel associates (vs. a QR43.56mn profit in 2Q2017 and a QR21.0mn profit in 1Q2018) along with a substantial increase in selling costs. We expect to revise our 2018 net income estimate upward given strong 1H2018 results. (QNBFS Research, Company releases, Gulf-Times.com) GISS’ bottom line rises to QR24.78mn in 2Q2018, exceeding our estimate; Retain Market Perform rating – Gulf International Services (GISS) reported net profit of QR24.78mn in 2Q2018 as compared to QR0.74mn in 2Q2017 and QR9.46mn in 1Q2018 (+161.9% QoQ), beating our estimate of QR11.73mn. The company’s revenue came in at QR682.69mn in 2Q2018, which represents an increase of 5.4% YoY (+8.8% QoQ). Reported revenue was in-line with our estimate of QR651.58mn (+4.8% divergence). EPS doubled to QR0.18 in 1H2018 from QR0.09 in 1H2017. In 1H2018, GISS posted 4.4% YoY increase in revenue amounting to QR1.31bn. GISS stated revenue in the insurance segment improved significantly versus last year, while the drilling segment reported a moderate growth in revenue. Revenue in the aviation segment reported a slight decrease, while the catering segment’s revenue was moderately down on last year. The improvement in the insurance segment was primarily due to growth in general insurance business, while the drilling segment benefited from improved asset utilization. The aviation segment was affected by reduction in Qatar aviation operations, and the catering segment was impacted by demobilization of some projects and reduced camps occupancy. In 1H2018, the group’s QR34.24mn net profit went significantly up by 116.4% on the same period of last year. The improvement was primarily driven by a slight growth in revenue and cost reduction in the drilling segment following the cost optimization initiatives undertaken by the company. The improvement achieved in the drilling segment was marginally offset by lower profit in the aviation segment due to reduced revenue from Qatar aviation operations. The effect of revenue decrease in Qatar aviation operations was somewhat offset by other operating revenues and reduced general and administrative expenses. The group is in the execution phase of some of the opportunities identified by the growth strategy initiatives that were concluded last year, according to GISS. The initiatives include revenue growth and optimization, cost rationalization and efficiency improvements. GISS stated the implementation is in different stages of progress with one of the group companies having moved into advanced stages and appointed a consultant specialized in transformation and implementation to assist in the implementation of the chosen strategies. (QNBFS Research, QSE, Gulf-Times.com) MERS posts 19.2% YoY decrease, but 15.3% QoQ rise in net profit in 2Q2018 – Al Meera Consumer Goods Company’s (MERS) net profit declined 19.2% YoY to QR49.95mn in 2Q2018. However, on QoQ basis net profit rose 15.3%. The
- 3. Page 3 of 7 company’s sales came in at ~QR828mn in 2Q2018, which represents an increase of ~6% YoY (~13% QoQ). EPS amounted to QR4.66 in 1H2018 as compared to QR5.12 in 1H2017. In 1H2018, MERS’ sales came in at QR1,563.4mn an increase of 9.7% YoY, driven by sales from branches opened prior to 2017, and sales from seven new branches opened in 2017 plus four new branches opened in 1H2018. The group is scheduled to open another two new branches in the State of Qatar in the coming few months. The group realized an increase of 6.3% in consolidated gross profit in 1H2018 to QR250.7mn, driven by the strong sales growth from existing and new branches. The group’s shop rental income from leased shops increased by 3.9% to QR37.4mn. In 1H2018, MERS reported net profit of QR93.28mn as compared to QR102.36mn in 1H2017. The net profit was impacted by lower gross margins attributable to the special price concession offered on over 3,500 items during the Holy Month of Ramadan. (QSE, Gulf-Times.com) MPHC posts 20.9% YoY increase but 13.1% QoQ decline in net profit in 2Q2018 – Mesaieed Petrochemical Holding Company's (MPHC) net profit rose 20.9% YoY to QR309.82mn in 2Q2018. However, on QoQ basis net profit declined 13.1%, due to the planned annual maintenance shutdown in one of the group companies’ plants. The company's share of results from joint ventures came in at QR272.09mn in 2Q2018, which represents an increase of 18.5% YoY. However, on QoQ basis share of results from joint ventures declined 14.3%. EPS amounted to QR0.53 in 1H2018 as compared to QR0.37 in 1H2017. In 1H2018, MPHC reported net profit of QR666.46mn as compared to QR468.59mn for the same period of the previous year. The increase in profit was driven by improved selling prices by 13% and increased sales volumes by 6%, as the previous year witnessed a planned turnaround in one of the group companies’ plants. The group’s profit for the period was also aided by the recognition of a tax refund of approximately QR64mn for the period. The group continued to benefit from the supply of competitively-priced ethane feedstock and fuel gas under long-term supply agreements. This contracting arrangement is an important value driver for the group’s profitability in a challenging market condition, MPHC stated. The closing cash position after the first six months of operations was a robust QR1.2bn as of June 30, 2018. Total assets stood at QR14.6bn at the end of June 30, 2018 as compared to QR14.8bn at the end of December 31, 2017. (Company Releases, QSE, Gulf-Times.com) QGMD reports net loss of QR2.17mn in 2Q2018 – Qatari German Company for Medical Devices (QGMD) reported net loss of QR2.17mn in 2Q2018 as compared to net loss of QR2.11mn in 2Q2017 and QR2.23mn in 1Q2018. The company’s revenue came in at QR2.59mn in 2Q2018, which represents an increase of 0.5% YoY (+31.5% QoQ). Loss per share amounted to QR0.38 in 1H2018 as compared to QR0.37 in 1H2017. In 1H2018, QGMD reported net loss of QR4.40mn as compared to net loss of QR4.32mn for the comparable period of the previous year. (QSE) MCGS' net profit declines 13.0% YoY and 37.4% QoQ in 2Q2018 – Medicare Group's (MCGS) net profit declined 13.0% YoY (- 37.4% QoQ) to QR12.80mn in 2Q2018. In 1H2018, MCGS reported net profit of QR33.25mn as compared to QR32.59mn for the same period of the previous year. EPS amounted to QR1.18 in 1H2018 as compared to QR1.16 in 1H2017. (QSE) IGRD's net profit declines 0.3% YoY and 38.4% QoQ in 2Q2018 – Investment Holding Group's (IGRD) net profit declined 0.3% YoY (-38.4% QoQ) to QR8.89mn in 2Q2018. In 1H2018, IGRD reported net profit of QR23.33mn as compared to QR21.0mn for the same period of the previous year. EPS amounted to QR0.28 in 1H2018 as compared to QR0.25 in 1H2017. (QSE) MCCS’ net profit comes in flat YoY but decreases by ~16% QoQ in 2Q2018 – Mannai Corporation’s (MCCS) YoY net profit came in flat (but decreased ~16% QoQ) at ~QR76mn in 2Q2018. EPS amounted to QR3.66 in 1H2018 as compared to QR3.65 in 1H2017. In 1H2018, MCCS reported QR167mn net profit on revenue worth QR5.1bn. MCCS’ EBITDA rose by 56% to QR444mn compared to QR284mn, and pre-tax profit rose by 25% to QR209mn compared to QR167mn in the previous year. In line with the group’s strategy of diversifying geographically, MCCS acquired additional 15.39% share in GFI Informatique, France during the first half of 2018 and currently holds 96.6%. MCCS stated that the group is well positioned to participate in the major infrastructure development projects and services sector in the state of Qatar and is optimistic of the future. (QSE, Gulf-Times.com) QCFS’ net profit declines 19.5% YoY and 18.2% QoQ in 2Q2018 – Qatar Cinema and Film Distribution Company’s (QCFS) net profit declined 19.5% YoY (-18.2% QoQ) to QR2.22mn in 2Q2018. In 1H2018, QCFS reported net profit of QR4.94mn as compared to QR5.71mn in 1H2017. EPS fell to QR0.79 in 1H2018 from QR0.91 in 1H2017. (QSE)
- 4. Page 4 of 7 Qatar Stock Exchange Top Gainers Top Decliners Source: Qatar Stock Exchange (QSE) Source: Qatar Stock Exchange (QSE) Most Active Shares by Value (QR Million) Most Active Shares by Volume (Million) Source: Qatar Stock Exchange (QSE) Source: Qatar Stock Exchange (QSE) Investor Trading Percentage to Total Value Traded Net Traded Value by Nationality (QR Million) Source: Qatar Stock Exchange (QSE) Source: Qatar Stock Exchange (QSE) 9.2% 7.8% 2.9% 2.4% 2.3% 0.0% 4.0% 8.0% 12.0% Qatar Cinema & Film Distribution Co. Ezdan Holding Group Alijarah Holding Mannai Corporation Dlala Brokerage & Inv. Holding Co. -4.2% -3.3% -3.0% -2.7% -2.5% -6.0% -4.0% -2.0% 0.0% Medicare Group IslamicHolding Group The Group Islamic Insurance Co. QatarIndustrial ManufacturingCo. QNBGroup 215.9 106.4 74.0 64.7 59.7 0.0 80.0 160.0 240.0 QNB Group Industries Qatar Qatar Gas Transport Co. Ltd. Ezdan Holding Group The Commercial Bank 6.0 4.3 3.9 2.9 2.3 0.0 3.0 6.0 9.0 Ezdan Holding Group Qatar Gas Transport Co. Ltd. Mazaya Qatar Real Estate Dev. Mesaieed Petrochemical Holding Co. Investment Holding Group 0% 20% 40% 60% 80% 100% Buy Sell 31.74% 35.05% 12.18% 21.70% 10.73% 12.48% 45.35% 30.78% Qatari Individuals Qatari Institutions Non-Qatari Individuals Non-Qatari Institutions 446 569 576 439 (130) 130 (200) (100) - 100 200 300 400 500 600 700 Qatari Non-Qatari Net Investment Total Sold Total Bought
- 5. Page 5 of 7 TECHNICAL ANALYSIS OF THE QSE INDEX Source: Bloomberg The QSE Index closed down after six consecutive up candles, correcting 0.9% from the week before. However, we believe that the Index should move towards Fibonacci retracement level of 38.2% and comfortably cross the crucial level of 10,000. DEFINITIONS OF KEY TERMS USED IN TECHNICAL ANALYSIS RSI (Relative Strength Index) indicator – RSI is a momentum oscillator that measures the speed and change of price movements. The RSI oscillates between 0 to 100. The index is deemed to be overbought once the RSI approaches the 70 level, indicating that a correction is likely. On the other hand, if the RSI approaches 30, it is an indication that the index may be getting oversold and therefore likely to bounce back. MACD (Moving Average Convergence Divergence) indicator – The indicator consists of the MACD line and a signal line. The divergence or the convergence of the MACD line with the signal line indicates the strength in the momentum during the uptrend or downtrend, as the case may be. When the MACD crosses the signal line from below and trades above it, it gives a positive indication. The reverse is the situation for a bearish trend. Candlestick chart – A candlestick chart is a price chart that displays the high, low, open, and close for a security. The ‘body’ of the chart is portion between the open and close price, while the high and low intraday movements form the ‘shadow’. The candlestick may represent any time frame. We use a one-day candlestick chart (every candlestick represents one trading day) in our analysis. Doji candlestick pattern – A Doji candlestick is formed when a security's open and close are practically equal. The pattern indicates indecisiveness, and based on preceding price actions and future confirmation, may indicate a bullish or bearish trend reversal. Shooting Star/Inverted Hammer candlestick patterns – These candlestick patterns have a small real body (open price and close price are near to each other), and a long upper shadow (large intraday movement on the upside). The Shooting Star is a bearish reversal pattern that forms after a rally. The Inverted Hammer looks exactly like a Shooting Star, but forms after a downtrend. Inverted Hammers represent a potential bullish trend reversal.
- 6. Page 6 of 7 Source: Bloomberg Company Name Price August 09 % Change WTD % Change YTD Market Cap. QR Million TTM P/E P/B Div. Yield Qatar National Bank 174.50 (2.51) 38.48 161,176 12.6 2.5 3.4 Qatar Islamic Bank 134.00 (1.54) 38.14 31,663 13.4 2.2 3.7 Commercial Bank of Qatar 41.20 (1.88) 42.56 16,675 16.0 1.1 2.4 Doha Bank 26.17 (0.76) (8.18) 8,114 12.1 0.9 11.5 Al Ahli Bank 31.00 0.98 (16.52) 6,521 9.9 1.3 3.1 Qatar International Islamic Bank 57.00 (2.15) 4.40 8,628 10.1 1.6 7.0 Masraf Al Rayan 38.49 (1.31) 1.96 28,868 13.9 2.4 5.2 Al Khalij Commercial Bank 11.00 (0.18) (22.54) 3,960 7.8 0.7 6.8 Qatar First Bank 5.18 0.97 (20.67) 1,036 N/A 0.9 N/A National Leasing 9.55 2.91 (10.83) 473 29.3 0.5 5.2 Dlala Holding 14.84 2.34 0.95 422 78.0 1.8 N/A Qatar & Oman Investment 6.16 0.49 (22.03) 194 45.8 0.7 8.1 Islamic Holding Group 28.10 (3.27) (25.07) 159 N/A 1.2 N/A Banking and Financial Services 267,888 Zad Holding 90.00 0.00 22.22 1,295 11.0 1.6 6.6 Qatar German Co. for Medical Devices 5.21 0.77 (19.35) 60 N/A 1.2 N/A Salam International Investment 5.22 0.38 (24.24) 597 N/A 0.4 N/A Medicare Group 67.99 (4.24) (2.66) 1,914 23.7 2.1 2.6 Qatar Cinema & Film Distribution 17.50 9.17 (30.00) 110 15.5 0.8 5.7 Qatar Fuel 144.50 (0.69) 41.58 14,367 13.1 2.1 5.5 Widam Food Co. 67.70 (1.88) 8.32 1,219 10.6 3.8 6.3 Mannai Corp. 51.50 2.39 (13.45) 2,349 4.6 0.9 7.8 Al Meera Consumer Goods 159.00 (1.85) 9.73 3,180 17.2 2.5 5.3 Consumer Goods and Services 25,090 Qatar Industrial Manufacturing 40.00 (2.65) (8.47) 1,901 9.5 12.4 7.5 Qatar National Cement 57.00 (1.72) (9.38) 3,725 11.4 1.2 7.9 Industries Qatar 123.99 (0.81) 27.82 75,014 17.8 2.2 4.0 Qatari Investors Group 32.29 0.09 (11.78) 4,015 16.9 1.5 2.3 Qatar Electricity and Water 194.89 (0.05) 9.49 21,438 13.2 2.2 4.0 Aamal 10.12 (0.20) 16.59 6,376 13.1 0.8 5.9 Gulf International Services 17.50 1.98 (1.13) 3,252 31.5 0.9 N/A Mesaieed Petrochemical Holding 16.15 1.64 28.28 20,290 15.8 1.4 4.3 Invesment Holding Group 5.42 (0.55) (11.15) 450 10.5 0.5 10.1 Industrials 136,459 Qatar Insurance 37.40 (1.27) (17.30) 11,927 59.2 1.6 3.5 Doha Insurance 13.39 (0.07) (4.36) 670 15.5 0.7 5.7 Qatar General Insurance & Reinsurance 50.00 0.00 2.04 4,375 13.6 0.7 4.4 Al Khaleej Takaful Insurance 10.50 (0.85) (20.69) 268 43.6 0.5 4.8 Qatar Islamic Insurance 53.60 (2.99) (2.49) 804 12.0 2.4 6.5 Insurance 18,044 United Development 14.27 2.22 (0.76) 5,053 9.8 0.5 8.8 Barw a Real Estate 36.69 (1.11) 14.66 14,277 9.0 0.8 6.8 Ezdan Real Estate 11.00 7.84 (8.94) 29,177 29.9 0.9 N/A Mazaya Qatar Real Estate Development 7.36 1.52 (18.22) 852 52.1 0.6 N/A Real Estate 49,359 Ooredoo 71.51 2.16 (21.20) 22,906 14.7 1.0 4.9 Vodafone Qatar 9.26 0.87 15.46 7,828 N/A 1.7 N/A Telecoms 30,734 Qatar Navigation (Milaha) 65.51 0.32 17.11 7,503 14.9 0.5 5.3 Gulf Warehousing 41.90 0.12 (4.75) 2,455 10.8 1.5 4.1 Qatar Gas Transport (Nakilat) 17.17 1.00 6.65 9,513 10.8 1.5 5.8 Transportation 19,471 Qatar Exchange 547,046
- 7. Contacts Saugata Sarkar, CFA, CAIA Shahan Keushgerian Zaid al-Nafoosi , CMT, CFTe Head of Research Senior Research Analyst Senior Research Analyst Tel: (+974) 4476 6534 Tel: (+974) 4476 6509 Tel: (+974) 4476 6535 saugata.sarkar@qnbfs.com.qa shahan.keushgerian@qnbfs.com.qa zaid.alnafoosi@qnbfs.com.qa QNB Financial Services Co. W.L.L. Contact Center: (+974) 4476 6666 PO Box 24025 Doha, Qatar Disclaimer and Copyright Notice: This publication has been prepared by QNB Financial Services Co. W.L.L. (“QNBFS”) a wholly-owned subsidiary of Qatar National Bank (Q.P.S.C.). QNBFS is regulated by the Qatar Financial Markets Authority and the Qatar Exchange. Qatar National Bank (Q.P.S.C.) is regulated by the Qatar Central Bank. This publication expresses the views and opinions of QNBFS at a given time only. It is not an offer, promotion or recommendation to buy or sell securities or other investments, nor is it intended to constitute legal, tax, accounting, or financial advice. QNBFS accepts no liability whatsoever for any direct or indirect losses arising from use of this report. Any investment decision should depend on the individual circumstances of the investor and be based on specifically engaged investment advice. We therefore strongly advise potential investors to seek independent professional advice before making any investment decision. Although the information in this report has been obtained from sources that QNBFS believes to be reliable, we have not independently verified such information and it may not be accurate or complete. QNBFS does not make any representations or warranties as to the accuracy and completeness of the information it may contain, and declines any liability in that respect. For reports dealing with Technical Analysis, expressed opinions and/or recommendations may be different or contrary to the opinions/recommendations of QNBFS Fundamental Research as a result of depending solely on the historical technical data (price and volume). QNBFS reserves the right to amend the views and opinions expressed in this publication at any time. It may also express viewpoints or make investment decisions that differ significantly from, or even contradict, the views and opinions included in this report. This report may not be reproduced in whole or in part without permission from QNBFS COPYRIGHT: No part of this document may be reproduced without the explicit written permission of QNBFS. Page 7 of 7