QNBFS Weekly Market Report May 9, 2019
•
0 j'aime•94 vues

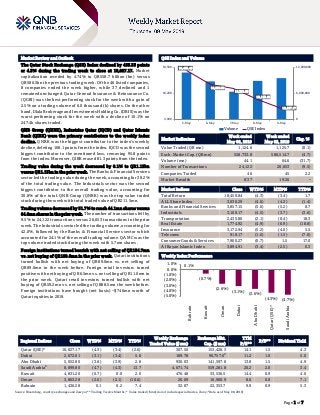
The Qatar Stock Exchange (QSE) Index declined by 453.35 points or 4.3% during the trading week to close at 10,027.17

Recommandé
Recommandé
Contenu connexe
Plus de QNB Group
Plus de QNB Group (20)
Dernier
Dernier (20)
QNBFS Weekly Market Report May 9, 2019
- 1. ` Page 1 of 7 Market Review and Outlook QSE Index and Volume The Qatar Stock Exchange (QSE) Index declined by 453.35 points or 4.3% during the trading week to close at 10,027.17. Market capitalization receded by 4.74% to QR558.7 billion (bn) versus QR586.5bn the previous trading week. Of the 46 listed companies, 8 companies ended the week higher, while 37 declined and 1 remained unchanged. Qatar General Insurance & Reinsurance Co. (QGRI) was the best performing stock for the week with a gain of 2.5% on a trading volume of 6.0 thousand (k) shares. On the other hand,DlalaBrokerageandInvestmentsHolding Co.(DBIS)wasthe worst performing stock for the week with a decline of 10.1% on 247.4k shares traded. QNB Group (QNBK), Industries Qatar (IQCD) and Qatar Islamic Bank (QIBK) were the primary contributors to the weekly index decline. QNBK was the biggest contributor to the index’s weekly decline, deleting 108.1 points from the index. IQCD was the second biggest contributor to the mentioned loss, removing 95.8 points from the index. Moreover, QIBK erased 81.3 points from the index. Trading value during the week decreased by 0.1% to QR1.12bn versus QR1.13bn in the prior week. The Banks & Financial Services sector led the trading value during the week, accounting for 38.2% of the total trading value. The Industrials sector was the second biggest contributor to the overall trading value, accounting for 30.8% of the total. QNB Group (QNBK) was the top value traded stock during the week with total traded value of QR211.5mn. Trading volume decreased by 31.7% to reach 44.1mnshares versus 64.6mnshares in the prior week. The number of transactions fellby 9.5% to 24,122 transactions versus 26,653 transactions in the prior week. The Industrials sector led the trading volume, accounting for 42.0%, followed by the Banks & Financial Services sector which accounted for 24.1% of the overall trading volume. QAMC was the top volume traded stock during the week with 5.7mn shares. Foreign institutions turned bearish with net selling of QR154.7mn vs. net buying of QR188.6mn in the prior week. Qatari institutions turned bullish with net buying of QR89.0mn vs. net selling of QR89.0mn in the week before. Foreign retail investors turned positive with netbuying of QR6.5mn vs. netselling of QR11.0mn in the prior week. Qatari retail investors turned bullish with net buying of QR59.2mn vs. net selling of QR88.5mn the week before. Foreign institutions have bought (net basis) ~$746mn worth of Qatari equities in 2019. Market Indicators Week ended May 09, 2019 Week ended May 02, 2019 Chg. % Value Traded (QR mn) 1,124.6 1,125.7 (0.1) Exch. Market Cap. (QR mn) 558,733.8 586,514.7 (4.7) Volume (mn) 44.1 64.6 (31.7) Number of Transactions 24,122 26,653 (9.5) Companies Traded 46 45 2.2 Market Breadth 8:37 19:26 – Market Indices Close WTD% MTD% YTD% Total Return 18,450.84 (4.3) (3.4) 1.7 ALL Share Index 3,036.29 (4.6) (4.2) (1.4) Banks and Financial Services 3,857.15 (5.6) (5.2) 0.7 Industrials 3,100.17 (4.5) (3.7) (3.6) Transportation 2,435.80 (2.1) (0.4) 18.3 Real Estate 1,774.92 (4.9) (6.9) (18.8) Insurance 3,172.94 (5.2) (4.0) 5.5 Telecoms 918.17 (1.6) (1.5) (7.0) Consumer Goods & Services 7,900.27 (0.7) 1.5 17.0 Al Rayan Islamic Index 3,894.91 (3.4) (2.5) 0.3 Market Indices Weekly Index Performance Regional Indices Close WTD% MTD% YTD% Weekly Exchange Traded Value ($ mn) Exchange Mkt. Cap. ($ mn) TTM P/E** P/B** Dividend Yield Qatar (QSE)* 10,027.17 (4.3) (3.4) (2.6) 307.50 153,428.3 14.1 1.5 4.3 Dubai 2,672.61 (3.1) (3.4) 5.6 189.78 96,757.6# 11.2 1.0 5.0 Abu Dhabi 5,052.80 (3.6) (3.9) 2.8 930.03 141,597.8 13.8 1.5 4.9 Saudi Arabia# 8,899.80 (4.7) (4.3) 13.7 4,671.74 559,281.8 20.2 2.0 3.4 Kuwait 4,831.20 (0.7) 0.0 2.0 476.48 33,536.5 14.4 0.9 4.0 Oman 3,863.28 (2.6) (2.1) (10.6) 20.09 16,900.9 8.0 0.8 7.1 Bahrain 1,436.28 0.1 0.2 7.4 32.87 22,353.7 9.9 0.9 5.3 Source: Bloomberg, country exchanges and Zawya (** Trailing Twelve Months; * Value traded ($ mn) do not include special trades, if any; #Data as of May 08, 2019) 10,461.49 10,296.59 10,251.08 10,123.40 10,027.17 0 6,000,000 12,000,000 9,900 10,200 10,500 5-May 6-May 7-May 8-May 9-May Volume QSE Index 0.1% (0.7%) (2.6%) (3.1%) (3.6%) (4.3%) (4.7%) (5.0%) (4.0%) (3.0%) (2.0%) (1.0%) 0.0% 1.0% Bahrain Kuwait Oman Dubai AbuDhabi Qatar(QSE)* SaudiArabia
- 2. Page 2 of 7 Stock Split Dates for Listed Qatari Companies Source: QSE News Economic & Market News Qatar witnesses 4% MoM growth in building permits issued in April – Aided by double-digit expansion in the building permits issued by Al Daayen, Umm Slal and Al Shamal, Qatar witnessed 4% MoM growth in total permits issued in April this year, according to official statistics. Al Rayan, Doha and Al Wakrah together constituted 67% of the total 743 building permits issued in Qatar in April this year, according to the statistics revealed by the Planning and Statistics Authority (PSA). On geographical basis, the PSA found that Al Rayyan remained atop the municipalities where the number of building permits issued were 206, or 28% of the total issued permits, Doha 150 (20%), Al Wakrah 140 (19%), Al Daayen 111 (15%), Umm Slal 63 (8%), Al Shahaniya 32 (4%), Al Khor 26 (4%), and Al Shamal 14 (2%). (Gulf-Times.com) OBG: Qatar’s four Islamic banks’ total assets rose 1.77% in the first nine months of 2018 – The total assets of Qatar’s four Islamic banks rose by 1.77%, while their financing assets climbed by 3.81% in the first nine months of 2018, Oxford Business Group (OBG) stated in a report. The sector also remained profitable during this period, with net profit showing 8.36% YoY gain. Importantly, the margins secured during this ‘challenging’ period were made without any significant deterioration in financial stability indicators, OBG noted in its ‘The Report: Qatar 2019’. According to Malaysia-based Islamic Financial Services Board, Qatar’s four Islamic banks - QIBK, Masraf Al Rayan, QIIK and Barwa - showed a capital adequacy ratio of 17.3% in the second quarter of 2018, against 17.5% at the end of 2016. Meanwhile, non-performing financing showed only a modest gain over the same period, rising from 0.6% to 1.2%. Qatar’s Islamic banks have grown more quickly than their conventional counterparts over recent years, and collectively posted a 9.1% growth in assets over 2017 to continue this trend. However, the diplomatic crisis that began in 2017 led to concerns regarding the performance of the nation’s Islamic financial institutions. Following the June 2017 economic blockade of the country, the government ‘moved quickly’ to defend the banking sector with injections of public liquidity, a capability it enjoys thanks in large part to Qatar’s sizeable reserves and the revenues it receives from its hydrocarbons exports. (Gulf-Times.com) Qatar’s April Financial Center PMI falls to 48.9 from 50.1 in March – Qatar’s April Financial Center Purchasing Managers’ Index (PMI) fell to 48.9 from 50.1 in March. Employment fell to 48.7 in April from 49.2 in March. (Bloomberg) CI affirms QIIK’s long-term foreign currency rating at ‘A’ – Capital Intelligence Ratings (CI) affirmed the long-term foreign currency rating (LT FCR) of Qatar International Islamic Bank (QIIK) at ‘A’. The rating agency also adjusted the bank’s short- term foreign currency rating (ST FCR) to ‘A1’ from ‘A2’. The bank has also been assigned a bank standalone rating (BSR) of ‘bbb+’, a core financial strength (CFS) rating of ‘bbb+’ and an extraordinary support level (ESL) of ‘high’. The outlook on the LT FCR has been revised to ‘Stable’ from ‘Negative’ and the
- 3. Page 3 of 7 outlook on the BSR is also ‘Stable’. The revision of the bank’s LT FCR outlook to ‘Stable’ mirrors the recent change in the outlook for Qatar’s ‘AA-’ sovereign rating to ‘Stable’ from ‘Negative’. The bank’s BSR is based on a CFS rating of ‘bbb+’ and an operating environment risk anchor of ‘bbb’. The CFS is supported by QIIK’s good asset quality with strong extended non-performing financing receivables (NPFR) coverage and by a strong customer deposit base which limits the need for wholesale funding. (Gulf-Times.com) WOQOD opens Wadi Aba Seleel Petrol Station – Qatar Fuel Company (WOQOD) opened Wadi Aba Seleel Petrol Station, increasing the strength of its network of various petrol stations to 87, according to a statement. WOQOD’s CEO, Saad Rashid Al- Muhannadi explained that the company aspires to expand its petrol station network in the country to meet the rising demand for petroleum products and achieve the goal of providing customers with access to best-in-class products and services at their convenience and comfort. Al-Muhannadi said, “WOQOD is currently overseeing the implementation of 30 new petrol stations, which will be operational during 2019. As part of its strategic expansion plan, WOQOD is targeting the achievement of a total of 134 fuel stations by the end of 2020.” (Gulf- Times.com) Kahramaa commissions all five substations for 2022 FIFA World Cup – Qatar General Electricity and Water Corporation (Kahramaa) opened and energized Ras Abu Abboud-2 substation successfully at a cost of QR93mn, which will supply electricity to Ras Abu Aboud Stadium, a venue of 2022 FIFA World Cup. With the commissioning of the new substation, Kahramaa achieved all its electricity projects pertaining to 2022 FIFA World Cup stadiums. Kahramaa has energized and commissioned five substations for World Cup stadiums with a total cost of QR800mn. The substations are designed specially to ensure uninterrupted power supply to FIFA 2022 World Cup stadiums following high international standards of safety and security. (Peninsula Qatar) Kahramaa, Umm Al Houl Power sign pact to increase water desalination capacity – Under the patronage, and in the presence of HE Saad bin Sherida Al Kaabi, the Minister of State for Energy Affairs and the President & CEO of Qatar Petroleum, the General Electricity and Water Corporation (Kahramaa) and Umm Al Houl Power Company signed an amendment to their agreement on the provision of electricity and water. The amendment will increase water desalination capacity by 61.5mn gallons per day (about 280,000 cubic meters), which enhances Kahramaa’s capabilities for sustainable supply of high quality water and electricity in Qatar. Under the agreement, Umm Al Houl will build and operate an expansion to the existing plant that would raise its overall capacity to 198mn gallons of water per day by 2021. The expansion will use the new reverse osmosis technology, which will improve production efficiency and reduce the use of gas in production systems. Umm Al Houl Power will act as the project’s developer, while Samsung will be the main contractor and Acciona will be the supplier and sub- contractor. (Peninsula Qatar) Al Rayan Qatar ETF to pay QR1.10 cash dividend – Al Rayan Investment, pursuant to its authority as Fund Manager, announces a cash dividend distribution of QR1.10 per unit for Al Rayan Qatar ETF, an exchange-traded fund founded by Masraf Al Rayan. All QATAR unit holders at the close of May 14th, 2019 (record date) based on records of the Qatar Central Securities Depository (QCSD), will be entitled to receive cash dividends. Dividends will be paid from Sunday 19th May, 2019. Unit holders who have registered their bank accounts with the QCSD will have dividends deposited directly in their accounts. Other unit holders may collect their dividends from any of Masraf Al Rayan branches (except for Al Hazm Mall and Al Hilal branches) from Sunday 19th May, 2019 onwards. (QSE) QCSD amended the foreign ownership percentage of Islamic Insurance to 49% – Qatar Central Securities Depository (QCSD) announced that it had amended the foreign ownership percentage of Qatar Islamic Insurance Group to become 49% of the company's capital, which is equal to 7,350,000 shares. (QSE) MERS establishes a new company named ‘Maar Trading and Servicing Company’ – Al Meera Consumer Goods Company (MERS) has established a new company named ‘Maar Trading and Servicing Company’, a limited liability company fully owned by MERS. The objectives of the company include fruits & vegetables, General merchandise, restaurants, Cafeterias, ice cream, Markets grocery & supplying, Scholastic scientific, library tools, Café, juice & roasters. Maar Trading and Servicing Company will be one of MERS’ subsidiary companies. (QSE) The Commercial Bank’s long-term foreign currency rating affirmed at ‘A-’ by Capital Intelligence – Capital Intelligence (CI), an international credit rating agency, affirmed the long- term foreign currency rating (LT FCR) of The Commercial Bank at ‘A-’. At the same time, CI has adjusted the bank’s short term foreign currency rating (ST FCR) to ‘A1’ from ‘A2’. The lender has also been assigned a bank standalone rating (BSR) of ‘bbb-’, a core financial strength (CFS) rating of ‘bb+’ and an extraordinary support level (ESL) of ‘high’. The bank’s LT FCR is set three notches above the BSR to reflect the high likelihood of extraordinary support from the government in the event of financial distress. This is based on the government’s strong track record of support for Qatari banks. Its BSR is based on a CFS rating of ‘bb+’ and an operating environment risk anchor of ‘bbb’. These include the good domestic franchise as the second largest conventional bank in Qatar and the diversification and future growth opportunities provided by the Turkish subsidiary. The one positive area of the financial metrics is the profitability where operating and net profitability both improved. (Gulf- Times.com)
- 4. Page 4 of 7 Qatar Stock Exchange Top Gainers Top Decliners Source: Qatar Stock Exchange (QSE) Source: Qatar Stock Exchange (QSE) Most Active Shares by Value (QR Million) Most Active Shares by Volume (Million) Source: Qatar Stock Exchange (QSE) Source: Qatar Stock Exchange (QSE) Investor Trading Percentage to Total Value Traded Net Traded Value by Nationality (QR Million) Source: Qatar Stock Exchange (QSE) Source: Qatar Stock Exchange (QSE) 2.5% 2.2% 2.1% 1.9% 1.1% 0.0% 1.0% 2.0% 3.0% Qatar General Ins. & Reins. Co. Gulf International Services Zad Holding Company Qatar Oman Investment Co. Alijarah Holding -10.1% -7.0% -6.9% -6.6% -6.5% -12.0% -8.0% -4.0% 0.0% DlalaBrokerage & Inv.HoldingCo. Industries Qatar The Commercial Bank QNBGroup QatarIslamicBank 211.5 109.9 93.8 77.7 60.7 0.0 80.0 160.0 240.0 QNB Group Qatar Fuel Company Industries Qatar Gulf International Services Qatar Islamic Bank 5.7 4.1 4.1 3.8 3.5 0.0 2.0 4.0 6.0 Qatar Aluminium Manufacturing Company Qatar First Bank Gulf International Services Investment Holding Group Ezdan Holding Group 0% 20% 40% 60% 80% 100% Buy Sell 37.78% 32.52% 24.96% 17.04% 12.12% 11.55% 25.14% 38.89% Qatari Individuals Qatari Institutions Non-Qatari Individuals Non-Qatari Institutions 706 419 557 567 148 (148) (200) - 200 400 600 800 Qatari Non-Qatari Net Investment Total Sold Total Bought
- 5. Page 5 of 7 TECHNICAL ANALYSIS OF THE QSE INDEX Source: Bloomberg The QE Index closed 4.33% down from the week before, and closed at 10,027.17. The Index has been in a pullback phase since March; that phase maybe over. As a result, we keep our next expected resistance level at 10,800 points but update the weekly support to 9,700 points. DEFINITIONS OF KEY TERMS USED IN TECHNICAL ANALYSIS RSI (Relative Strength Index) indicator – RSI is a momentum oscillator that measures the speedand change of price movements. The RSI oscillates between 0 to 100. The index is deemed to be overbought once the RSI approaches the 70 level, indicating that a correction is likely. On the other hand, if the RSI approaches 30, it is an indication that the index may be getting oversold and therefore likely to bounce back. MACD (Moving Average Convergence Divergence) indicator – The indicator consists of the MACD line and a signal line. The divergence or the convergence of the MACD line with the signal line indicates the strength in the momentum during the uptrend or downtrend, as the case may be. When the MACD crosses the signal line from below and trades above it, it gives a positive indication. The reverse is the situation for a bearish trend. Candlestick chart – A candlestick chart is a price chart that displays the high, low, open, and close for a security. The ‘body’ of the chart is portion between the open and close price, while the high and low intraday movements form the ‘shadow’. The candlestick may represent any time frame. We use a one-day candlestick chart (every candlestick represents one trading day) in our analysis. Doji candlestick pattern – A Doji candlestick is formed when a security's open and close are practically equal. The pattern indicates indecisiveness, and based on preceding price actions and future confirmation, may indicate a bullish or bearish trend reversal. ShootingStar/Inverted Hammer candlestick patterns – These candlestick patterns have a small real body (open price and close price are near to each other), and a long upper shadow (large intraday movement on the upside). The Shooting Star is a bearish reversal pattern that forms after a rally. The Inverted Hammer looks exactly like a Shooting Star, but forms after a downtrend. Inverted Hammers represent a potential bullish trend reversal.
- 6. Page 6 of 7 Source: Bloomberg Company Name Price May 09 % Change WTD % Change YTD Market Cap. QR Million TTM P/E P/B Div. Yield Qatar National Bank 182.50 (6.60) (6.41) 168,565 12.9 2.6 3.3 Qatar Islamic Bank 159.00 (6.47) 4.61 37,571 14.4 2.5 3.1 Commercial Bank of Qatar 47.20 (6.90) 19.83 19,103 13.2 1.2 3.2 Doha Bank 22.49 (2.64) 1.31 6,973 13.0 0.8 4.4 Al Ahli Bank 30.00 0.00 17.86 6,942 10.4 1.3 3.0 Qatar International Islamic Bank 67.55 (2.10) 2.16 10,225 12.2 1.9 5.9 Masraf Al Rayan 35.50 (2.42) (14.83) 26,625 12.4 2.2 5.6 Al Khaliji Bank 11.70 (0.51) 1.39 4,212 7.5 0.8 6.4 Qatar First Bank 4.75 (5.38) 16.42 950 N/A 0.9 N/A National Leasing 8.39 1.08 (4.55) 415 37.9 0.6 6.0 Dlala Holding 9.65 (10.07) (3.50) 274 N/A 1.3 N/A Qatar & Oman Investment 6.00 1.87 12.36 189 74.2 0.7 5.0 Islamic Holding Group 21.00 (3.00) (3.89) 119 871.8 0.9 N/A Banking and Financial Services 282,163 Zad Holding 122.60 2.07 17.88 1,764 13.6 1.8 6.9 Qatar German Co. for Medical Devices 6.20 0.49 9.54 72 N/A 1.9 N/A Salam International Investment 4.77 (4.41) 10.16 545 N/A 0.5 N/A Medicare Group 60.00 (4.43) (4.91) 1,689 20.0 1.8 3.0 Qatar Cinema & Film Distribution 19.20 (1.69) 0.95 121 13.6 0.8 7.8 Qatar Fuel 207.99 0.05 25.30 20,680 17.4 2.7 3.8 Qatar Meat and Livestock 58.80 (1.82) (16.00) 1,058 9.8 3.4 7.7 Mannai Corp. 42.25 (3.54) (23.11) 1,927 5.3 0.8 4.7 Al Meera Consumer Goods 143.00 (1.17) (3.38) 2,860 15.6 2.2 5.9 Consumer Goods and Services 30,716 Qatar Industrial Manufacturing 38.30 (1.29) (10.30) 1,820 9.9 1.2 6.5 Qatar National Cement 63.50 (4.51) 6.72 4,150 12.8 1.4 7.9 Industries Qatar 113.01 (6.99) (15.42) 68,371 15.4 2.1 5.3 Qatari Investors Group 23.00 (3.16) (17.30) 2,860 16.6 1.1 3.3 Qatar Electricity and Water 161.71 (2.29) (12.59) 17,788 12.3 1.9 4.8 Aamal 8.68 (2.69) (1.81) 5,468 12.9 0.7 6.9 Gulf International Services 18.22 2.24 7.18 3,386 N/A 1.0 N/A Mesaieed Petrochemical Holding 20.10 (1.95) 33.73 25,252 19.2 1.8 4.0 Invesment Holding Group 5.86 (4.72) 19.84 486 8.1 0.6 4.3 Qatar Aluminum Manufacturing 9.90 (3.41) (25.84) 5,524 N/A N/A 2.0 Industrials 135,106 Qatar Insurance 36.61 (5.52) 1.98 11,957 19.7 1.5 4.1 Doha Insurance 11.85 (0.59) (9.47) 593 11.9 0.6 6.8 Qatar General Insurance & Reinsurance 41.00 2.45 (8.65) 3,588 17.2 0.6 2.4 Al Khaleej Takaful Insurance 14.95 (5.56) 74.04 382 13.2 0.7 3.3 Qatar Islamic Insurance 53.00 (3.34) (1.32) 795 12.3 2.4 6.6 Insurance 17,314 United Development 13.50 0.67 (8.47) 4,780 10.5 0.4 7.4 Barw a Real Estate 33.85 (4.38) (15.18) 13,172 6.9 0.7 7.4 Ezdan Real Estate 9.60 (6.25) (26.04) 25,464 42.0 0.8 N/A Mazaya Qatar Real Estate Development 8.00 (0.37) 2.56 926 80.8 0.6 6.3 Real Estate 44,342 Ooredoo 63.90 (1.54) (14.80) 20,468 13.7 0.9 3.9 Vodafone Qatar 7.62 (1.68) (2.43) 6,442 45.2 1.5 3.3 Telecoms 26,910 Qatar Navigation (Milaha) 66.20 (1.19) 0.29 7,582 14.1 0.5 4.5 Gulf Warehousing 46.00 (3.14) 19.57 2,696 11.2 1.7 4.1 Qatar Gas Transport (Nakilat) 21.49 (2.32) 19.85 11,906 13.0 1.9 4.7 Transportation 22,183 Qatar Exchange 558,734
- 7. Contacts Saugata Sarkar, CFA, CAIA Shahan Keushgerian Zaid al-Nafoosi , CMT, CFTe Head of Research Senior Research Analyst Senior Research Analyst Tel: (+974) 4476 6534 Tel: (+974) 4476 6509 Tel: (+974) 4476 6535 saugata.sarkar@qnbfs.com.qa shahan.keushgerian@qnbfs.com.qa zaid.alnafoosi@qnbfs.com.qa Mehmet Aksoy, PhD QNB Financial Services Co. W.L.L. Senior Research Analyst Contact Center: (+974) 4476 6666 Tel: (+974) 4476 6589 PO Box 24025 mehmet.aksoy@qnbfs.com.qa Doha, Qatar Disclaimer and Copyright Notice: This publication has been prepared by QNB Financial Services Co. W.L.L. (“QNB FS”) a wholly-owned subsidiary of Qatar National Bank (Q.P.S.C.). QNB FS is regulated by the Qatar Financial Markets Authority and the Qatar Exchange. Qatar National Bank (Q.P.S.C.) is regulated by the Qatar Central Bank. This publication expresses the views and opinions of QNB FS at a given time only. It is not an offer, promotion or recommendation to buy or sell securities or other investments, nor is it intended to constitute legal, tax, accounting, or financial advice. QNB FS accepts no liability whatsoever for any direct or indirect losses arising from use of this report. Any investment decision should depend on the individual circumstances of the investor and be based on specifically engaged investment advice. We therefore strongly advise potential investors to seek independent professional advice before making any investment decision. Although the information in this report has been obtained from sources that QNB FS believes to be reliable, we have not independently verified such information and it may not be accurate or complete. QNB FS does not make any representations or warranties as to the accuracy and completeness of the information it may contain, and declines any liability in that respect. For reports dealing with Technical Analysis, expressed opinions and/or recommendations may be different or contrary to the opinions/recommendations of QNB FS Fundamental Research as a result of depending solely on the historical technical data (price and volume). QNB FS reserves the right to amend the views and opinions expressed in this publication at any time. It may also express viewpoints or make investment decisions that differ significantly from, or even contradict, the views and opinions included in this report. This report may not be reproduced in whole or in part without permission from QNB FS COPYRIGHT: No part of this document may be reproduced without the explicit written permission of QNB FS. Page 7 of 7