QNBFS Weekly Market Report November 28, 2019
•
0 j'aime•22 vues

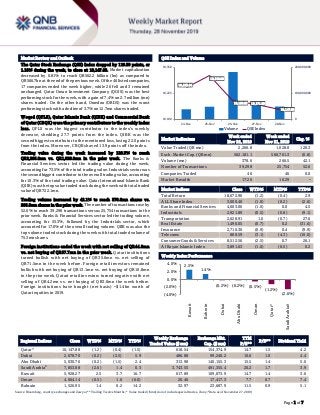
The Qatar Stock Exchange (QSE) Index dropped by 119.39 points, or 1.16% during the week, to close at 10,147.88

Recommandé
Recommandé
Contenu connexe
Plus de QNB Group
Plus de QNB Group (20)
Dernier
Dernier (20)
QNBFS Weekly Market Report November 28, 2019
- 1. ` Page 1 of 7 Market Review and Outlook QSE Index and Volume The Qatar Stock Exchange (QSE) Index dropped by 119.39 points, or 1.16% during the week, to close at 10,147.88. Market capitalization decreased by 0.81% to reach QR562.2 billion (bn) as compared to QR566.7bn at the end of the previous week. Of the 46 listed companies, 17 companies ended the week higher, while 26 fell and 3 remained unchanged. Qatar Oman Investment Company (QOIS) was the best performing stock for the week, with a gain of 7.4% on 2.7 million (mn) shares traded. On the other hand, Ooredoo (ORDS) was the worst performing stock with a decline of 3.7% on 12.7mn shares traded. Woqod (QFLS), Qatar Islamic Bank (QIBK) and Commercial Bank of Qatar (CBQK) were the primary contributors to the weekly index loss. QFLS was the biggest contributor to the index’s weekly decrease, shedding 27.7 points from the index. QIBK was the second biggestcontributor to the mentioned loss, losing 22.0 points from the index. Moreover, CBQK shaved 13.9 points off the index. Trading value during the week increased by 120.3% to reach QR2,266.8mn vs. QR1,028.8mn in the prior week. The Banks & Financial Services sector led the trading value during the week, accounting for 73.5% of the total trading value. Industrials sector was the second biggest contributor to the overall trading value, accounting for 10.3% of the total trading value. Qatar International Islamic Bank (QIIK) was the top value traded stock during the week with total traded value of QR722.1mn. Trading volume increased by 42.1% to reach 378.6mn shares vs. 266.5mn shares in the prior week. The number of transactions rose by 52.6% to reach 39,298 transactions versus 25,754 transactions in the prior week. Banks & Financial Services sector led the trading volume, accounting for 55.3%, followed by the Industrials sector, which accounted for 17.0% of the overall trading volume. QIIK was also the top volume traded stock during the week with total traded volume of 75.3mn shares. Foreign institutions ended the week with net selling of QR44.5mn vs. net buying of QR57.7mn in the prior week. Qatari institutions turned bullish with net buying of QR35.6mn vs. net selling of QR71.5mn in the week before. Foreign retail investors remained bullish with net buying of QR13.1mn vs. net buying of QR10.8mn in the prior week. Qatari retail investors turned negative with net selling of QR4.2mn vs. net buying of QR3.0mn the week before. Foreign institutions have bought (net basis) ~$1.4bn worth of Qatari equities in 2019. Market Indicators Week ended Nov 28, 2019 Week ended Nov 21, 2019 Chg. % Value Traded (QR mn) 2,266.8 1,028.8 120.3 Exch. Market Cap. (QR mn) 562,181.1 566,761.3 (0.8) Volume (mn) 378.6 266.5 42.1 Number of Transactions 39,298 25,754 52.6 Companies Traded 46 46 0.0 Market Breadth 17:26 16:29 – Market Indices Close WTD% MTD% YTD% Total Return 18,672.96 (1.2) (0.4) 2.9 ALL Share Index 3,000.40 (1.0) (0.2) (2.6) Banks and Financial Services 4,003.06 (1.0) 0.0 4.5 Industrials 2,921.89 (0.5) (0.8) (9.1) Transportation 2,628.91 1.0 (0.7) 27.6 Real Estate 1,496.05 (0.7) 0.2 (31.6) Insurance 2,710.30 (0.9) 0.4 (9.9) Telecoms 888.59 (3.1) (4.3) (10.0) Consumer Goods & Services 8,512.56 (2.5) 0.7 26.1 Al Rayan Islamic Index 3,891.63 (1.0) (0.5) 0.2 Market Indices Weekly Index Performance Regional Indices Close WTD% MTD% YTD% Weekly Exchange Traded Value ($ mn) Exchange Mkt. Cap. ($ mn) TTM P/E** P/B** Dividend Yield Qatar* 10,147.88 (1.2) (0.4) (1.5) 618.54 154,374.9 14.7 1.5 4.2 Dubai 2,678.70 (0.2) (2.5) 5.9 486.88 99,240.2 10.6 1.0 4.4 Abu Dhabi 5,030.76 (0.2) (1.5) 2.4 313.98 140,155.3 15.5 1.4 5.0 Saudi Arabia# 7,853.08 (2.6) 1.4 0.3 3,743.55 491,355.4 20.2 1.7 3.9 Kuwait 5,928.27 2.5 3.7 16.7 617.89 109,873.9 14.7 1.4 3.6 Oman 4,064.14 (0.5) 1.6 (6.0) 20.46 17,417.3 7.7 0.7 7.4 Bahrain 1,526.95 1.4 0.2 14.2 32.97 23,687.9 11.5 0.9 5.1 Source: Bloomberg, country exchanges and Zawya (** Trailing Twelve Months; * Value traded ($ mn) do not include special trades, if any; #Data as of November 27, 2019) 10,253.54 10,310.88 10,190.82 10,171.39 10,147.88 0 100,000,000 200,000,000 10,100 10,225 10,350 24-Nov 25-Nov 26-Nov 27-Nov 28-Nov Volume QSE Index 2.5% 1.4% (0.2%) (0.2%) (0.5%) (1.2%) (2.6%)(4.0%) (2.0%) 0.0% 2.0% 4.0% Kuwait Bahrain Dubai AbuDhabi Oman Qatar* SaudiArabia#
- 2. Page 2 of 7 News Economic News / Market & Corporate News Qatar Petroleum announces load out of first two jackets for North Field Expansion – Qatar Petroleum (QP) has announced the completed fabrication of the first two jackets required for offshore facilities as part of its North Field Expansion (NFE) Project. The NFE project’s Engineering, Procurement, Construction and Installation contract for the jackets was awarded to McDermott in April this year. McDermott was also awarded the Front End Engineering and Design (FEED) contract for the associated topsides and pipelines in May 2019. On the occasion, HE the Minister of State for Energy Affairs Saad bin Sherida Al-Kaabi, also the President and CEO of QP as well as Chairman of Qatargas, said, “The successful, on-schedule completion of the first two jackets is a testament to our commitment to putting the various NFE project components in place, on time, and with the highest safety and quality standards. I would like to congratulate Qatargas and McDermott on this milestone achievement and to thank their collaboration with Qatar Petroleum in building these jackets in such a short time.” (Gulf-Times.com) Al-Kaabi: LNG output increase a big boost for national economy – Qatar Petroleum’s (QP) planned increase in its LNG production capacity will significantly boost the national economy, according to HE the Minister of State for Energy Affairs Saad bin Sherida Al-Kaabi. “For many years, the local economy, construction sector in particular, will benefit from the establishment of mega trains and associated facilities for enhanced LNG production,” Al-Kaabi said at a media event at the QP headquarters. Qatar’s LNG production capacity will be raised to 126mn tons per year (tpy) by 2027, representing a huge increase of 64% on the current 77mn tpy. This is in addition to the Golden Pass LNG export facility located in Sabine Pass, Texas with a production capacity of about 16mn tons of LNG per year. The project, which is owned by Golden Pass Products, is a joint venture of QP (70%) and ExxonMobil (30%). The LNG production capacity boost will also raise Qatar’s overall hydrocarbon production to about 6.7mn barrels oil equivalent per day. New studies have revealed that the North Field’s productive layers extend well into Qatari land in Ras Laffan, paving the way for a new LNG production project in the north of Qatar. Al-Kaabi announced that the confirmed gas reserves of the North Field exceed 1,760tn cubic feet, in addition to more than 70bn barrels of condensates, and massive quantities of LPG, ethane, and helium. “These results will enable us to immediately commence the necessary engineering work for two additional LNG mega trains with a combined annual capacity of 16mn tons per year,” Al-Kaabi noted. (Gulf- Times.com) Qatar among fastest growing global economies – Qatar is progressing towards a sustained economic growth through long term diversification. The country is one of the fastest growing economies in the world and its economy is expected to grow at a faster rate next year, Qatar Financial Centre’s (QFC) CEO, Yousuf Mohamed Al-Jaida said. “Qatar’s economy is forecast to grow 2.8% this year and close to 3% in 2020. We are one of the fastest growing economies in the world and notably the second most competitive economy in the Middle East,” Al-Jaida said, delivering keynote speech at The Qatar Trade Summit which began at the Hotel Intercontinental, Doha the City, yesterday. He said the nation is witnessing sustainable economic growth, thanks to several proactive measures taken by the government in the past. “As Qatar National Vision 2030 places great emphasis on economic diversification and development of private sector, Qatar has taken major strides in the recent years that are shaping the nation’s reputation as a big destination and a gateway of choice to the larger MENA region. In 2019, Qatar was ranked first in the Arab region and seventh globally in terms of investment security,” he said. The resilience of Qatar’s economy is has been vindicated by many global agencies. He said that, last January, global rating agencies S&P (Standard & Poor’s) and Moody’s reaffirmed outlook on Qatar’s economy noting that Qatar has succeeded in mitigating the financial impact of geopolitical challenges. (Peninsula Qatar) Qatar posts trade surplus of QR38.2bn in 3Q2019 – Qatar’s trade balance (the difference between total exports and imports) during the third quarter of 2019, recorded a surplus of QR38.2bn, down from QR49.9bn recorded in the same period last year. The total value of Qatari exports (including exports of domestic goods and re-exports) during the third quarter of this year amounted to QR63.9bn, down QR15.9bn, or 20.0%, compared to the same quarter of last year, which recorded total exports amounted to QR79.8bn, according to a statement issued by the Planning and Statistics Authority. The statement attributedthe decline in total exports to a decline in exports of mineral fuels, lubricants and similar materials worth QR14.7bn, chemicals and non-mentioned products worth QR1.1bn, and machinery and transport equipment (mostly re-export) worth QR0.3bn, as exports witnessed an increase in manufactured goods, mainly classified by material, with a value of QR0.1bn, and miscellaneous manufactures with a value of QR0.1bn. The value of Qatari imports during the third quarter of 2019 amounted to QR25.7bn, a decrease of QR4.3bn, or 14.2%, compared to the third quarter of 2018, which amounted to QR30.0bn. According to the Planning and Statistics Authority, this decline is mainly due to a decline in imports of machinery and transport equipment worth QR1.8bn, miscellaneous manufactures worth QR1.0bn, and manufactured goods, classified mainly by material, worth QR0.9bn, unidentified chemicals and products worth QR0.1bn, food and live animals worth QR0.1bn, mineral fuels, lubricants and similar materials worth QR0.1bn, and beverages and tobacco worth QR0.1bn, while the main increases in non-edible raw materials, excluding fuel, were recorded at QR0.1bn. According to the data, Asian countries accounted for first place for the countries of destination for Qatari exports during the third quarter of this year, as well as for countries of origin for Qatari imports during the same period, with 79.6% for exports and 33.5% for imports, followed by the European Union at 10.2% and 31.1%. The GCC countries averaged 4.4% and 3.8% for both exports and imports respectively. (Gulf-Times.com) EY survey: Hotels in Doha register highest occupancy growth rate in Middle East – Qatar’s hospitality sector has emerged as
- 3. Page 3 of 7 the best performer among hotels located in most of the major cities across the Middle East region. Hotels in Doha have outperformed the properties located in the region’s prominent tourist destinations such as Cairo, Makkah and Madinah, in terms of growth in occupancy rates, a latest survey by EY showed. According to the findings of ‘The Middle East Hotel Benchmark Survey’ by EY, the average occupancy rates of hotels in Doha (from January to September 2019 period) increased by 8.5% (YTD) to 66.9% compared to 58.3% for the corresponding period last year. Doha was closely followed by Beirut which registered an increase of 7.9% in terms of occupancy. The occupancy rate of hotels located in the Lebanese capital surged to 71% against 63.6% for the same period in 2018. Hotels located in Riyadh and Makkah occupied the third and fourth positions in terms of growth in occupancy rates in the Middle East region witnessing 6.6% and 4.8% growth, respectively. (Peninsula Qatar) Baladna all set for QSE listing on December 11 – Baladna Company is all set to be listed on Qatar Stock Exchange (QSE) on December 11 this year after the company’s constitutive general assembly gave its nod for the final establishment of the company in Doha on Tuesday. On the sidelines of the general assembly, board member Ramez Mhd Ruslan Al-Khayyat said, “We need to be the leader in the local production and export markets, and so by January or February 2020, we are expecting to bring in 2,500 cows from the US.” Baladna currently has approximately 18,000 cows housed in two farms. While Baladna is already exporting to countries such as Iraq and in Southeast Asia, Al-Khayyat said Baladna is planning to set-up its own dairy farm in Malaysia following board approval. (Qatar Tribune, Gulf-Times.com) Baladna eyeing export markets like Libya, Kuwait, Jordan, Mauritania and Iraq – Baladna Food Industries (BFI) is eyeing export markets like Libya, Kuwait, Jordan, Mauritania and Iraq as part of its strategy to expand its footprint in the international diary sector. BFI, whose exports now constitute mere 0.8% of revenues, is already in the process of executing its entry strategy in those markets, the IPO prospectus of Baladna stated, the holding firm of BFI, which began exporting in April 2019 to Yemen, Afghanistan and Oman. The exports are part of BFI's long-term strategy of extending its footprint beyond Qatar in a range of long-life products (both dairy and non-dairy), it stated. In early 2019, BFI developed a plastic packaging factory to support its in-house plastic packing requirements and potentially sell packaging materials to external parties. The resultant import substitution of bottles and caps has resulted in lower costs of packaging and more consistent stock availability. The plant has been scoped to have sufficient spare capacity to allow for both external sales in Qatar and exports, it stated, adding BFI has studied potential export markets for packages, beginning with Kuwait. As of September 2019, BFI is in contact with potential customers in Kuwait. In the medium term, the company currently targets annual comparable revenue growth of 20%-30% and 3%-10% for fiscal year 2020 and fiscal year 2021, respectively, for BFI, driven primarily by the planned launch of new products lines, segments and expansions into new markets. (Gulf-Times.com) MERS acquires 4% ownership in Baladna – Al Meera Consumer Goods Company (MERS) has been allotted 76,040,000 shares of Baladna. These said shares represent 4% of Baladna at a price of QR1.01 per share aggregating to QR76,800,400. (QSE) Mannai Corporation remains upbeat on 2019 performance – Mannai Corporation is upbeat about its performance in 2019 and beyond, despite the market challenges. The Doha-based publicly listed Group has established partnerships and collaborations with several companies, including some of the world’s leading companies for decades. Recently a subsidiary of Mannai Group signed an agreement with Siemens to expanded cooperation aiming to provide more specialized services to the oil and gas industry as part of efforts to achieve self-sufficiency in Qatar. On the Group’s 2019 performance, Mannai Corporation’s Vice-Chairman (Executive Committee), Khalid Mannai said, “Like most other companies in Qatar and other parts of the world, Mannai also goes through the economic cycle of growth. The revenue and profitability of any company does not remain constant all the time. Sometimes it goes up sometimes it goes down because not all the markets perform the same. We do not speculate or comment on revenue and profitability, but we are always optimistic about our solid performance.” On the company’s plans to investing in new markets and sector, Mannai said that the Group is currently focusing on the existing businesses and operations both in Qatar as well as outside the country, and working to further develop and strengthen its activities. He also noted that if there is a slowdown in international market, it is balanced with better performance in local market and vice-versa. That’s the idea most companies prefer to have diversified investment portfolio to minimize risk exposure and remain resilient. (Peninsula Qatar)
- 4. Page 4 of 7 Qatar Stock Exchange Top Gainers Top Decliners Source: Qatar Stock Exchange (QSE) Source: Qatar Stock Exchange (QSE) Most Active Shares by Value (QR Million) Most Active Shares by Volume (Million) Source: Qatar Stock Exchange (QSE) Source: Qatar Stock Exchange (QSE) Investor Trading Percentage to Total Value Traded Net Traded Value by Nationality (QR Million) Source: Qatar Stock Exchange (QSE) Source: Qatar Stock Exchange (QSE) 7.4% 6.9% 5.9% 4.8% 3.9% 0.0% 3.0% 6.0% 9.0% Qatar Oman Investment Co. Islamic Holding Group AhliBank Doha Insurance Group Qatar General Ins. & Reins. Co. -3.7% -3.5% -2.4% -2.2% -2.2% -4.5% -3.0% -1.5% 0.0% Ooredoo QatarFuel Company QatarInternational IslamicBank The Commercial Bank QatarInsurance Company 722.1 536.0 172.3 104.2 89.4 0.0 250.0 500.0 750.0 Qatar International Islamic Bank QNB Group Qatar Islamic Bank The Commercial Bank Qatar Fuel Company 75.3 29.9 27.9 23.6 21.9 0.0 27.0 54.0 81.0 Qatar International Islamic Bank Aamal Company QNB Group The Commercial Bank Mesaieed Petrochemical Holding Co. 0% 20% 40% 60% 80% 100% Buy Sell 11.46% 11.64% 17.07% 15.50% 4.47% 3.90% 67.00% 68.96% Qatari Individuals Qatari Institutions Non-Qatari Individuals Non-Qatari Institutions 647 1,620 615 1,652 31 (31) (500) - 500 1,000 1,500 2,000 Qatari Non-Qatari Net Investment Total Sold Total Bought
- 5. Page 5 of 7 TECHNICAL ANALYSIS OF THE QSE INDEX Source: Bloomberg The QE Index closed down by 1.16% from the week before, and closed at the 10,147.88 level. Our thesis has not changed over the past few weeks, as the Index kept moving inside the corrective channelandbounced below the strong resistance (around the 10,600 level). We keep our expectedweekly-resistance level at 10,800 points and the 9,700 level as our weekly support. DEFINITIONS OF KEY TERMS USED IN TECHNICAL ANALYSIS RSI (Relative Strength Index) indicator – RSI is a momentum oscillator that measures the speedand change of price movements. The RSI oscillates between 0 to 100. The index is deemed to be overbought once the RSI approaches the 70 level, indicating that a correction is likely. On the other hand, if the RSI approaches 30, it is an indication that the index may be getting oversold and therefore likely to bounce back. MACD (Moving Average Convergence Divergence) indicator – The indicator consists of the MACD line and a signal line. The divergence or the convergence of the MACD line with the signal line indicates the strength in the momentum during the uptrend or downtrend, as the case may be. When the MACD crosses the signal line from below and trades above it, it gives a positive indication. The reverse is the situation for a bearish trend. Candlestick chart – A candlestick chart is a price chart that displays the high, low, open, and close for a security. The ‘body’ of the chart is portion between the open and close price, while the high and low intraday movements form the ‘shadow’. The candlestick may represent any time frame. We use a one-day candlestick chart (every candlestick represents one trading day) in our analysis. Doji candlestick pattern – A Doji candlestick is formed when a security's open and close are practically equal. The pattern indicates indecisiveness, and based on preceding price actions and future confirmation, may indicate a bullish or bearish trend reversal. ShootingStar/Inverted Hammer candlestick patterns – These candlestick patterns have a small real body (open price and close price are near to each other), and a long upper shadow (large intraday movement on the upside). The Shooting Star is a bearish reversal pattern that forms after a rally. The Inverted Hammer looks exactly like a Shooting Star, but forms after a downtrend. Inverted Hammers represent a potential bullish trend reversal.
- 6. Page 6 of 7 Source: Bloomberg Company Name Price November 28 % Change WTD % Change YTD Market Cap. QR Million TTM P/E P/B Div. Yield Qatar National Bank 19.25 (0.72) (1.28) 177,801 13.8 2.5 3.1 Qatar Islamic Bank 14.86 (1.78) (2.24) 35,113 12.8 2.1 3.4 Commercial Bank of Qatar 4.38 (2.23) 11.20 17,727 10.8 1.0 3.4 Doha Bank 2.53 0.40 13.96 7,844 11.1 0.8 4.0 Al Ahli Bank 3.60 5.88 41.43 8,330 12.4 1.4 2.5 Qatar International Islamic Bank 9.16 (2.45) 38.54 13,865 15.9 2.3 4.4 Masraf Al Rayan 3.85 0.00 (7.63) 28,875 13.4 2.1 5.2 Al Khaliji Bank 1.24 1.64 7.45 4,464 7.6 0.8 6.0 Qatar First Bank 0.31 (0.33) (25.25) 610 N/A 0.9 N/A National Leasing 0.70 0.29 (20.71) 345 22.0 0.5 7.2 Dlala Holding 0.63 (1.41) (37.00) 179 N/A 0.9 N/A Qatar & Oman Investment 0.54 7.37 0.94 170 63.4 0.6 5.6 Islamic Holding Group 2.17 6.90 (0.69) 123 230.6 0.9 N/A Banking and Financial Services 295,447 Zad Holding 13.85 (1.07) 33.17 1,993 15.4 2.2 6.1 Qatar German Co. for Medical Devices 0.61 (0.49) 6.89 70 N/A 2.1 N/A Salam International Investment 0.42 3.45 (3.00) 480 N/A 0.4 N/A Medicare Group 8.65 2.73 37.08 2,434 30.0 2.5 20.8 Qatar Cinema & Film Distribution 2.20 (0.45) 15.67 138 17.9 1.0 6.8 Qatar Fuel 22.44 (3.53) 35.19 22,311 18.5 2.7 3.6 Qatar Meat and Livestock 6.83 (1.16) (2.43) 1,229 11.6 3.7 6.6 Mannai Corp. 3.12 (0.95) (43.22) 1,423 5.3 0.6 6.4 Al Meera Consumer Goods 15.22 (1.74) 2.84 3,044 16.5 2.2 5.6 Consumer Goods and Services 33,123 Qatar Industrial Manufacturing 3.35 1.52 (21.55) 1,592 14.1 1.0 7.5 Qatar National Cement 5.73 (1.21) (3.70) 3,745 15.4 1.2 8.7 Industries Qatar 10.11 (0.88) (24.33) 61,166 18.9 1.8 5.9 Qatari Investors Group 1.67 0.00 (39.95) 2,076 16.0 0.7 4.5 Qatar Electricity and Water 16.13 (0.25) (12.81) 17,743 13.4 1.9 4.8 Aamal 0.73 (1.88) (17.42) 4,599 12.6 0.6 8.2 Gulf International Services 1.78 (0.56) 4.71 3,308 N/A 0.9 N/A Mesaieed Petrochemical Holding 2.60 0.39 72.99 32,664 38.2 2.2 3.1 Invesment Holding Group 0.54 0.56 10.22 447 7.3 0.6 4.6 Qatar Aluminum Manufacturing 0.80 (0.99) (39.93) 4,475 N/A N/A 2.5 Industrials 131,815 Qatar Insurance 3.07 (2.23) (14.48) 10,027 17.1 1.2 4.9 Doha Insurance 1.10 4.76 (15.97) 550 8.4 0.5 7.3 Qatar General Insurance & Reinsurance 2.67 3.89 (40.51) 2,336 13.0 0.4 3.8 Al Khaleej Takaful Insurance 2.14 0.00 149.13 546 13.7 1.0 2.3 Qatar Islamic Insurance 6.84 0.59 27.35 1,026 15.6 2.8 5.1 Insurance 14,486 United Development 1.41 (1.40) (4.41) 4,993 13.4 0.5 7.1 Barw a Real Estate 3.41 (0.29) (14.56) 13,269 8.5 0.7 7.3 Ezdan Real Estate 0.63 (0.78) (51.23) 16,790 50.6 0.5 N/A Mazaya Qatar Real Estate Development 0.72 (0.14) (8.08) 830 N/A 0.7 7.0 Real Estate 35,882 Ooredoo 6.94 (3.74) (7.47) 22,230 12.9 1.0 3.6 Vodafone Qatar 1.20 (0.83) (23.18) 5,072 33.9 1.1 4.2 Telecoms 27,303 Qatar Navigation (Milaha) 6.14 0.99 (6.98) 7,032 13.0 0.5 4.9 Gulf Warehousing 5.25 2.54 36.47 308 16.3 1.8 3.6 Qatar Gas Transport (Nakilat) 2.53 0.80 41.10 14,017 14.6 2.2 4.0 Transportation 21,356 Qatar Exchange 562,181
- 7. Contacts Saugata Sarkar, CFA, CAIA Shahan Keushgerian Zaid al-Nafoosi , CMT, CFTe Head of Research Senior Research Analyst Senior Research Analyst Tel: (+974) 4476 6534 Tel: (+974) 4476 6509 Tel: (+974) 4476 6535 saugata.sarkar@qnbfs.com.qa shahan.keushgerian@qnbfs.com.qa zaid.alnafoosi@qnbfs.com.qa Mehmet Aksoy, PhD QNB Financial Services Co. W.L.L. Senior Research Analyst Contact Center: (+974) 4476 6666 Tel: (+974) 4476 6589 PO Box 24025 mehmet.aksoy@qnbfs.com.qa Doha, Qatar Disclaimer and Copyright Notice: This publication has been prepared by QNB Financial Services Co. W.L.L. (“QNB FS”) a wholly-owned subsidiary of Qatar National Bank (Q.P.S.C.). QNB FS is regulated by the Qatar Financial Markets Authority and the Qatar Exchange. Qatar National Bank (Q.P.S.C.) is regulated by the Qatar Central Bank. This publication expresses the views and opinions of QNB FS at a given time only. It is not an offer, promotion or recommendation to buy or sell securities or other investments, nor is it intended to constitute legal, tax, accounting, or financial advice. QNB FS accepts no liability whatsoever for any direct or indirect losses arising from use of this report. Any investment decision should depend on the individual circumstances of the investor and be based on specifically engaged investment advice. We therefore strongly advise potential investors to seek independent professional advice before making any investment decision. Although the information in this report has been obtained from sources that QNB FS believes to be reliable, we have not independently verified such information and it may not be accurate or complete. QNB FS does not make any representations or warranties as to the accuracy and completeness of the information it may contain, and declines any liability in that respect. For reports dealing with Technical Analysis, expressed opinions and/or recommendations may be different or contrary to the opinions/recommendations of QNB FS Fundamental Research as a result of depending solely on the historical technical data (price and volume). QNB FS reserves the right to amend the views and opinions expressed in this publication at any time. It may also express viewpoints or make investment decisions that differ significantly from, or even contradict, the views and opinions included in this report. This report may not be reproduced in whole or in part without permission from QNB FS COPYRIGHT: No part of this document may be reproduced without the explicit written permission of QNB FS. Page 7 of 7