QNBFS Weekly Market Report October 03, 2019
•
0 j'aime•141 vues

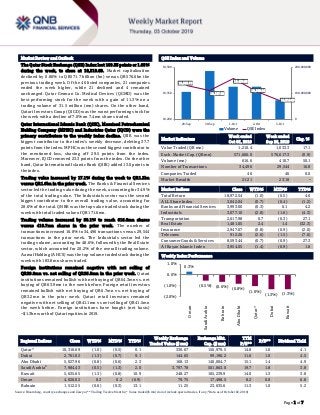
The Qatar Stock Exchange (QSE) Index lost 109.33 points or 1.05% during the week, to close at 10,310.69

Recommandé
Recommandé
Contenu connexe
Plus de QNB Group
Plus de QNB Group (20)
Dernier
Dernier (20)
QNBFS Weekly Market Report October 03, 2019
- 1. ` Page 1 of 7 Market Review and Outlook QSE Index and Volume The Qatar Stock Exchange (QSE) Index lost 109.33 points or 1.05% during the week, to close at 10,310.69. Market capitalization declined by 0.86% to QR571.7 billion (bn) versus QR576.6bn the previous trading week. Of the 46 listed companies, 21 companies ended the week higher, while 21 declined and 4 remained unchanged. Qatar German Co. Medical Devices (QGMD) was the best performing stock for the week with a gain of 11.3% on a trading volume of 31.5 million (mn) shares. On the other hand, Qatari Investors Group (QIGD) was the worst performing stock for the week with a decline of 7.0% on 7.4mn shares traded. Qatar International Islamic Bank (QIIK), Mesaieed Petrochemical Holding Company (MPHC) and Industries Qatar (IQCD) were the primary contributors to the weekly index decline. QIIK was the biggest contributor to the index’s weekly decrease, deleting 37.7 points from the index. MPHC was the second biggest contributor to the mentioned loss, shaving off 29.5 points from the index. Moreover, IQCD removed 23.3 points from the index. On the other hand, Qatar International Islamic Bank (QIIK) added 13.0 points to the index. Trading value increased by 17.1% during the week to QR1.2bn versus QR1.0bn in the prior week. The Banks & Financial Services sector led the trading value during the week, accounting for 34.9% of the total trading value. The Industrials sector was the second biggest contributor to the overall trading value, accounting for 28.6% of the total. QNBK was the top value traded stock during the week with total traded value of QR171.6mn. Trading volume increased by 50.1% to reach 616.6mn shares versus 410.7mn shares in the prior week. The number of transactions increased 16.8% to 34,496 transactions versus 29,544 transactions in the prior week. The Industrials sector led the trading volume, accounting for 48.6%, followed by the Real Estate sector, which accounted for 20.2% of the overall trading volume. AamalHolding (AHCS) was the top volume traded stockduring the week with 183.8mn shares traded. Foreign institutions remained negative with net selling of QR29.8mn vs. net selling of QR25.5mn in the prior week. Qatari institutions remained bullish with net buying of QR64.3mn vs. net buying of QR63.9mn in the week before. Foreign retail investors remained bullish with net buying of QR6.7mn vs. net buying of QR3.2mn in the prior week. Qatari retail investors remained negative with net selling of QR41.1mn vs net selling of QR41.5mn the week before. Foreign institutions have bought (net basis) ~$1.3bn worth of Qatari equities in 2019. Market Indicators Week ended Oct 03, 2019 Week ended Sep 26, 2019 Chg. % Value Traded (QR mn) 1,210.4 1,033.3 17.1 Exch. Market Cap. (QR mn) 571,666.0 576,617.3 (0.9) Volume (mn) 616.6 410.7 50.1 Number of Transactions 34,496 29,544 16.8 Companies Traded 46 46 0.0 Market Breadth 21:21 23:18 – Market Indices Close WTD% MTD% YTD% Total Return 18,972.54 (1.0) (0.5) 4.6 ALL Share Index 3,042.04 (0.7) (0.4) (1.2) Banks and Financial Services 3,993.00 (0.3) 0.1 4.2 Industrials 3,077.10 (2.8) (1.6) (4.3) Transportation 2,617.98 0.7 (0.3) 27.1 Real Estate 1,481.05 2.4 1.4 (32.3) Insurance 2,947.07 (0.8) (0.9) (2.0) Telecoms 912.26 (2.6) (1.5) (7.6) Consumer Goods & Services 8,593.44 (0.7) (0.9) 27.3 Al Rayan Islamic Index 3,954.05 (1.4) (0.9) 1.8 Market Indices Weekly Index Performance Regional Indices Close WTD% MTD% YTD% Weekly Exchange Traded Value ($ mn) Exchange Mkt. Cap. ($ mn) TTM P/E** P/B** Dividend Yield Qatar* 10,310.69 (1.0) (0.5) 0.1 330.67 156,979.5 14.8 1.6 4.1 Dubai 2,761.02 (1.3) (0.7) 9.1 144.65 99,196.2 11.6 1.0 4.5 Abu Dhabi 5,027.96 (0.8) (0.6) 2.3 168.13 140,004.7 15.1 1.4 4.9 Saudi Arabia# 7,984.43 (0.5) (1.3) 2.0 3,797.78 501,863.0 19.7 1.8 3.8 Kuwait 5,635.65 (1.3) (0.8) 10.9 248.27 105,239.9 14.0 1.3 3.8 Oman 4,026.02 0.3 0.2 (6.9) 79.75 17,498.5 8.2 0.8 6.8 Bahrain 1,512.55 (0.6) (0.3) 13.1 11.25 23,635.6 11.3 1.0 5.2 Source: Bloomberg, country exchanges and Zawya (** Trailing Twelve Months; * Value traded ($ mn) do not include special trades, if any; #Data as of October 02, 2019) 10,395.78 10,367.08 10,434.65 10,359.84 10,310.69 0 100,000,000 200,000,000 10,200 10,350 10,500 29-Sep 30-Sep 1-Oct 2-Oct 3-Oct Volume QSE Index 0.3% (0.5%) (0.6%) (0.8%) (1.0%) (1.3%) (1.3%) (2.0%) (1.0%) 0.0% 1.0% Oman SaudiArabia Bahrain AbuDhabi Qatar* Dubai Kuwait
- 2. Page 2 of 7 News Economic, Market & Corporate News Qatar’s PPI falls 16.5% YoY in August this year – Weakened earnings in the hydrocarbons and some manufactured products led Qatar’s PPI (Producers’ Price Index) to drag 16.5% YoY in August 2019, according to the official statistics. Qatar’s PPI – a measure of the average selling prices received by the domestic producers for their output – saw a 1.5% MoM dip, stated the figures released by the Planning and Statistics Authority (PSA). The PSA had released a new PPI series in late 2015. With a base of 2013, it draws on an updated sampling frame and new weights. The previous sampling frame dates from 2006, when the Qatari economy was much smaller than today and the range of products made domestically much narrower. The mining PPI, which carries the maximum weight of 72.7%, fell 1.4% on a monthly basis as crude petroleum and natural gas prices fell in a similar proportion, while that of stone, sand and clay was unchanged in the review period The PPI for mining saw a 17.7% plunge YoY in August 2019 on the back of a 17.7% decrease in the price of crude petroleum and natural gas; even as there was a marginal 0.2% rise in that of stone, sand and clay. The manufacturing sector, which has a weight of 26.8% in the PPI basket, witnessed a 14% yearly plunge this August on a 16.4% contraction in the price of refined petroleum products, 11.3% in basic chemicals, 9.9% in basic metals and 4.5% in cement and other non-metallic mineral products. (Gulf-Times.com) FocusEconomics: Higher public spending, gas output to drive Qatar’s economic growth in 2H2019 – Qatar’s economy is projected to gain momentum in 2H2019 driven mainly by greater public spending and higher gas production, FocusEconomics has stated in its latest report. Focusing on 2020, the report stated, the country’s growth will likely pick up on a stronger energy sector as the Barzan gas facility comes online. According to FocusEconomics Consensus Forecast- Middle East & North Africa for October report, Qatar’s economy likely to have softened in the second quarter, after a recovery in the energy sector drove a slight acceleration in the first quarter. Turning to the third quarter, the report stated, available data points to acceleration. “In July, annual industrial production grew at the fastest pace since August 2018, annual private sector credit growth surged, while building permits also jumped MoM,” it stated. Moreover, the report stated, the non-oil sector PMI recovered firmly in August that bodes well for Qatar’s economic growth ahead. FocusEconomics panelists see growth of 1.9% in 2019 and 2.5% in 2020, which is unchanged from last month’s forecast. The country’s economic growth will further accelerate to 2.7% in 2021 and 2.8% in 2022, the report stated. Consumer prices were flat in annual terms in August, the report stated, adding inflation should return next year as the expected implementation of a 5% VAT in January 2020 will add upward pressure. Moreover, an expected pick-up in economic activity and recent signs of a recovery in housing prices should also stoke prices next year. “Our panelists expect average consumer prices to fall 0.3% in 2019, before increasing 2% in 2020, which is down 0.2 percentage points from last month’s forecast,” the report stated. The report indicated that the GDP per capita in Qatar will increase from $70,550 in 2019 to $80,098 in 2022. According to the annual data released as part of the report, the overnight lending rate in the country would continue to rise from the current level and reach up to 4.81% by 2023. The Qatari Riyal will continue to be pegged at $3.64 in the years to come, the report stated. (Qatar Tribune) Qatar Petroleum announces fuel prices for October – Qatar Petroleum announced the diesel and gasoline prices for October, which will stabilize for gasoline (91) and diesel, while the super gasoline (95) will see a slight increase. Qatar Petroleum has set the price of diesel liter to QR1.85 in October, the same price set for September. The price of super gasoline (95) was set at QR1.85 per liter during October; this was up from QR1.8 in September, an increase of 2.8%. The price of premium gasoline (91) stabilized for the second month in a row, as Qatar Petroleum set its price at QR1.7 per liter in October. (Gulf- Times.com) Qatar Central Bank’s August foreign reserves rise to QR197bn – Qatar Central Bank has published Qatar’s foreign reserves and data on monetary aggregates for August on the website. International reserves and foreign currency liquidity rose to QR197bn from QR196.2bn in July 2019. August M1 money supply declined 1.7% from year ago and 1.2% MoM. Further August M2 money supply falls 5.1% YoY and 0.5% MoM. (Bloomberg) Qatar’s economy performing better after blockade – Qatar has performed better on most of the key economic indicators since blockade, CEOs of prime Qatari entities have said. Speaking at a knowledge sharing session titled ‘Qatar – Land of Opportunities’ organized by Doha Bank, Qatar Financial Centre’s (QFC) CEO, Yousuf Mohamed Al Jaida said that Qatar has performed better in five out of the seven key economic indicators in the post- blockade period of almost two and half years. Comparing pre- blockade period (2014-2016) with post- blockade period (2017- 2019), he said, Qatar’s nominal GDP, non-hydrocarbon growth, hydrocarbon growth, real GDP growth forecast and average annual inflation have fared better in the post- blockade period. Real GDP growth and Qatar Real Estate Price Index are the only two economic indicators where the country witnessed marginal decline, he said. Despite the ongoing blockade imposed on the country, Jaida said, Qatar’s real GDP is forecast to grow at a compound annual growth rate of 2.8% in the next five years, the second fastest in the GCC region. Highlighting the factors impacting Real GDP growth in Qatar, he said, “Qatar’s planned expansion of LNG production and infrastructure projects related to 2020 FIFA World Cup will drive growth in Qatar in the next five years.” (Qatar Tribune) Qatar’s investment in healthcare sector at QR22.7bn – Qatar Chamber’s board member, Ebtihaj Al Ahmadani has said that Qatar’s healthcare spending is among the highest in the Middle East. The country invested QR22.7bn in healthcare sector in 2018, up 4% compared to the previous year, she said. Qatar has been ranked fifth best in the world and the first in the Middle East, according to Legatum Institute, a London-based think- tank which measures improved life expectancy, better health
- 3. Page 3 of 7 outcomes, and investment in health infrastructure, Al Ahmadani said while attending the recently concluded “12th Arab-German Health Forum” in Berlin, Germany. “Within the past two year, Qatar has allocated huge investments in the health sector by providing more 1,100 beds and opening four new health centers,” she added. Addressing the forum, Al Ahmadani said that Qatar’s health system has seen great strides over the past years regarding the number of medical facilities and students as well as the spending on health sector by the government. (Peninsula Qatar) QE Index, QE Al Rayan Islamic Index and QE All Share Index update constituents from October 1 – Ezdan Holding Group and Qatar Aluminium Manufacturing Company replaced Medicare Group and Qatar First Bank in the QE Index. Ezdan Holding Group, Qatar Aluminium Manufacturing Company as well as Qatar Islamic Insurance Company joined QE Al Rayan Islamic Index. Qatar Aluminium Manufacturing Company joined both QE All Share Index and QE Industrials Index. Qatar General Insurance & Reinsurance Company joined both QE All Share Index and QE insurance Index, all effective from October 1, 2019. (QSE) WOQOD adds yet another fuel station to its widening network, inches closer to 2020 goal – Qatar Fuel Company (WOQOD) opened a fuel station in Al Dafna, raising its network of stations to 89. With the new facility, WOQOD has moved a step closer to its objective of opening 114 fuel stations by 2020. The Al Dafna fuel station is spread over 4,200 square meters and has three lanes with nine dispensers. The new station offers round-the- clock services to residents and includes a Sidra convenience store, an LPG cylinder outlet and a shop that sells gasoline and diesel products for light vehicles. WOQOD is currently constructing 22 new petrol stations, a large number of which are expected to become operational in 2019. (Qatar Tribune) Qatar First Bank’s CEO resigns – Qatar First Bank’s board of directors announced that the resignation of Ali Mohammed Al Obaidli from the position of CEO. (QSE) Qatar Central Securities Depository modifies the foreigners’ ownership limit of NLCS – Qatar Central Securities Depository has modified the foreigners’ ownership limit of Alijarah Holding (NLCS) to be 49% of the capital, which is equal to 242,452,980 shares. (QSE)
- 4. Page 4 of 7 Qatar Stock Exchange Top Gainers Top Decliners Source: Qatar Stock Exchange (QSE) Source: Qatar Stock Exchange (QSE) Most Active Shares by Value (QR Million) Most Active Shares by Volume (Million) Source: Qatar Stock Exchange (QSE) Source: Qatar Stock Exchange (QSE) Investor Trading Percentage to Total Value Traded Net Traded Value by Nationality (QR Million) Source: Qatar Stock Exchange (QSE) Source: Qatar Stock Exchange (QSE) 11.3% 8.3% 5.8% 4.5% 3.8% 0.0% 5.0% 10.0% 15.0% Qatari German Co. for Medical Dev. Medicare Group The Group Islamic Insurance Co. United Development Company Qatar Oman Investment Co. -7.0% -6.0% -5.6% -3.7% -3.1% -9.0% -6.0% -3.0% 0.0% QatariInvestors Group GulfInternational Services Mesaieed Petrochemical HoldingCo. Ooredoo QatarIslamicBank 171.6 134.3 72.7 70.8 60.7 0.0 60.0 120.0 180.0 QNB Group Aamal Company Qatar Islamic Bank Qatar Aluminium Manufacturing Company Ezdan Holding Group 183.8 89.2 73.5 31.5 31.1 0.0 70.0 140.0 210.0 Aamal Company Ezdan Holding Group Qatar Aluminium Manufacturing Company QatariGerman Co. for Medical Dev. Qatar First Bank 0% 20% 40% 60% 80% 100% Buy Sell 31.59% 34.99% 31.13% 25.81% 12.26% 11.71% 25.03% 27.49% Qatari Individuals Qatari Institutions Non-Qatari Individuals Non-Qatari Institutions 759 451 736 474 23 (23) (200) - 200 400 600 800 Qatari Non-Qatari Net Investment Total Sold Total Bought
- 5. Page 5 of 7 TECHNICAL ANALYSIS OF THE QSE INDEX Source: Bloomberg The QE Index closed down 1.05% from the previous week, at 10,310.69 points. The Index kept moving inside the corrective channel and bounced off the strong support just at the 9,700 level. We keep our expected weekly-resistance level at 10,800 points and the 9,700 level as our weekly support. DEFINITIONS OF KEY TERMS USED IN TECHNICAL ANALYSIS RSI (Relative Strength Index) indicator – RSI is a momentum oscillator that measures the speedand change of price movements. The RSI oscillates between 0 to 100. The index is deemed to be overbought once the RSI approaches the 70 level, indicating that a correction is likely. On the other hand, if the RSI approaches 30, it is an indication that the index may be getting oversold and therefore likely to bounce back. MACD (Moving Average Convergence Divergence) indicator – The indicator consists of the MACD line and a signal line. The divergence or the convergence of the MACD line with the signal line indicates the strength in the momentum during the uptrend or downtrend, as the case may be. When the MACD crosses the signal line from below and trades above it, it gives a positive indication. The reverse is the situation for a bearish trend. Candlestick chart – A candlestick chart is a price chart that displays the high, low, open, and close for a security. The ‘body’ of the chart is portion between the open and close price, while the high and low intraday movements form the ‘shadow’. The candlestick may represent any time frame. We use a one-day candlestick chart (every candlestick represents one trading day) in our analysis. Doji candlestick pattern – A Doji candlestick is formed when a security's open and close are practically equal. The pattern indicates indecisiveness, and based on preceding price actions and future confirmation, may indicate a bullish or bearish trend reversal. ShootingStar/Inverted Hammer candlestick patterns – These candlestick patterns have a small real body (open price and close price are near to each other), and a long upper shadow (large intraday movement on the upside). The Shooting Star is a bearish reversal pattern that forms after a rally. The Inverted Hammer looks exactly like a Shooting Star, but forms after a downtrend. Inverted Hammers represent a potential bullish trend reversal.
- 6. Page 6 of 7 Source: Bloomberg Company Name Price October 03 % Change WTD % Change YTD Market Cap. QR Million TTM P/E P/B Div. Yield Qatar National Bank 19.30 0.47 (1.03) 178,263 13.9 2.6 3.1 Qatar Islamic Bank 15.50 (3.13) 1.97 36,625 13.9 2.3 3.2 Commercial Bank of Qatar 4.40 (2.22) 11.70 17,808 12.0 1.1 3.4 Doha Bank 2.60 1.56 17.12 8,061 12.2 0.9 3.8 Al Ahli Bank 3.40 (2.86) 33.57 7,867 11.7 1.4 2.7 Qatar International Islamic Bank 8.96 3.11 35.51 13,563 15.9 2.4 4.5 Masraf Al Rayan 3.54 (0.28) (15.07) 26,550 12.4 2.1 5.6 Al Khaliji Bank 1.18 (1.67) 2.25 4,248 7.4 0.7 6.4 Qatar First Bank 0.31 (2.24) (25.00) 612 N/A 0.9 N/A National Leasing 0.70 0.87 (20.82) 344 47.4 0.5 7.2 Dlala Holding 0.69 1.32 (31.10) 196 N/A 0.9 N/A Qatar & Oman Investment 0.52 3.76 (1.87) 165 52.2 0.6 5.7 Islamic Holding Group 1.98 (2.94) (9.38) 112 309.0 0.8 N/A Banking and Financial Services 294,415 Zad Holding 13.50 (2.17) 29.81 1,943 15.0 2.2 6.3 Qatar German Co. for Medical Devices 0.76 11.27 34.28 88 N/A 2.5 N/A Salam International Investment 0.41 1.49 (5.31) 469 N/A 0.4 N/A Medicare Group 7.98 8.28 26.47 2,246 28.6 2.3 22.6 Qatar Cinema & Film Distribution 2.20 0.00 15.67 138 17.6 1.0 6.8 Qatar Fuel 23.09 (1.91) 39.10 22,957 19.1 2.9 3.5 Qatar Meat and Livestock 6.23 2.47 (11.00) 1,121 10.1 3.5 7.2 Mannai Corp. 3.30 0.30 (39.95) 1,505 4.6 0.6 6.1 Al Meera Consumer Goods 15.32 0.46 3.51 3,064 16.7 2.3 5.5 Consumer Goods and Services 33,531 Qatar Industrial Manufacturing 3.61 (2.17) (15.46) 1,715 11.9 1.1 6.9 Qatar National Cement 6.00 (1.32) 0.84 3,921 14.9 1.3 8.3 Industries Qatar 10.80 (1.82) (19.17) 65,340 16.4 2.0 5.6 Qatari Investors Group 1.86 (7.00) (33.12) 2,312 16.7 0.8 4.0 Qatar Electricity and Water 15.50 0.98 (16.22) 17,050 12.7 1.8 5.0 Aamal 0.72 0.00 (18.67) 4,530 11.4 0.6 8.3 Gulf International Services 1.71 (6.04) 0.59 3,178 N/A 0.9 N/A Mesaieed Petrochemical Holding 2.87 (5.59) 90.95 36,056 35.1 2.5 2.8 Invesment Holding Group 0.53 1.94 7.57 437 6.9 0.6 4.8 Qatar Aluminum Manufacturing 0.92 2.00 (31.09) 5,134 N/A N/A 2.2 Industrials 139,673 Qatar Insurance 3.30 (1.79) (8.08) 10,778 18.6 1.3 4.5 Doha Insurance 1.03 (0.96) (21.31) 515 8.5 0.5 7.8 Qatar General Insurance & Reinsurance 3.50 (1.69) (22.01) 3,063 14.4 0.5 2.9 Al Khaleej Takaful Insurance 1.96 3.70 128.17 500 16.1 0.9 2.6 Qatar Islamic Insurance 6.35 5.83 18.23 953 13.6 2.7 5.5 Insurance 15,809 United Development 1.38 4.55 (6.44) 4,886 10.5 0.5 7.2 Barw a Real Estate 3.36 0.30 (15.81) 13,075 8.6 0.7 7.4 Ezdan Real Estate 0.67 0.60 (48.69) 17,666 59.6 0.6 N/A Mazaya Qatar Real Estate Development 0.74 (0.54) (5.13) 857 N/A 0.7 6.8 Real Estate 36,483 Ooredoo 7.11 (3.66) (5.20) 22,775 13.3 1.0 3.5 Vodafone Qatar 1.24 0.00 (20.61) 5,241 35.9 1.2 4.0 Telecoms 28,016 Qatar Navigation (Milaha) 6.64 2.15 0.59 7,604 14.1 0.5 4.5 Gulf Warehousing 5.03 (0.40) 30.75 295 15.7 1.8 3.8 Qatar Gas Transport (Nakilat) 2.38 0.00 32.74 13,186 14.3 2.1 4.2 Transportation 21,085 Qatar Exchange 571,666
- 7. Contacts Saugata Sarkar, CFA, CAIA Shahan Keushgerian Zaid al-Nafoosi , CMT, CFTe Head of Research Senior Research Analyst Senior Research Analyst Tel: (+974) 4476 6534 Tel: (+974) 4476 6509 Tel: (+974) 4476 6535 saugata.sarkar@qnbfs.com.qa shahan.keushgerian@qnbfs.com.qa zaid.alnafoosi@qnbfs.com.qa Mehmet Aksoy, PhD QNB Financial Services Co. W.L.L. Senior Research Analyst Contact Center: (+974) 4476 6666 Tel: (+974) 4476 6589 PO Box 24025 mehmet.aksoy@qnbfs.com.qa Doha, Qatar Disclaimer and Copyright Notice: This publication has been prepared by QNB Financial Services Co. W.L.L. (“QNB FS”) a wholly-owned subsidiary of Qatar National Bank (Q.P.S.C.). QNB FS is regulated by the Qatar Financial Markets Authority and the Qatar Exchange. Qatar National Bank (Q.P.S.C.) is regulated by the Qatar Central Bank. This publication expresses the views and opinions of QNB FS at a given time only. It is not an offer, promotion or recommendation to buy or sell securities or other investments, nor is it intended to constitute legal, tax, accounting, or financial advice. QNB FS accepts no liability whatsoever for any direct or indirect losses arising from use of this report. Any investment decision should depend on the individual circumstances of the investor and be based on specifically engaged investment advice. We therefore strongly advise potential investors to seek independent professional advice before making any investment decision. Although the information in this report has been obtained from sources that QNB FS believes to be reliable, we have not independently verified such information and it may not be accurate or complete. QNB FS does not make any representations or warranties as to the accuracy and completeness of the information it may contain, and declines any liability in that respect. For reports dealing with Technical Analysis, expressed opinions and/or recommendations may be different or contrary to the opinions/recommendations of QNB FS Fundamental Research as a result of depending solely on the historical technical data (price and volume). QNB FS reserves the right to amend the views and opinions expressed in this publication at any time. It may also express viewpoints or make investment decisions that differ significantly from, or even contradict, the views and opinions included in this report. This report may not be reproduced in whole or in part without permission from QNB FS COPYRIGHT: No part of this document may be reproduced without the explicit written permission of QNB FS. Page 7 of 7