QNBFS Weekly Market Report October 1, 2020
•
0 j'aime•152 vues

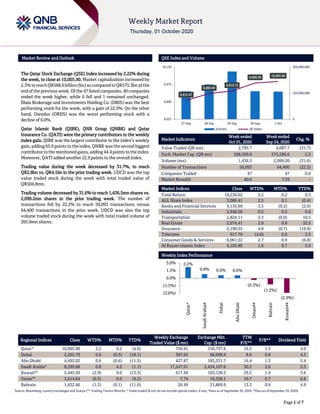
The Qatar Stock Exchange (QSE) Index increased by 2.22% during the week, to close at 10,005.90

Recommandé
Contenu connexe
Tendances
Tendances (20)
Similaire à QNBFS Weekly Market Report October 1, 2020
Similaire à QNBFS Weekly Market Report October 1, 2020 (20)
Plus de QNB Group
Plus de QNB Group (20)
Dernier
Dernier (20)
QNBFS Weekly Market Report October 1, 2020
- 1. `````` Page 1 of 7 Market Review and Outlook QSE Index and Volume The Qatar Stock Exchange (QSE) Index increased by 2.22% during the week, to close at 10,005.90. Market capitalization increased by 2.3% toreachQR588.6billion(bn)ascomparedtoQR575.3bnatthe end of the previous week. Of the 47 listed companies, 40companies ended the week higher, while 6 fell and 1 remained unchanged. Dlala Brokerage and Investments Holding Co. (DBIS) was the best performing stock for the week, with a gain of 22.9%. On the other hand, Ooredoo (ORDS) was the worst performing stock with a decline of 6.0%. Qatar Islamic Bank (QIBK), QNB Group (QNBK) and Qatar Insurance Co. (QATI) were the primary contributors to the weekly index gain. QIBK was the largest contributor to the index’s weekly gain, adding 65.9 points to the index. QNBK was the second biggest contributor to the mentioned gains, adding 44.4points to the index. Moreover, QATI added another 22.9 points to the overall index. Trading value during the week decreased by 31.7%, to reach QR2.8bn vs. QR4.1bn in the prior trading week. UDCD was the top value traded stock during the week with total traded value of QR504.8mn. Trading volume decreased by 31.6% to reach 1,436.5mn shares vs. 2,099.2mn shares in the prior trading week. The number of transactions fell by 22.2% to reach 50,093 transactions versus 64,400 transactions in the prior week. UDCD was also the top volume traded stock during the week with total traded volume of 265.8mn shares. Market Indicators Week ended Oct 01, 2020 Week ended Sep 24, 2020 Chg. % Value Traded (QR mn) 2,793.7 4,087.7 (31.7) Exch. Market Cap. (QR mn) 588,569.0 575,286.6 2.3 Volume (mn) 1,436.5 2,099.20 (31.6) Number of Transactions 50,093 64,400 (22.2) Companies Traded 47 47 0.0 Market Breadth 40:6 7:39 – Market Indices Close WTD% MTD% YTD% Total Return 19,236.02 2.2 0.2 0.3 ALL Share Index 3,086.41 2.5 0.1 (0.4) Banks and Financial Services 4,135.69 3.5 (0.2) (2.0) Industrials 2,949.58 0.5 0.5 0.6 Transportation 2,824.11 2.3 (0.0) 10.5 Real Estate 2,074.41 2.9 0.8 32.5 Insurance 2,190.35 4.8 (0.7) (19.9) Telecoms 917.70 (4.6) 0.6 2.5 Consumer Goods & Services 8,061.22 2.7 0.9 (6.8) Al Rayan Islamic Index 4,183.80 1.6 0.7 5.9 Weekly Index Performance Regional Indices Close WTD% MTD% YTD% Weekly Exchange Traded Value ($ mn) Exchange Mkt. Cap. ($ mn) TTM P/E** P/B** Dividend Yield Qatar* 10,005.90 2.2 0.2 (4.0) 759.91 159,737.6 16.3 1.5 4.0 Dubai 2,265.70 0.6 (0.3) (18.1) 307.65 86,008.9 8.6 0.8 4.3 Abu Dhabi 4,492.02 0.6 (0.6) (11.5) 427.87 183,331.7 16.4 1.3 5.4 Saudi Arabia# 8,299.08 0.8 4.5 (1.1) 17,247.91 2,434,107.6 30.3 2.0 2.5 Kuwait## 5,445.20 (2.9) 0.0 (13.3) 617.49 103,128.5 29.2 1.4 3.6 Oman## 3,614.64 (0.3) 0.0 (9.2) 7.74 16,328.1 10.7 0.7 6.8 Bahrain 1,432.46 (1.2) (0.1) (11.0) 26.49 21,869.9 13.3 0.9 4.9 Source: Bloomberg, country exchanges and Zawya (** Trailing Twelve Months; * Value traded ($ mn) do not include special trades, if any; #Data as of September 30, 2020, ##Data as of September 29, 2020) 9,815.47 9,883.90 9,910.72 9,990.39 10,005.90 0 225,000,000 450,000,000 9,625 9,800 9,975 10,150 27-Sep 28-Sep 29-Sep 30-Sep 1-Oct Volume QE Index 2.2% 0.8% 0.6% 0.6% (0.3%) (1.2%) (2.9%) (3.0%) (1.5%) 0.0% 1.5% 3.0% Qatar* SaudiArabia# Dubai AbuDhabi Oman## Bahrain Kuwait##
- 2. Page 2 of 7 News Economic & Market/Corporate News Qatar’s general PPI rises 4.9% MoM in August – Qatar’s General Producer Price Index (PPI) of August increased by 4.9% when compared with previous month, the Planning and Statistics Authority (PSA) said yesterday. Producer price index covers goods relating to mining (weight: 72.7%), manufacturing (weight: 26.8%), and electricity and water (weight: 0.5%). In terms of mining, the PPI for August showed an increase of 7.1% when compared to July, primarily due to the increase in price of crude petroleum and natural gas by 7.1%. In terms of manufacturing, an increase of 2.2% was recorded in August, when compared with the previous month. In terms of electricity and Water, the PPI showed an increase of 2.1% in August compared to July, resulting from a rise in water by 2.2%, and electricity by 1.8%. (Gulf-Times.com) QCB’s August foreign reserves rise MoM & YoY to QR203.7bn – Qatar Central Bank (QCB) has published Qatar’s foreign reserves for August on its website. International reserves and foreign currency liquidity rose to QR203.7bn from QR203.5bn in July. Reserves were up 3.4% from the same period last year. Gold was up 3.6% MoM and 53% YoY to QR11.5bn. Other reserves of assets was unchanged MoM, while it was up 0.5% YoY to QR55.9bn. (Bloomberg) Qatar records 10.7% MoM increase in surplus of trade balance in August – Qatar recorded 10.7% MoM increase in its foreign merchandise balance for August 2020 to reach nearly QR0.7bn, according to preliminary figures released by the Planning and Statistics Authority (PSA). In August 2020, the total exports of goods (including exports of goods of domestic origin and re- exports) amounted to around QR14.0bn, showing a decrease of 33.8% compared to August 2019, and a 3.3% increase compared to July 2020. On other hand, the imports of goods in August 2020 amounted to around QR7.1bn, showing a decrease of 21.6% over August 2019. On a MoM basis, the imports decrease by 3.0% compared to July 2020. In August 2020, the foreign merchandise trade balance, which represents the difference between total exports and imports, showed a surplus of QR6.9bn, or a decrease of about QR5.2bn or 42.9% compared to August 2019, and increased by nearly QR0.7bn or 10.7% compared to July 2020. The YoY (August 2020 to August 2019) decrease in total exports was mainly due to lower exports of petroleum gases and other gaseous hydrocarbons (LNG, condensates, propane, and butane, among others) reaching QR7.7bn approximately in August 2020, or a decrease of 41.6%. Petroleum oils and oils from bituminous minerals (crude) reaching QR2.4bn decreased by 29.5%, and decrease in the petroleum oils and oils from bituminous minerals (not crude) reaching QR1.3bn, decreased by 7.2%. (Gulf-Times.com) Moody’s: Qatar expected to retire debt using accumulated contingency reserve funds – Qatar is expected to retire debt using accumulated contingency reserve funds, global rating agency Moody’s said and noted it understands that Qatar’s government has now approved a plan to use $20bn (or 13% of 2020 GDP) to reduce its gross borrowing requirement during 2020-21. According to Moody’s, Qatar will reduce its debt burden below 50% of GDP from an estimated peak of around 68% of GDP in 2020 through the combination of announced fiscal consolidation measures and a planned debt reduction exercise, which will draw on the government’s accumulated contingency reserves. Recently, Moody’s affirmed Qatar’s long- term issuer and foreign-currency senior unsecured debt ratings at ‘Aa3’ and maintained the ‘Stable’ outlook. The increase in government debt during 2018-19, prior to the coronavirus shock, Moody’s noted was exclusively due to the government’s decision to borrow in excess of its budget financing needs. Despite small fiscal surpluses in both 2018 and 2019 (averaging 1.6% of GDP) and a very modest external debt repayment schedule ($3bn), the government raised $33.5bn from external borrowing during those two years, including $24bn from large multi-tranche issuances of international bonds. While this has facilitated a small reduction in domestic debt, Moody’s assumes that most of this borrowing has been saved as part of contingency reserve funds of the Ministry of Finance with the intention to build precautionary buffers and use some of this saving for the repayment of large external maturities ($10.9bn) in 2020 while also taking advantage of favorable external financing conditions. (Gulf-Times.com) Medicare Group discloses a court ruling – Medicare Group discloses that the company has been informed by the external law firm that a court judgment issued this on September 30, 2020 in the civil lawsuit No. 4048/2017 filed by the company against the National Health Insurance Company - SEHA (under liquidation) and other defendants, requesting the court to oblige the defendants to: Pay Medicare Group the outstanding amounts for the health services provided by the company to the insured citizens pursuant to the agreement signed between the parties, in addition to the demurrages due to delay in payment. To nullify the decision of liquidating the first defendant. Declare the first defendant’s bankruptcy. The court has issued the following Verdict: (1) Not to accept the case against the second and third litigants. (2) Oblige the first defendant (National Health Insurance Company) to pay the plaintiff an amount of QR125,683,595 and the amount of QR5,000,000 as compensation. (3) Reject the other demands. (4) Oblige the defendant to pay the expenses. (QSE) Milaha signs key deal with Schlumberger – Qatar Navigation (Milaha) has entered into a formal agreement to cooperate with leading American oilfield services firm, Schlumberger. The Offshore & Marine pillar of Milaha signed a Memorandum of Understanding (MoU) that will support value building projects while jointly driving ‘Tawteen’ initiatives for Qatar. Led by Qatar Petroleum, the Tawteen program aims to localize the energy sector’s supply chain and create new investment opportunities to retain ‘economic value’ in Qatar. Signed as a five-year joint development project, it will include a Qatar- owned, Qatar-flagged and Qatar-operated oil well stimulation vessel. The first of these vessels will be designed and outfitted in the country, creating the inaugural ‘FLEXSTIM’ platform, which will be modified, owned and operated locally. Pre- engineering for this significant scheme has already begun and
- 3. Page 3 of 7 will evolve during the final quarter of 2020. The resulting Qatar- owned value chain will be a joint service that enhances the expertise of a global multinational service firm like Schlumberger as well as the leading Qatar-based multi- disciplined local service company like Milaha. With over 70 years of presence in Qatar, Schlumberger supplies the petroleum industry with several key services such as seismic acquisition and processing, well testing and directional drilling, artificial lifts, well completions and groundwater extraction. (Gulf-Times.com) QIIK CEO: Umnia Bank to have 10 branches in Morocco by July- end – Umnia Bank will have 10 branches in Morocco by July- end, said Qatar International Islamic Bank’s (QIIK) CEO, Abdulbasit Ahmad Al-Shaibei, which is the key joint venture partner in the pioneering Islamic bank in the North African Kingdom. Umnia Bank is the result of a partnership among QIIK, Credit immobilier et hotelier (CIH) and Moroccan Deposit and Management Fund. “Umnia Bank has already opened three branches in Morocco; in Casablanca and Rabat. We see Morocco as our gateway to North Africa. There is a huge potential for Islamic banking in North Africa. There is a huge market waiting to be tapped in North Africa, which is in need of Shari’ah-based, value-driven banking,” Al-Shaibei told Gulf Times in an interview. Asked whether the general economic slowdown and the regional tension would result in a sluggish growth for Islamic banking, Al-Shaibei said, “Islamic banking has already got a significant market share in the GCC region. Beyond our borders, there are good prospects for Islamic banking.” Umnia Bank’s Board of Directors recently held a meeting, chaired by Chairman of the board, Sheikh Dr Khalid bin Thani bin Abdullah Al-Thani, in the presence of Vice Chairman, Lotfi Al-Saqat , and other board members in order to discuss the bank’s results for the first half of 2020 as well as the bank’s business strategy for the coming period. Sheikh Dr Khalid expressed his satisfaction with the results of Umnia Bank during the past period, as the bank was able to abridge many stages and achieve an optimistic expansion with some 35 branches to date across various cities and regions of the Kingdom of Morocco. This expansion undoubtedly reflects the great demand for the bank’s services and the opportunities inherent in the Moroccan market for Islamic banking services. (Gulf-Times.com)
- 4. Page 4 of 7 Qatar Stock Exchange Top Gainers Top Decliners Source: Qatar Stock Exchange (QSE) Source: Qatar Stock Exchange (QSE) Most Active Shares by Value (QR Million) Most Active Shares by Volume (Million) Source: Qatar Stock Exchange (QSE) Source: Qatar Stock Exchange (QSE) Investor Trading Percentage to Total Value Traded Net Traded Value by Nationality (QR Million) Source: Qatar Stock Exchange (QSE) Source: Qatar Stock Exchange (QSE) 22.9% 15.2% 10.8% 10.1% 8.6% 0.0% 8.0% 16.0% 24.0% Dlala Brokerage & Investment Holding Company Medicare Group Qatari German Company for Medical Devices Mazaya Qatar Real Estate Development Baladna -6.0% -5.6% -2.9% -0.7% -0.6% -9.0% -6.0% -3.0% 0.0% Ooredoo Qatar General Insurance & Reinsurance Company Zad Holding Company Qatar National Cement Company Industries Qatar 504.8 170.0 151.4 150.5 141.8 0.0 200.0 400.0 600.0 United Development Company QNB Group Investment Holding Group Baladna Mazaya Qatar Real Estate Development 265.8 245.1 121.0 108.8 76.1 0.0 100.0 200.0 300.0 United Development Company Investment Holding Group Mazaya Qatar Real Estate Development Qatar Aluminium Manufacturing Company Alijarah Holding 0% 20% 40% 60% 80% 100% Buy Sell 48.45% 53.79% 23.08% 18.61% 15.00% 15.20% 13.47% 12.40% Qatari Individuals Qatari Institutions Non-Qatari Individuals Non-Qatari Institutions 1,998 795 2,023 771 -24 24 -500 0 500 1,000 1,500 2,000 2,500 Qatari Non-Qatari Net Investment Total Sold Total Bought
- 5. Page 5 of 7 TECHNICAL ANALYSIS OF THE QSE INDEX Source: Bloomberg The QE Index gained 2.22% over the week and closed at 10,005.9, just around our psychological level the 10,000 points. We proposed a possible pullback on the Index once it confirms the breach below the rising-wedge price formation. However, the Index has tested that barrier but managed to stay inside the formation. The main trend remains up and intact, and the only case for a correction is when the Index manages to breach below the mentioned price formation. We update our resistance (once the 10,000 is breached upwards) to the 10,300 points. And our support is updated towards the 9,500 level. DEFINITIONS OF KEY TERMS USED IN TECHNICAL ANALYSIS RSI (Relative Strength Index) indicator – RSI is a momentum oscillator that measures the speedand change of price movements. The RSI oscillates between 0 to 100. The index is deemed to be overbought once the RSI approaches the 70 level, indicating that a correction is likely. On the other hand, if the RSI approaches 30, it is an indication that the index may be getting oversold and therefore likely to bounce back. MACD (Moving Average Convergence Divergence) indicator – The indicator consists of the MACD line and a signal line. The divergence or the convergence of the MACD line with the signal line indicates the strength in the momentum during the uptrend or downtrend, as the case may be. When the MACD crosses the signal line from below and trades above it, it gives a positive indication. The reverse is the situation for a bearish trend. Candlestick chart – A candlestick chart is a price chart that displays the high, low, open, and close for a security. The ‘body’ of the chart is portion between the open and close price, while the high and low intraday movements form the ‘shadow’. The candlestick may represent any time frame. We use a one-day candlestick chart (every candlestick represents one trading day) in our analysis. Doji candlestick pattern – A Doji candlestick is formed when a security's open and close are practically equal. The pattern indicates indecisiveness, and based on preceding price actions and future confirmation, may indicate a bullish or bearish trend reversal. ShootingStar/Inverted Hammer candlestick patterns – These candlestick patterns have a small real body (open price and close price are near to each other), and a long upper shadow (large intraday movement on the upside). The Shooting Star is a bearish reversal pattern that forms after a rally. The Inverted Hammer looks exactly like a Shooting Star, but forms after a downtrend. Inverted Hammers represent a potential bullish trend reversal.
- 6. Page 6 of 7 Source: Bloomberg Company Name Price October 01 % Change WTD % Change YTD Market Cap. QR Million TTM P/E P/B Div. Yield Qatar National Bank 18.00 3.75 (12.58) 166,256 14.3 2.4 3.3 Qatar Islamic Bank 16.75 5.02 9.26 39,579 14.0 2.4 3.1 Commercial Bank of Qatar 4.08 3.69 (13.30) 16,493 9.3 0.9 4.9 Doha Bank 2.34 1.78 (7.59) 7,249 13.9 0.8 N/A Al Ahli Bank 3.29 2.49 (1.30) 7,994 13.1 1.4 4.3 Qatar International Islamic Bank 8.45 2.82 (12.69) 12,794 14.5 2.2 5.0 Masraf Al Rayan 4.15 1.37 4.70 31,095 14.2 2.3 5.4 Al Khaliji Bank 1.63 1.69 24.05 5,850 9.8 1.0 4.6 Qatar First Bank 1.32 2.57 60.76 921 N/A 1.9 N/A National Leasing 1.18 7.45 67.66 585 21.8 0.9 4.2 Dlala Holding 2.14 22.88 250.74 609 N/A 3.0 N/A Qatar & Oman Investment 0.87 2.60 29.60 273 32.9 0.9 2.3 Islamic Holding Group 4.40 3.73 131.47 249 81.2 1.8 N/A Banking and Financial Services 289,945 Zad Holding 14.83 (2.95) 7.31 3,515 17.3 2.4 5.7 Qatar German Co. for Medical Devices 2.38 10.82 308.42 275 N/A 9.3 N/A Salam International Investment 0.62 2.65 19.73 708 N/A 0.5 N/A Baladna 2.23 8.63 122.70 4,234 N/A 1.9 0.9 Medicare Group 8.36 15.15 (1.07) 2,353 32.5 2.4 21.5 Qatar Cinema & Film Distribution 3.81 2.72 73.23 239 52.2 1.8 2.6 Qatar Fuel 17.70 2.61 (22.71) 17,598 18.7 2.3 4.5 Qatar Meat and Livestock 7.17 3.75 6.05 1,290 15.1 3.7 4.2 Mannai Corp. 3.19 6.27 3.51 1,454 N/A 0.7 6.3 Al Meera Consumer Goods 19.83 0.15 29.61 3,966 20.0 2.9 4.3 Consumer Goods and Services 35,632 Qatar Industrial Manufacturing 3.35 0.00 (6.30) 1,590 17.0 1.0 4.5 Qatar National Cement 3.86 (0.75) (31.68) 2,523 18.3 0.9 7.8 Industries Qatar 9.91 (0.55) (3.65) 59,925 38.0 1.9 4.0 Qatari Investors Group 1.99 4.74 11.17 2,474 24.5 0.9 2.8 Qatar Electricity and Water 16.86 1.57 4.79 18,546 12.8 2.2 4.6 Aamal 0.94 1.95 15.62 5,922 37.0 0.8 4.3 Gulf International Services 1.59 1.53 (7.62) 2,953 42.8 0.8 N/A Mesaieed Petrochemical Holding 2.09 1.06 (16.73) 26,257 25.5 1.7 3.3 Invesment Holding Group 0.62 1.31 10.11 515 12.0 0.6 N/A Qatar Aluminum Manufacturing 1.02 1.79 30.73 5,697 N/A 1.0 1.0 Industrials 126,402 Qatar Insurance 2.25 7.80 (28.70) 7,359 N/A 1.0 6.7 Doha Insurance 1.20 3.91 (0.42) 598 13.6 0.6 6.7 Qatar General Insurance & Reinsurance 2.03 (5.58) (17.48) 1,776 N/A 0.4 N/A Al Khaleej Takaful Insurance 1.92 4.79 (3.80) 491 15.2 0.9 2.6 Qatar Islamic Insurance 6.35 1.16 (4.97) 952 14.0 2.6 5.9 Insurance 11,176 United Development 1.88 1.62 23.68 6,657 29.5 0.6 2.7 Barw a Real Estate 3.51 3.42 (0.82) 13,662 8.6 0.7 5.7 Ezdan Real Estate 1.96 2.56 219.35 52,095 1061.6 1.6 N/A Mazaya Qatar Real Estate Development 1.19 10.09 65.37 1,376 53.7 0.1 N/A Real Estate 73,790 Ooredoo 6.69 (6.03) (5.49) 21,433 12.8 1.0 3.7 Vodafone Qatar 1.29 (0.39) 11.21 5,453 37.5 1.2 3.9 Telecoms 26,885 Qatar Navigation (Milaha) 5.98 1.30 (1.98) 6,847 12.8 0.5 5.0 Gulf Warehousing 5.10 1.76 (6.97) 299 12.6 1.7 3.9 Qatar Gas Transport (Nakilat) 2.69 3.07 12.55 14,903 13.9 2.5 3.7 Transportation 22,050 Qatar Exchange 588,569
- 7. Contacts Saugata Sarkar, CFA, CAIA Shahan Keushgerian Zaid al-Nafoosi , CMT, CFTe Head of Research Senior Research Analyst Senior Research Analyst Tel: (+974) 4476 6534 Tel: (+974) 4476 6509 Tel: (+974) 4476 6535 saugata.sarkar@qnbfs.com.qa shahan.keushgerian@qnbfs.com.qa zaid.alnafoosi@qnbfs.com.qa Mehmet Aksoy, PhD QNB Financial Services Co. W.L.L. Senior Research Analyst Contact Center: (+974) 4476 6666 Tel: (+974) 4476 6589 PO Box 24025 mehmet.aksoy@qnbfs.com.qa Doha, Qatar Disclaimer and Copyright Notice: This publication has been prepared by QNB Financial Services Co. W.L.L. (“QNB FS”) a wholly-owned subsidiary of Qatar National Bank (Q.P.S.C.). QNB FS is regulated by the Qatar Financial Markets Authority and the Qatar Exchange. Qatar National Bank (Q.P.S.C.) is regulated by the Qatar Central Bank. This publication expresses the views and opinions of QNB FS at a given time only. It is not an offer, promotion or recommendation to buy or sell securities or other investments, nor is it intended to constitute legal, tax, accounting, or financial advice. QNB FS accepts no liability whatsoever for any direct or indirect losses arising from use of this report. Any investment decision should depend on the individual circumstances of the investor and be based on specifically engaged investment advice. We therefore strongly advise potential investors to seek independent professional advice before making any investment decision. Although the information in this report has been obtained from sources that QNB FS believes to be reliable, we have not independently verified such information and it may not be accurate or complete. QNB FS does not make any representations or warranties as to the accuracy and completeness of the information it may contain, and declines any liability in that respect. For reports dealing with Technical Analysis, expressed opinions and/or recommendations may be different or contrary to the opinions/recommendations of QNB FS Fundamental Research as a result of depending solely on the historical technical data (price and volume). QNB FS reserves the right to amend the views and opinions expressed in this publication at any time. It may also express viewpoints or make investment decisions that differ significantly from, or even contradict, the views and opinions included in this report. This report may not be reproduced in whole or in part without permission from QNB FS COPYRIGHT: No part of this document may be reproduced without the explicit written permission of QNB FS. Page 7 of 7