QNBFS Weekly Market Report October 17, 2019
•
0 j'aime•94 vues

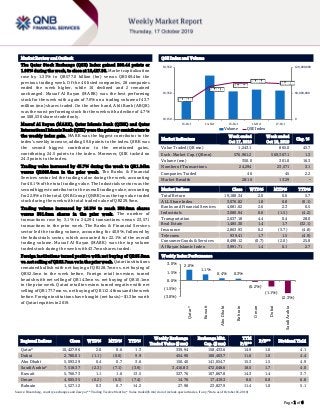
The Qatar Stock Exchange (QSE) Index gained 200.44 points or 1.96% during the week, to close at 10,427.96

Recommandé
Recommandé
Contenu connexe
Plus de QNB Group
Plus de QNB Group (20)
Dernier
Dernier (20)
QNBFS Weekly Market Report October 17, 2019
- 1. ` Page 1 of 6 Market Review and Outlook QSE Index and Volume The Qatar Stock Exchange (QSE) Index gained 200.44 points or 1.96% during the week, to close at 10,427.96. Market capitalization rose by 1.33% to QR577.0 billion (bn) versus QR569.4bn the previous trading week. Of the 46 listed companies, 28 companies ended the week higher, while 16 declined and 2 remained unchanged. Masraf Al Rayan (MARK) was the best performing stock for the week with a gain of 7.0% on a trading volume of 43.7 million (mn) shares traded. On the other hand, Ahli Bank (ABQK) was the worst performing stockfor the weekwith a decline of 4.7% on 508,536 shares traded only. Masraf Al Rayan (MARK), Qatar Islamic Bank (QIBK) and Qatar International Islamic Bank (QIIK) were the primary contributors to the weekly index gain. MARK was the biggest contributor to the index’s weekly increase, adding 59.6 points to the index. QIBK was the second biggest contributor to the mentioned gains, contributing 24.5 points to the index. Moreover, QIIK tacked on 24.3 points to the index. Trading value increased by 43.7% during the week to QR1.24bn versus QR865.0mn in the prior week. The Banks & Financial Services sector led the trading value during the week, accounting for 40.1% of the total trading value. The Industrials sector was the second biggest contributor to the overall trading value, accounting for 22.9% of the total. QNB Group (QNBK) was the top value traded stock during the week with total traded value of QR229.9mn. Trading volume increased by 16.3% to reach 350.0mn shares versus 301.0mn shares in the prior week. The number of transactions rose by 3.1% to 24,294 transactions versus 23,571 transactions in the prior week. The Banks & Financial Services sector led the trading volume, accounting for 40.9%, followed by the Industrials sector, which accounted for 22.1% of the overall trading volume. Masraf Al Rayan (MARK) was the top volume traded stock during the week with 43.7mn shares traded. Foreign institutions turned positive with net buying of QR63.3mn vs. netselling of QR62.7mn vs inthe prior week. Qatariinstitutions remained bullish with net buying of QR128.7mn vs. net buying of QR52.5mn in the week before. Foreign retail investors turned bearish with net selling of QR14.3mn vs. net buying of QR10.1mn in the prior week. Qatari retail investors turned negative with net selling of QR177.7mn vs. netbuying of QR112.4 thousand the week before. Foreign institutions have bought (net basis) ~$1.3bn worth of Qatari equities in 2019. Market Indicators Week ended Oct 17, 2019 Week ended Oct 10, 2019 Chg. % Value Traded (QR mn) 1,243.1 865.0 43.7 Exch. Market Cap. (QR mn) 576,961.2 569,367.1 1.3 Volume (mn) 350.0 301.0 16.3 Number of Transactions 24,294 23,571 3.1 Companies Traded 46 45 2.2 Market Breadth 28:16 13:29 – Market Indices Close WTD% MTD% YTD% Total Return 19,188.34 2.0 0.6 5.7 ALL Share Index 3,076.82 1.8 0.8 (0.1) Banks and Financial Services 4,081.62 2.6 2.3 6.5 Industrials 3,080.94 0.6 (1.5) (4.2) Transportation 2,637.18 4.4 0.4 28.0 Real Estate 1,485.30 1.4 1.7 (32.1) Insurance 2,863.93 0.2 (3.7) (4.8) Telecoms 939.41 1.7 1.5 (4.9) Consumer Goods & Services 8,498.12 (0.7) (2.0) 25.8 Al Rayan Islamic Index 3,991.71 1.4 0.1 2.7 Market Indices Weekly Index Performance Regional Indices Close WTD% MTD% YTD% Weekly Exchange Traded Value ($ mn) Exchange Mkt. Cap. ($ mn) TTM P/E** P/B** Dividend Yield Qatar* 10,427.96 2.0 0.6 1.3 339.94 158,433.6 14.9 1.6 4.1 Dubai 2,780.01 (1.1) (0.0) 9.9 454.90 100,403.7 11.6 1.0 4.4 Abu Dhabi 5,093.29 0.4 0.7 3.6 150.40 141,054.7 15.3 1.5 4.9 Saudi Arabia# 7,518.37 (2.3) (7.1) (3.9) 3,416.83 472,048.6 18.5 1.7 4.0 Kuwait 5,766.73 1.1 1.6 13.5 327.76 107,867.8 14.3 1.4 3.7 Oman 4,005.35 (0.2) (0.3) (7.4) 14.76 17,419.3 8.0 0.8 6.8 Bahrain 1,527.12 0.3 0.7 14.2 27.98 23,827.9 11.4 1.0 5.1 Source: Bloomberg, country exchanges and Zawya (** Trailing Twelve Months; * Value traded ($ mn) do not include special trades, if any; #Data as of October 16, 2019) 10,284.61 10,404.12 10,430.42 10,434.49 10,427.96 0 60,000,000 120,000,000 10,150 10,350 10,550 13-Oct 14-Oct 15-Oct 16-Oct 17-Oct Volume QSE Index 2.0% 1.1% 0.4% 0.3% (0.2%) (1.1%) (2.3%)(3.0%) (1.5%) 0.0% 1.5% 3.0% Qatar* Kuwait AbuDhabi Bahrain Oman Dubai SaudiArabia
- 2. Page 2 of 6 News Economic News Qatar’s September consumer prices rise 0.06% YoY and fall 0.75% MoM – The Planning and Statistics Authority (PSA) has released the Consumer Price Index (CPI) for the month of September 2019. The CPI of September 2019 reached to 108.42 point (base year is 2013), showing a decrease of 0.75% when compared to CPI of August 2019. An analysis on MoM basis showed that there are three main groups, where respective indices in this month have decreased, namely: Transport by 4.46%, Housing, Water, Electricity & other Fuel by 0.20%, and Food & Beverages by 0.07%. Compared to CPI of September 2018, an increase of 0.06% has been recorded in the general index (CPI) of this month. A comparison of the CPI, September 2019 with the CPI, September 2018 (Annual Change), an increase has been recorded in the general index (CPI), by 0.06%. This YoY price increase primary due to the increasing prices seen in the six groups, namely: Tobacco by 127.19%, Miscellaneous Goods and Services by 4.38%, Restaurants and Hotels by 1.43%, Communication by 1.26%, Food& Beverages by 0.99%, Education by 0.93%. (PSA) Nearly 83% jump in new building permits issued in September – Qatar’s building and construction sector continues to remain robust allaying concerns with regard to gaps in supply and demand equilibrium. The number of new building permits issued in September surged to 758, witnessed a remarkable jump of nearly 83% MoM compared to 415 permits issued in the previous month, latest official data showed. September saw one of the highest numbers of building permits issued in a month, at least for over the last couple of years, and the second highest number for the year 2019 only after January 2019 with the highest 790 building certificates issued for the year, according to data released by the Planning and Statistics Authority. When analyzed on YoY basis, the September number inched up more than three percent compared to 735 new building permits issued in the corresponding month last year (September 2018). In terms of type of permits issued, data indicates that the new building permits (residential and non-residential) constitutes 50% (379 permits) of the total building permitsissued during the month of September 2019, while the percentage of additions permits constituted 45% (341 permits), and finally fencing permits with 5% (38 permits). By analyzing new residential buildings permits data, we find that villas’ top the list, accounting for 74% (228 permits) of all new residential buildings permits, followed by dwellings of housing loans permits by 18% (55 permits) and apartments buildings by 7% (21 permits). (Peninsula Qatar) FocusEconomics: Qatar’s merchandise trade balance to scale up to $51bn in 2023 – Qatar’s merchandise trade balance will scale up to $51bn in 2023 from $45.5bn this year, researcher FocusEconomics has stated in a report. The country’s fiscal balance as a percentage of GDP is set to rise to 3.5% in 2023 from an estimated 0.8% this year, FocusEconomics stated. The current account balance (as a percentage of the country’s GDP) will be 5% in 2023 compared with 6.3% in 2019. Qatar’s GDP is expected to reach $233bn by 2023. By the year-end, Qatar’s GDP may total $194bn. Qatar’s economic growth in terms of nominal GDP will reach 4.7% in 2023 from 1.7% by the year-end. The researcher stated Qatar’s public debt will fall gradually until 2023, and is estimated to be 53.4% this year, 50.3% (in 2020), 47.9% (in 2021), 46.1% (in 2022) and 44.3% (in 2023). International reserves may exceed $38.3bn in 2023, from the current $37.7bn; FocusEconomics estimated it will cover 11 months of country’s imports by then. The country’s inflation, the report noted, will be 1.9% in 2023 and -0.3% this year. Qatar’s unemployment rate (as a percentage of active population) will remain a meager 0.2% in 2023, unchanged from this year. The economy likely softened in the second quarter, after a recovery in the energy sector drove a slight acceleration in the first quarter, FocusEconomics stated. Annual industrial production rebounded in June on higher crude oil and natural gas extraction. (Gulf-Times.com) Fitch assigns QNB Indonesia first-time 'AAA (idn)' rating with outlook ‘Stable’ – Fitch Ratings Indonesia has assigned PT Bank QNB Indonesia Tbk a National Long-Term Rating of 'AAA(idn)'. The outlook is ‘Stable’. 'AAA' National Long-Term Ratings denote the highest rating assigned by the agency in its National Rating scale for that country. This rating is assigned to issuers or obligations with the lowest expectation of default risk relative to all other issuers or obligations in the same country or monetary union. (Bloomberg) Fitch affirms QIIK’s ratings at ‘A’ with a 'Stable' outlook – Qatar International Islamic Bank (QIIK) announced that Fitch Ratings (Fitch) has affirmed the bank's rating at ‘A’ with a ‘Stable’ outlook, which once again highlights the strength of the bank's various indicators, its financial position and conformity to Qatar’s economic potential. In affirming the QIIK’s rating, Fitch identified several features, most important being the strength of the bank's position among Islamic banks, its assets’ quality, strong profitability, quality of financing portfolio, growth in operational profits, improvement in operational efficiency and strong presence in the local retail sector. Fitch pointed out that the strength of the Qatari economy and its classification, besides the Qatari Government support to the banking sector including the QIIK whenever required, were the important factors in affirming the QIIK rating at ‘A’. (QSE) QFMA approves the IPO of Baladna – Qatar Financial Markets Authority (QFMA) has approved the Initial Public Offering (IPO) of Baladna (Qatari shareholding company-under incorporation). The QFMA stated that company will start the IPO process after the completion of all legal requirements, the provision of the prospectus and all relevant data, as well as making it available for those wishing to invest before the start of the IPO. The offer is expected to bring depth and diversity for the market, which has been witnessing steady interests from foreign investors since the global index compilers MSCI, Standard & Poor's Dow Jones and FTSE Russell upgraded Qatar to emerging market in view of progressive reforms. (QSE, Gulf- Times.com)
- 3. Page 3 of 6 Qatar Stock Exchange Top Gainers Top Decliners Source: Qatar Stock Exchange (QSE) Source: Qatar Stock Exchange (QSE) Most Active Shares by Value (QR Million) Most Active Shares by Volume (Million) Source: Qatar Stock Exchange (QSE) Source: Qatar Stock Exchange (QSE) Investor Trading Percentage to Total Value Traded Net Traded Value by Nationality (QR Million) Source: Qatar Stock Exchange (QSE) Source: Qatar Stock Exchange (QSE) 7.0% 6.0% 5.1% 5.0% 4.8% 0.0% 3.0% 6.0% 9.0% Masraf Al Rayan Qatar Gas Transport Co. Ltd. Al Khaleej Takaful Insurance Co. Qatar International Islamic Bank Gulf International Services -4.7% -4.1% -3.9% -2.9% -2.7% -6.0% -4.0% -2.0% 0.0% AhliBank QatariGermanCo. forMedical Dev. Mesaieed Petrochemical HoldingCo. EzdanHolding Group The Group Islamic Insurance Co. 229.9 171.3 163.7 113.4 58.5 0.0 80.0 160.0 240.0 QNB Group Qatar International Islamic Bank Masraf Al Rayan Qatar Islamic Bank The Commercial Bank 43.7 30.8 30.4 24.6 19.0 0.0 17.0 34.0 51.0 Masraf Al Rayan Aamal Company Ezdan Holding Group Qatar First Bank QatariGerman Co. for Medical Dev. 0% 20% 40% 60% 80% 100% Buy Sell 23.36% 37.66% 29.08% 18.73% 8.68% 9.83% 38.88% 33.78% Qatari Individuals Qatari Institutions Non-Qatari Individuals Non-Qatari Institutions 652 591 701 542 (49) 49 (200) - 200 400 600 800 Qatari Non-Qatari Net Investment Total Sold Total Bought
- 4. Page 4 of 6 TECHNICAL ANALYSIS OF THE QSE INDEX Source: Bloomberg The QE Index closed up by 1.96% from the week before, and closed at the 10,427.96 level. The Index kept moving inside the corrective channel and bounced below the strong resistance, around the 10,600 level. We keep our expected weekly-resistance level at 10,800 points and the 9,700 level as our weekly support. DEFINITIONS OF KEY TERMS USED IN TECHNICAL ANALYSIS RSI (Relative Strength Index) indicator – RSI is a momentum oscillator that measures the speed and change of price movements. The RSI oscillates between 0 to 100. The index is deemed to be overbought once the RSI approaches the 70 level, indicating that a correction is likely. On the other hand, if the RSI approaches 30, it is an indication that the index may be getting oversold and therefore likely to bounce back. MACD (Moving Average Convergence Divergence) indicator – The indicator consists of the MACD line and a signal line. The divergence or the convergence of the MACD line with the signal line indicates the strength in the momentum during the uptrend or downtrend, as the case may be. When the MACD crosses the signal line from below and trades above it, it gives a positive indication. The reverse is the situation for a bearish trend. Candlestick chart – A candlestick chart is a price chart that displays the high, low, open, and close for a security. The ‘body’ of the chart is portion between the open and close price, while the high and low intraday movements form the ‘shadow’. The candlestick may represent any time frame. We use a one-day candlestick chart (every candlestick represents one trading day) in our analysis. Doji candlestick pattern – A Doji candlestick is formed when a security's open and close are practically equal. The pattern indicates indecisiveness, and based on preceding price actions and future confirmation, may indicate a bullish or bearish trend reversal. ShootingStar/Inverted Hammer candlestick patterns – These candlestick patterns have a small real body (open price and close price are near to each other), and a long upper shadow (large intraday movement on the upside). The Shooting Star is a bearish reversal pattern that forms after a rally. The Inverted Hammer looks exactly like a Shooting Star, but forms after a downtrend. Inverted Hammers represent a potential bullish trend reversal.
- 5. Page 5 of 6 Source: Bloomberg Company Name Price October 17 % Change WTD % Change YTD Market Cap. QR Million TTM P/E P/B Div. Yield Qatar National Bank 19.57 1.45 0.36 180,757 14.0 2.5 3.1 Qatar Islamic Bank 15.40 1.99 1.32 36,389 13.3 2.2 3.2 Commercial Bank of Qatar 4.53 3.66 15.00 18,334 12.3 1.1 3.3 Doha Bank 2.55 0.79 14.86 7,906 11.9 0.9 3.9 Al Ahli Bank 3.48 (4.66) 36.71 8,053 11.9 1.4 2.6 Qatar International Islamic Bank 9.72 4.97 47.01 14,713 17.3 2.6 4.1 Masraf Al Rayan 3.80 7.04 (8.83) 28,500 13.3 2.2 5.3 Al Khaliji Bank 1.22 2.52 5.72 4,392 7.5 0.7 6.1 Qatar First Bank 0.30 (0.33) (25.98) 604 N/A 0.9 N/A National Leasing 0.69 (0.86) (21.50) 341 47.0 0.5 7.2 Dlala Holding 0.68 (0.15) (31.80) 194 N/A 0.9 N/A Qatar & Oman Investment 0.52 (2.64) (3.37) 163 51.4 0.5 5.8 Islamic Holding Group 2.00 1.01 (8.47) 113 312.1 0.8 N/A Banking and Financial Services 300,459 Zad Holding 13.60 2.03 30.77 1,957 15.1 2.2 6.3 Qatar German Co. for Medical Devices 0.77 (4.13) 35.51 89 N/A 2.5 N/A Salam International Investment 0.40 (0.25) (7.39) 458 N/A 0.4 N/A Medicare Group 7.76 0.91 22.98 2,184 26.9 2.2 23.2 Qatar Cinema & Film Distribution 2.26 2.73 18.82 142 18.1 1.0 6.6 Qatar Fuel 22.65 (1.52) 36.45 22,520 18.7 2.9 3.5 Qatar Meat and Livestock 6.38 1.75 (8.86) 1,148 10.4 3.6 7.1 Mannai Corp. 3.27 0.93 (40.49) 1,492 4.6 0.6 6.1 Al Meera Consumer Goods 15.83 1.47 6.96 3,166 17.2 2.4 5.4 Consumer Goods and Services 33,156 Qatar Industrial Manufacturing 3.61 0.00 (15.46) 1,715 11.9 1.1 6.9 Qatar National Cement 6.13 3.03 3.03 4,006 15.2 1.3 8.2 Industries Qatar 10.99 1.48 (17.75) 66,490 16.7 2.0 5.5 Qatari Investors Group 1.82 (1.09) (34.56) 2,263 16.3 0.8 4.1 Qatar Electricity and Water 15.70 2.21 (15.14) 17,270 12.9 1.8 4.9 Aamal 0.71 0.00 (19.23) 4,498 11.4 0.6 8.4 Gulf International Services 1.73 4.85 1.76 3,215 N/A 0.9 N/A Mesaieed Petrochemical Holding 2.74 (3.86) 82.30 34,423 33.5 2.4 2.9 Invesment Holding Group 0.53 (1.86) 8.18 439 7.0 0.6 4.7 Qatar Aluminum Manufacturing 0.89 (0.89) (33.63) 4,944 N/A N/A 2.3 Industrials 139,263 Qatar Insurance 3.15 (0.32) (12.26) 10,288 17.7 1.3 4.8 Doha Insurance 1.03 3.10 (21.31) 515 8.5 0.5 7.8 Qatar General Insurance & Reinsurance 3.46 1.76 (22.91) 3,028 14.3 0.5 2.9 Al Khaleej Takaful Insurance 2.07 5.08 140.98 528 17.0 1.0 2.4 Qatar Islamic Insurance 6.77 (2.73) 26.05 1,016 14.5 2.9 5.2 Insurance 15,375 United Development 1.38 1.47 (6.44) 4,886 10.5 0.5 7.2 Barw a Real Estate 3.41 2.10 (14.56) 13,269 8.7 0.7 7.3 Ezdan Real Estate 0.63 (2.91) (51.23) 16,790 56.7 0.5 N/A Mazaya Qatar Real Estate Development 0.73 0.28 (7.05) 839 N/A 0.7 6.9 Real Estate 35,785 Ooredoo 7.39 1.93 (1.47) 23,672 13.8 1.1 3.4 Vodafone Qatar 1.24 0.81 (20.61) 5,241 35.9 1.2 4.0 Telecoms 28,913 Qatar Navigation (Milaha) 6.45 3.53 (2.29) 7,387 13.7 0.5 4.7 Gulf Warehousing 4.92 (0.61) 27.89 288 15.3 1.7 3.9 Qatar Gas Transport (Nakilat) 2.48 5.98 38.32 13,740 14.9 2.2 4.0 Transportation 21,415 Qatar Exchange 576,961
- 6. Contacts Saugata Sarkar, CFA, CAIA Shahan Keushgerian Zaid al-Nafoosi , CMT, CFTe Head of Research Senior Research Analyst Senior Research Analyst Tel: (+974) 4476 6534 Tel: (+974) 4476 6509 Tel: (+974) 4476 6535 saugata.sarkar@qnbfs.com.qa shahan.keushgerian@qnbfs.com.qa zaid.alnafoosi@qnbfs.com.qa Mehmet Aksoy, PhD QNB Financial Services Co. W.L.L. Senior Research Analyst Contact Center: (+974) 4476 6666 Tel: (+974) 4476 6589 PO Box 24025 mehmet.aksoy@qnbfs.com.qa Doha, Qatar Disclaimer and Copyright Notice: This publication has been prepared by QNB Financial Services Co. W.L.L. (“QNB FS”) a wholly-owned subsidiary of Qatar National Bank (Q.P.S.C.). QNB FS is regulated by the Qatar Financial Markets Authority and the Qatar Exchange. Qatar National Bank (Q.P.S.C.) is regulated by the Qatar Central Bank. This publication expresses the views and opinions of QNB FS at a given time only. It is not an offer, promotion or recommendation to buy or sell securities or other investments, nor is it intended to constitute legal, tax, accounting, or financial advice. QNB FS accepts no liability whatsoever for any direct or indirect losses arising from use of this report. Any investment decision should depend on the individual circumstances of the investor and be based on specifically engaged investment advice. We therefore strongly advise potential investors to seek independent professional advice before making any investment decision. Although the information in this report has been obtained from sources that QNB FS believes to be reliable, we have not independently verified such information and it may not be accurate or complete. QNB FS does not make any representations or warranties as to the accuracy and completeness of the information it may contain, and declines any liability in that respect. For reports dealing with Technical Analysis, expressed opinions and/or recommendations may be different or contrary to the opinions/recommendations of QNB FS Fundamental Research as a result of depending solely on the historical technical data (price and volume). QNB FS reserves the right to amend the views and opinions expressed in this publication at any time. It may also express viewpoints or make investment decisions that differ significantly from, or even contradict, the views and opinions included in this report. This report may not be reproduced in whole or in part without permission from QNB FS COPYRIGHT: No part of this document may be reproduced without the explicit written permission of QNB FS. Page 6 of 6