ICT role in 21st century education and its challenges
Chinese Renewable Energy Status Report
1. Background Paper: Chinese Renewables Status Report October 2009
Background Paper:
CHINESE RENEWABLES STATUS REPORT
OCTOBER 2009
This report was commissioned by REN21 as a background paper to its policy report on
Recommendations for Improving the Effectiveness of Renewable Energy Policies in China. The policy
report can be download at www.ren21.net/news/news38.asp.
1
2. Background Paper: Chinese Renewables Status Report October 2009
ACKNOWLEDGEMENT
This report was commissioned by REN21 and produced in collaboration with the Chinese Renewable
Energy Industrial Association (CREIA) and technology experts from various Chinese research
institutions and private sector. Financing was provided by the United States Department of States, Asia
Pacific Partnership (APP) Programme.
Lead Authors
Junfeng Li and Lingjuan Ma (Chinese Renewable Energy Industry Association)
Contributors
Overview: Shannon Wang (REN21 Secretariat / UNEP)
Wind technology: Wuming Yu (Xinjiang Wind Energy Liability Co., Ltd)
Solar PV: Fang Lv (Beijing Jikedian Renewable Energy Development Centre)
Solar Hot Water: Jinliang Yang (Beijing North Solar Technology Ltd. Co)
Biomass Power Generation: Shipin Qin (National Development and Reform Commission, Energy
Research Institute)
Biogas: Xin Liu (Energy and Environmental Development Research Centre)
Liquid Bioful: Mengjie Wang (Chinese Academy of Agricultural Engineering)
Small Hydropower: Juandong Tong (International Centre on Small Hydro Power)
2
3. Background Paper: Chinese Renewables Status Report October 2009
TABLE OF CONTENT
1 GEOGRAPHIC, ECONOMIC AND DEMOGRAPHIC OVERVIEW .................................................. 5
1.1 Geography ................................................................................................................. 5
1.2 Economy .................................................................................................................... 5
1.3 Demography .............................................................................................................. 6
1.4 Climate Change, Development and Energy Security ................................................. 6
2 OVERVIEW OF THE ENERGY SECTOR ........................................................................................ 9
3 WIND POWER ......................................................................................................................... 10
3.1 Overview ................................................................................................................. 10
3.2 Analysis on Resources and Economic Potential....................................................... 11
3.3 Development Status and Goals ............................................................................... 12
3.4 Policies, Standards and Local Regulations ............................................................... 13
3.5 Investment and Industry Trend ............................................................................... 16
3.6 Rural Electrification ................................................................................................. 17
3.7 R&D ......................................................................................................................... 18
3.8 Local Case Study: Development of Wind Power Industry in Inner Mongolia ......... 19
3.9 Existing Problems and Barriers for Wind Power Development ............................... 20
4 SOLAR SECTOR ........................................................................................................................ 22
4.1 Solar Water Heater .................................................................................................. 22
4.2 Solar PV ................................................................................................................... 35
5 BIOMASS POWER GENERATION ............................................................................................. 46
5.1 Introduction............................................................................................................. 46
5.2 Resources and Economic Potentials ........................................................................ 48
5.3 The 2007 New Installation and the Gap from 2010 Goals ...................................... 52
5.4 Current Policies and Regulations for Biomass Power .............................................. 52
5.5 Investment Status and Sector Development Trend ................................................. 53
5.6 The Impact of Biomass Power Generation on Farmers and Rural Area .................. 58
5.7 R&D ......................................................................................................................... 59
5.8 Recommendations .................................................................................................. 61
5.9 Best Case: National Bio Energy Co. Ltd.................................................................... 63
5.10 Biomass Power Policies and Regulations................................................................. 63
6 LIQUID BIOFUELS .................................................................................................................... 66
6.1 Introduction............................................................................................................. 66
6.2 The Basic Principle of Developing Liquid BIofuels ................................................... 67
6.3 Technological Support and Industry Operation....................................................... 67
7 BIOGAS .................................................................................................................................... 68
7.1 Introduction............................................................................................................. 68
7.2 Resources / Economic Potential .............................................................................. 68
3
4. Background Paper: Chinese Renewables Status Report October 2009
7.3 Additional Installation Capacity in 2007 and 2008 and Gap from 2010 Goal.......... 70
7.4 Existing Policies, Measures and Local Regulations .................................................. 70
7.5 Investment Dynamics and Industrial Trend ............................................................. 73
7.6 R&D ......................................................................................................................... 75
7.7 Local Practice: Best Case in Hunan Province ........................................................... 76
8 SMALL HYDRO POWER ........................................................................................................... 76
8.1 Introduction............................................................................................................. 76
8.2 SHP Resources Distribution and Development ....................................................... 77
8.3 Recent SHP Development........................................................................................ 79
8.4 Policies and Measures for Promoting SHP Development ........................................ 83
8.5 Suggestions to improve the SHP development ....................................................... 84
8.6 The Technical Development of SHP in China ........................................................... 87
8.7 Problems in Developing SHP ................................................................................... 91
8.8 SHP Experiences in China ........................................................................................ 92
9 CONCLUSIONS AND OUTLOOK ............................................................................................... 93
9.1 How Far is China from Its 2010 Renewable Goal .................................................... 93
9.2 Enhancing the Strategic Role of Renewable Energy in Mitigating Climate Change
and Ensuring Energy Security .................................................................................................. 93
4
5. Background Paper: Chinese Renewables Status Report October 2009
1 Geographic, Economic and Demographic Overview
1.1 Geography
China is located in East Asia and on the western shores of the Pacific Ocean. It has a land area of
approx. 9.6 million sq km. The Northern part of the Chinese territory starts from the centre of
Heilongjiang River, north of Mohe (latitude 53°30’ north) and ends in the south at Zengmu Reef, the
southernmost tip of Nansha Islands (latitude 4° north), spanning over 49 degrees; it starts in the east
from the confluence of the Heilongjiang and Wusuli rivers (longitude 135°05’ east) and ends in the
west at the Pamirs (longitude 73°40’ east), spanning over 60 degrees. Both south-north and east-west
spans are over 5,000 km. It has land borders 22,800 km long, and 18,000 km coast line with 4.73
million sq km seas.
1.2 Economy
China has developed as planned and on a large scale, as a result China is among the countries with the
greatest economic potential in the world. The livelihood of Chinese people has been improved and
reached a well-off level in general. National Five Year Plans (FYPs) started since 1953 have been
accomplished with impressive achievements and paved a sound way for the national economy growth.
The reform and opening-up initiated since 1979 has strongly driven China’s economy that is kept
steady even after 2000.
Elementary socialist market economy mechanism has been established in China, and market has
played a better role in resource allocation. The macroeconomic control system is gradually improved.
The national economy consists of state-owned and private sectors developing together, with the
state-owned sector holding the majority. The growing model is gradually shifting from extensive to
intensive style. According to the scheduled plan, China will achieve a well-structured socialist market
economy system which is expected to be mature by 2020.
According to the report of the National Bureau of Statistics of China (NBS) issued on October 27, 2008,
the share of China’s economy in the global portfolio has increased from 1.8 percent in 1978 to 6
percent in 2007. It indicated that from 1978 to 2007 the actual average growth rate of GDP was
annually 9.8 percent, which is not only obviously higher than 6.1 percent in 1953-1978 but also
significantly higher than the global average of 3 percent over the same period. Comparing with 8.5
percent of Korea and 9.2 percent of Japan in the take-off stage of economy, China has done as well as
them. The gaps between China and the major developed countries are narrowing in terms of
th
economy. It ranks the 4 largest countries in the world by GDP, following USA, Japan and Germany.
The 2007 GDP of China was USD3,280.1 billion, accounting for 23.7 percent of USA, 74.9 percent of
Japan and 99.5 percent of Germany, representing an increase of 17.2 percent, 59.7 percent and 78.9
percent over 1978 respectively. The per capita GDP in China increased from USD190 in 1978 to
USD2,360 in 2007. The country is classified in the lower middle category by the World Bank by per
capita income.
5
6. Background Paper: Chinese Renewables Status Report October 2009
1.3 Demography
China has the largest population in the world. NBS says in the report issued on February 26, 2009, as
of the end of 2008, the total population was 1.308 billion, representing an increase of 6.73 million
over the year before. The new born population in 2008 was 16.06 million, with a birth rate of 12.13‰;
and the number of death is 9.35 million, with a death rate of 7.06 ‰. The rate of natural growth is
5.08‰.
As of the end of 2008, the 60-year-old or above population reached 158.89 million, accounting for 12
percent. The report that is issued by NBS on November 3, 2008 says that As of the end of 2007
Chinese population accounts for 20.1 percent of the world's total, comparing with 22.2 percent in
1980. The decreasing is driven by the family planning policy since 1979. China is experiencing steady
growth of population, civilization improvement and increasing labor force. On average, every 5 adults
only need to feed 2 children or old people. China has a population structure at a golden period.
1.4 Climate Change, Development and Energy Security
Many observations of the last 100 years show that the earth’s climate is now experiencing significant
change characterized by global warming. And the trend of climate change in China is generally
consistent with that of global climate change. To address climate change and promote sustainable
development, China has carried out various policies and measures, such as economic restructuring,
energy efficiency improvement, development and utilization of hydropower and other renewable
energy, ecological restoration and protection, as well family planning, which has contributed
significantly to the mitigation of climate change.
The Third Assessment Report of the Intergovernmental Panel on Climate Change (IPCC) has clearly
indicated that most of the global warming observed over the past 50 years is likely induced by the
increase in concentrations of greenhouse gases (GHGs), such as carbon dioxide (CO2), methane (CH4),
and nitrous oxide (N2O), due to human activities. In the context of global warming, climate in China
has experienced noticeable changes over the past 100 years as well. The major observed evidence of
climate change in China includes the following:
--Temperature. Annual average air temperature has increased by 0.5-0.8℃ during the past 100 years,
which is slightly greater than the average global temperature rise. Most of the temperature rise is
observed over the last 50 years.
The regional distribution of the temperature changes shows that the warming trend is more
significant in western, eastern and northern China than in the south of the Yangtze River. The
seasonal distribution of the temperature changes shows that the most significant temperature
increase occurred in winter, and 20 consecutive warm winters are observed nationwide from 1986 to
2005.
--Precipitation. In the past 100 years, there is no obvious trend of change in annual precipitation in
China, but there exists considerable variation among regions. The annual precipitation decreased
6
7. Background Paper: Chinese Renewables Status Report October 2009
gradually since 1950s with an average rate of 2.9 mm/decade, although it increased slightly during the
period of 1991-2000. The regional distribution of precipitation shows that the decrease in annual
precipitation is significant in most of northern China, eastern part of the northwest, and northeastern
China, averaging 20-40 mm/decade, with decrease in northern China being most severe. The
precipitation significantly increased in southern China and southwestern China, averaging 20-60
mm/decade.
--Extreme climate/weather events. The frequency and intensity of extreme climate/weather events
throughout China have experienced obvious changes during the last 50 years. Drought in northern
and northeastern China, and flood in the middle and lower reaches of the Yangtze River and
southeastern China have become more severe. The annual precipitation in most years since 1990 has
been larger than normal, with the precipitation pattern being a dipole, corresponding to frequent
disasters in the North and flood in the South.
--Sea level. The rate of sea level rise along China’s coasts during the past 50 years is 2.5 mm/yr,
slightly higher than the global average.
--Glaciers. The mountain glaciers in China have retreated, and the trend is accelerating. The trend of
climate warming in China will further intensify in the future.
The projections by Chinese scientists indicate that:
--The nationwide annual mean air temperature will increase by 1.3-2.1℃ in 2030 and by 2.3-3.3℃ in
2050 comparing with that in 2000. The warming magnitude will increase from south to north in China,
particularly in northwestern and northeastern China where significant temperature rise is projected.
It is estimated that by 2030, the annual temperature will likely increase by 1.9-2.3℃ in northwestern
China, 1.6-2.0℃ in southwestern China, and 2.2-2.6℃ in the Qinghai-Tibetan Plateau.
--Precipitation in China will possibly increase during the next 50 years, with a projected nationwide
increase of 2-3 percent by 2020 and 5-7 percent by 2050. The most significant increase might be
experienced in southeastern coastal regions.
--The possibility of more frequent occurrence of extreme weather/climate events will increase in
China. It will have great impact on the socio-economic development and people’s life.
--The arid area in China will probably become larger and the risk of desertification might increase.
--The sea level along the coasts in China will continue to rise.
--The glaciers in the Qinghai-Tibetan Plateau and the Tianshan Mountains could retreat at an
accelerated rate, and some smaller glaciers will disappear.
GHG emission in China
7
8. Background Paper: Chinese Renewables Status Report October 2009
According to the Initial National Communication on Climate Change of the People’s Republic of China,
China’s total GHG emission in 1994 was 4.06 billion tons of CO2 equivalent (tce) (3,650 Mt of net
emission), including 3,070 Mt of CO2, 730 Mt CO2 equivalent of CH4 and 260 million tce of N2O.
China’s experts estimate that China’s total GHG emission in 2004 was approx. 6,100 tce (5,600 Mt,
net), including 5,050 Mt CO2, 720 million tce of CH4 and 330 million tce of N2O. From 1994-2004, the
annual average growth rate of GHG emission was approx. 4 percent, and the share of CO2 in total
GHG emission increased from 76 percent to 83 percent.
China’s historical GHG emission is very low and per capita emission has been below the world average.
According to the study carried out by the World Resource Institute (WRI), China’s CO 2 emission from
fossil fuel combustion is 79 Mt in 1950, accounting for only 1.13 percent of the world total at that
time, while the cumulative emission accounts for only 9.33 percent during the period of 1950-2002.
The cumulative CO2 emission per capita was 61.7 tons over the same period, ranking the 92nd in the
world. Statistics from the International Energy Agency (IEA) indicates that per capita CO 2 emission
from fossil fuel combustion was 3.65 tons in 2004 in China, accounting for only 87 percent of the
world average and 33 percent of that of countries in Organization for Economic Co-operation and
Development (OECD).
China took lead in developing the China’s Agenda of 21st Century - White Paper on China's Population,
Environment and Development, after the United Nations Conference on Environment and
Development in 1992, and adopted a series of policies and measures, taking into account its own
situation and making positive contribution to the mitigation of climate change.
Measures to tackle the climate change in China
-- Restructuring the economy, promoting technology advancement and improving energy efficiency.
Since late 1980s, Chinese Government has paid more attention to the change of the economic growth
pattern and the restructuring of economy, and integrated reduction of energy and other resources
consumption, promotion of clean production, and prevention and control of industrial pollution into
its national industrial policies. The industrial structure has been significantly improved through the
implementation of a series of industrial policies to accelerate the development of the tertiary industry
and to restructure the secondary industry. The breakdown of GDP across the primary, secondary and
tertiary industries in 1990 was 26.9:41.3:31.8, while in 2005 it was 12.6:47.5:39.9. The share of
primary industry declined continuously, and the tertiary grew greatly, especially in sectors such as
telecommunication, tourism and finance. The secondary industry has slightly grown in the overall
share, but its internal composition has significantly changed, and the proportion of high value-added
products has increased due to the rapid development in machinery, information technology and
electronic sectors. Such change has brought significant energy conservation benefits. During the
period of 1991-2005, China achieved an annual GDP growth rate of 10.2 percent with an annual
growth rate of 5.6 percent in energy consumption and an elasticity of energy consumption of approx.
0.55.
Since 1980s, Chinese Government has adopted a principle of “equal treatment to development and
8
9. Background Paper: Chinese Renewables Status Report October 2009
conservation with immediate emphasis on the latter”, making energy conservation as a matter of
strategic importance in energy policy. Energy conservation is effectively promoted through the
implementation of the Energy Conservation Law of the People’s Republic of China (ECL) and relevant
regulations, the development of specific energy conservation plans, the adoption and implementation
of technological, economic, fiscal and administrative policies in favor of energy conservation, the
development and application of energy efficiency standards and labeling, the encouragement of
RDD&D and diffusion of energy-saving technologies, the importing and absorbing of advanced
energy-saving technologies, the creation and employment of new energy conservation mechanisms,
and the promotion of key energy conservation projects as well. From 1990 to 2005, China’s energy
intensity (energy consumption per RMB million GDP at price in 2000) went down from 268tce to
143tce, representing an average year-over-year falling rate of 4.1 percent. The unit energy
consumption of energy-intensive products in industry declined strikingly. In 2004, comparing with
1990, for generators with capacity of 6MW or above, the unit energy consumption for thermal power
supply decreased from 427gce/kWh to 376gce/kWh. The comparable energy consumption for 1 ton
of steel in key businesses decreased from 997kgce to 702kgce. The comprehensive energy
consumption per ton of cement in large-and-medium-sized businesses decreased from 201kgce to
157kgce. During the period of 1991-2005, with economy restructuring and energy efficiency
improvement, 800 Mtce of energy are saved, equivalent to a CO2 emission reduction of 1.8 billion
tons, based on a factor of 2.277 t CO2/tce for China in 1994.
-- Optimizing energy mix by developing low-carbon and renewable energy
Under national policy guidance and with financial support, the share of high-grade and clean energy is
improved by strengthening the development and utilization of hydropower, nuclear energy, oil, gas
and coal-bed methane (CBM), and by supporting the development and utilization of new and
renewable energy including biomass, solar, geothermal and wind power in rural, remote and other
suitable areas.
2 Overview of the Energy Sector
China produced 2.5 Btce energy in 2008, 3.98 times up from 1978 level, with an average annual
growth rate of 4.7 percent. China is ranked as the second largest energy production country just
behind the United States, and the energy self-supply rate has reached 90 percent. According to NBS,
the production of crude coal in China was 2.716 Bt in 2007, ranked the first in the world, increased by
3.33 times from 1978. By the end of 2008, the installed capacity of power generation reached 792 GW,
increased by 12.8 times from 1978, and the annual growth rate is over 9 percent. The power
generation in 2008 reached 3,433.4 TWh, 12.58 times over that of 1978 with an annual growth rate of
9 percent. At the same time, the development of renewable energy has been well advanced. The
share of hydropower, nuclear and wind in the overall power generation has increased from 3.1 percent
in 1978 to 9 percent in 2007. For the past years, the share of installed capacity of renewable has been
growing rapidly, from 14 percent in 2005 to 17 percent in 2008.
th
The 17 National Congress of the Communist Party of China, held in October 2007, set the goals of
accelerating the transformation of the development pattern and quadrupling the per-capita GDP of
9
10. Background Paper: Chinese Renewables Status Report October 2009
the year 2000 by 2020 by optimizing the economic structure and improving economic returns while
reducing energy consumption and protecting the environment. The outline of the 11th Five-Year Plan
for National Economic and Social Development of the People's Republic of China projects that the
per-unit GDP energy consumption by 2010 will decrease by 20 percent compared to 2005, and the
total amount of major pollutants discharged will go down by 10 percent.
th
To realize the country's economic and social development goals, the 11 FYP (2006-2010) for the
energy industry has put forth the following goals. By 2010, energy supply shall meet the demand of
national economic and social development. Other goals include significant progress in energy saving,
highly improved energy efficiency, further optimized energy structure, technological advancement,
greater economic benefits and market competitiveness, as well as improved energy-related
macro-control, market supervision, legislation and emergency system compatible with the socialist
market economy. The result will be that energy production can be favorable for economy, society and
environment.
In 2006, the unit GDP energy consumption in China was 1.206 tce/ RMB10, 000, down by 1.33 percent
from 2005. There has been an annual decrease of 3.66 percent in 2007 and 4.21 percent in 2008. It is
largely due to the closing down of many small coal-fired power plants. With appropriate combination
of policies and measures, China has closed 16.69 GW capacity of coal-fired power plants in 2008, with
the annual goal completed. In the past three years, the accumulated shut down capacity has reached
th
34.2 GW, accounting for 68.4 percent of the total shutdown target within the 11 FYP. By replacing the
small coal-fired power plants with the large ones, it has saved 43 Mt of coal, reduced 73,000 t SO2 and
69 Mt CO2 emissions. In 2008, more than 1,000 outdated coal mines were closed, with a capacity of 40
Mt.
3 Wind power
3.1 Overview
People's Republic of China Renewable Energy Law (the ReLaw) has been considered and approved by
th
the tenth session of 10 National People’s Congress (NPC) Standing Committee on February 28, 2005,
which has decided the implementation of the ReLaw from January 1, 2006. A series of matching
detailed rules and regulations were issued after the ReLaw has been issued.
China’s wind power industry has developed at an explosive rate during the past four years
(2005-2008). The total wind power installation in China has reached 1,260 MW in 2005, 2,597 MW in
2006, 6,040 MW in 2007, and 12,152 MW in 2008. The annual growth rate is over 100 percent,
averagely 113 percent. The wind turbine manufacturing is experiencing rapid development, with lots
of manufacturers emerged within a short period of time. There are 70 wind turbine manufacturers
under planning and expect to have a capacity of over 30,000 MW per year by 2010. Wind power
industrial chain keeps extending with a group of service providers coming into being, such as project
development, installation, operation and management, technical services within quality warranty
period, equipment repair and professional cleaning. It is expected that within the next few years,
China’s wind power industry will continue to maintain the relatively high growth rate. China is leader
10
11. Background Paper: Chinese Renewables Status Report October 2009
in installed capacity globally, equipment manufacturing scale and professional services, bringing a
bright future for the expansion of Chinese wind industry.
3.2 Analysis on Resources and Economic Potential
3.2.1 China’s Wind Resources
Different results have been generated by different organizations on the Chinese wind resources
potential both technologically and economically. According to the second and third survey on national
wind power resources, China’s onshore 10-meter-high wind resources that can be developed
theoretically are 3,226 GW and 4,350 GW, and technically available resources are, 253 GW and 297
GW respectively. The research results from United Nations Environment Program (UNEP) in 2005
show that China’s onshore 50-meter-high wind resources that can be technically developed are 1,400
GW. The evaluation results from China National Climate Center in 2006 showed that China’s onshore
10-meter-high wind resources that can be technically developed are 2,458 GW without considering
the case of Qinghai-Tibet Plateau (the above data refer to China Wind Report 2008, P17). As Chinese
Academy of Engineering (CAE), China’s onshore wind power resources should range from 300 GW to
1,400 GW, both of which are much higher than the data from national survey. It is suggested by some
experts that the wind resources at the specific site can be calculated as the number of wind turbines
that can be installed under current wind power engineering technical and economic conditions within
a certain area of land. Accordingly, the third national wind power resources survey shows that China’s
onshore wind farm with the density exceeding 150W/sq m is 200,000 sq km. Based on common wind
farm layout for plain terrain (4D×8D), the installed capacity could be 2,000 GW. Taking account of the
geographic impact such as the non-plain terrain, the feasible installation capacity should be 1,500
GW.
As previously estimated, China’s offshore wind power resource is about 750 GW. Calculation has been
made based on the 16,000-31,000 sq km of sea area that is suitable for wind turbines installation,
which gives an achievable offshore wind resource at approx. 100-200 GW.
It’s noticed that both onshore and offshore wind resource potential requires further study to gain a
better understanding on its explosive rate. But confidence is given for achieving 1,500-2,000 GW of
installation capacity with existing wind resources. Therefore within the next few decades, wind
resources will not be a restricted factor to the development of China’s wind industry.
3.2.2 Economic Factors Influencing Development of Wind Industry
In 2008, China’s new wind power installation was 6,246 MW that enabled an accumulative capacity of
12,152 MW. It’s projected that by 2010 an accumulative capacity of 20 GW will be achieved, 2.2% of
the total electricity installation planned by the State Grid by that year (estimated to be 900 GW). By
2020 the total wind installation will reach 100 GW by the current plan, 8.3% percent of the total
power installation capacity (1,200 GW as planned). In the next decade, the share of wind power in
power grid installed capacity will still remind small, a longer timeframe is foreseen for wind to play a
significant role as an alternative energy. It’s also debated that due to the small portion in the total
11
12. Background Paper: Chinese Renewables Status Report October 2009
electricity supply there won’t be severe influence on the grid as well as the power economy in the
near future. However, wind energy can play a positive role in energy saving and emission reduction,
environmental pollution easing, and energy portfolio improvement.
It is a rather complex to give an accurate evaluation on the impact of world’s financial crisis on
Chinese wind energy industry. At least by the end of the first quarter of 2009, there is no obvious
negative influence has been spotted. It can be seen from the bright side of the financial crisis, lots of
countries including the United States, pay more attention to renewable energy development, and
take it as one of the most important strategic solutions to overcome the crisis and to prevent a
recession. Power industry takes a certain proportion in the economic revitalization investment with
RMB4 trillion (RMB3 trillion for renewable energy, equivalent to USD440 billion) funded by Chinese
government. In the following years, the investment for power installation will be increased, including
power grid investment, which is essential for wind power generated electricity to go on to the grid.
Some key equipment manufacturers have been listed as one of the ten industries in economic
revitalization plan. As statistics show the average per kW investment is RMB10,277 (USD1,511) for
wind farm in 2008, and investment per million kW is about RMB10 billion (USD1.46 billion) for wind
farm construction, which will be actively pulling GDP.
3.3 Development Status and Goals
In 2008, wind farm construction in China keeps expanding rapidly, hitting new record. The
newly-added installation capacity in 2008 was 6,246 MW (5,132 turbines), and the total installed
capacity was 12,152 MW (approx. 11601 turbines), twice as many as that of the last year. Thus,
China’s rank has been raised to the fourth place in the world, only following U.S. (25,170 MW),
Germany (23,903 MW), and Spain (16,740 MW). At provincial level, Inner Mongolia is a pioneer in
terms of installation with the newly-added capacity of 2,172 MW and the total installed capacity of
3,939 MW, followed by Liaoning, Hebei and Jilin provinces. The three provinces have an installed
capacity of 1,250 MW, 1,111 MW and 1,069 MW respectively. And the installed capacity in some
other areas exceeded 500 MW, such as Heilongjiang, Jiangsu, Gansu, Xinjiang and Shandong.
In the past few years a new feature has appeared in the wind industry: some regions with relatively
scarce wind resources, such as Henan, Chongqing, Jiangxi, Hubei, Hunan and Yunnan have already
started to construct and develop wind farms. On one hand, the wind power installation has been
expanded greatly at the geographical scale. On the other hand, it has raised new technical and
economic challenges.
There were 199 wind farm projects were approved in 2008 with a total capacity of 11,670MW. By the
end of 2008, 1,840MW capacity has been installed and 9,830MW is currently under construction,
which means 2009 will continue the high installation growth rate as the previous years. Five
concessional programmes have been approved by the end of 2008, with a total of 49 projects and
8,800MW installation capacity. There were 18 projects at the stage of under construction or
construction completed, with an operational capacity of 1,570MW, which accounted 13 percent of
overall national wind installation capacity. A large number of the rest of the operational projects were
approved at either provincial or regional level.
12
13. Background Paper: Chinese Renewables Status Report October 2009
In 2009, the National Energy Administration puts forward a Wind Development Principal on
constructing large wind bases connected to grids. A target is to build a tremendous wind power base
at 10 GW level. Currently, the construction of the wind base in Yumen of Gansu Province has been
kicked off. The complementary transmission project of 750 KV starts construction. The planning for
wind bases in East Inner-Mongolia (30 GW), West Inner-Mongolia (20 GW), and Xinjiang Hami (20
GW), North Hebei (10 GW) and Jiangsu Coastline (10 GW) is undergoing.
Besides, wind power equipment manufacturing industry also has achieved great accomplishment in
the past years. Before 2004 there were less than five such manufacturers in China, whose market
shares in total were less than 15 percent. By the end of 2007, there were 40 manufacturers included
domestic ones, foreign-funded businesses and joint ventures. Furthermore they have carried out
intensive R&D of wind turbine technology. In 2007, the newly-added installation capacity was 3,443
MW, among which the share of domestic businesses accounted for 56 percent. As of the end of 2008,
the number of domestic wind turbine manufacturers increased to 70, the newly-added installed
capacity was 6,246 MW, among which the share of both domestic and joint venture businesses
increased to 75.4 percent. By 2010, the 15 assembly manufacturers will have capacity of 20,325 MW;
plus other manufacturers, development zones under planning and wind power industrial parks, it is
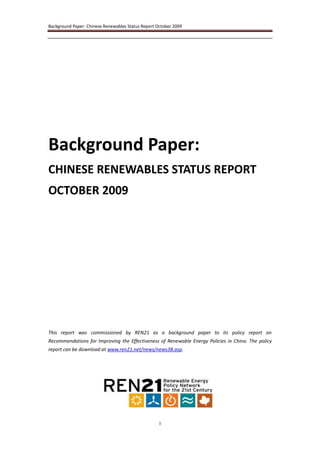
estimated that the total capacity will exceed 30,000 MW, greatly beyond market demand.
Figure 1 The development trends of China’s wind power installation (MW)
14000.0
12000.0
10000.0
8000.0
6000.0
4000.0
2000.0
0.0
1986
1987
1988
1989
1990
1991
1992
1993
1994
1995
1996
1997
1998
1999
2000
2001
2002
2003
2004
2005
2006
2007
2008
New installed Accumulate
3.4 Policies, Standards and Local Regulations
Benefiting from the favorable policies, China wind power industry has gone through rapid
development in the past years. The publication of the ReLaw and a series of detailed implementing
regulations are the ultimate momentum for the industrial development. The ReLaw has solved some
13
14. Background Paper: Chinese Renewables Status Report October 2009
key issues that have restricted the scale up of wind power industry for a long time.
3.4.1 Grid Connection Policy for Wind Power
The law regulates that all grid companies should purchase all the electricity generated from
renewable energy sources and provide grid connection service. To put the rules into effect, the State
Electricity Regulation Commission (SERC) released the Regulatory Measures on Off-take Purchase of
th
Electricity from Renewable Energy Sources by Grid Companies in its 25 order in 2007. For coal fire
power generator, the grid company will select the coal fire power plants through the feed-in-tariff
bidding process. Before the issuance of the regulator measure for renewable energy purchase by grid
company, the related policies have clarified that wind power does not participate in feed-in tariff
bidding, and regulated that wind power has the priority in electricity dispatching to power grid.
Therefore, the obstacles for grid connection of wind power have been weeded out by these policies.
3.4.2 Wind Power Price Difference Allocation Policy
The Interim Management Measures for Renewable Power Tariff and Cost Allocation has been issued
by NDRC in 2006, and the Interim Measures on Renewable Power Surcharge Collection and Allocation
has been issued by NDRC in 2007. With the above two issued policies, the rules in the ReLaw that
renewable energy price difference shall be obtained from the provincial electricity sales revenue and
adjusted by the State in a unified way, have became effective. The historical fact was that the faster
the development of wind power in remote and poor regions, the higher the electricity tariff and the
heavier the financial burden. This problem has been addressed by the measures that have activated
development of wind power in provinces and cities.
In order to ensure the financing of the price difference through the allocation fund, NDRC notified in
2006 that since June 30, the power grids of each province in China shall surcharge of additional
-4
RMB0.001 (USD1.5x10 ) per kW for renewable energy, this would enable a collection of RMB3 billion
-4
(USD439 million) in 2007. In 2008, the surcharge has been adjusted to RMB0.002 (USD3x10 ), with
the collected income exceeding RMB6 billion (USD878 million). There were 48 projects in China have
received the compensation of the premium tariff amounted to RMB260 million (USD38.1 million) in
2006, of which Xinjiang, Jilin, Inner Mongolia and Tibet obtained RMB91.71 million (USD13.43 million)
from Jiangsu, Zhejiang, Shandong and Henan. From January to September 2007, there were 110
projects received subsidies amounted to RMB714 million (USD105 million). From October 2007 to
June 2008, 148 projects in total obtained this compensation amounted to RMB1.954 billion (USD286
million). Among them, 102 projects were wind power projects, with the total installed capacity of
5,000 MW and 5.92 billion kWh electricity connected to the grid. They have received the subsidy of
RMB1.382 billion (USD202 million) (Power Station Information, P2, Issue 12, 2008).
3.4.3 Feed-in Tariff Pricing Mechanism of Wind Power
In the Interim Management Measures for Renewable Power Tariff and Cost Allocation issued by NDRC,
it is provided that two modes are adopted for the pricing of renewable power. One is that the price is
set up by government and the other mode is guided by government. The guided price is the successful
14
15. Background Paper: Chinese Renewables Status Report October 2009
bidding price fixed by tender and especially for concession projects. The successful bidding price for
five concession projects is between RMB0.382/kWh and RMB0.551/kWh. The price decided by
government is mainly for the projects that are approved by provinces and less than 50 MW. The
approved power price is between RMB0.51/kWh and RMB0.68/kWh, different from that of
concession projects. It is worth paying more attention to the fact that in evaluating conditions of the
fifth batch of concession projects, the condition of winning the highest score for feed-in tariff in
bidding was changed from the lowest quoted price to the one that is most close to the average
quoted price. The wining price for the fifth batch of projects is RMB0.468-0.551/kWh, from which it
can be seen that the feed-in tariff becomes increasingly reasonable. According to the statistics, the
average price (tax included) is RMB0.5975/kWh for approved wind farm projects in 2008. As a whole,
forming a fixed mechanism of feed-in tariff and returning to reasonable price are the necessary
conditions and ultimately assurance for wind industry development.
3.4.4 Discussion on RPS Requirement
The Medium- and Long-term Plan for Renewable Energy has been issued by NDRC in August, 2007, in
which it is the first time to put forward that in areas covered by large power grids, non-hydro
renewable power generation’s share of total power generation will reach 1 percent by 2010 and over
3 percent by 2020. It is required that the power plants with equity installed capacity of over 5 GW
shall have an equity installed capacity of non-hydro renewable energy accounting for 3 percent of
their total capacity by 2010, and over 8 percent by 2020. At current stage, only wind power has scaled
up in all non-hydro renewable energy. It is estimated that if the total installed capacity of power grid
reaching 0.9 billion kW by 2010, the 3 percent wind power will be 27,000 MW. The plan has provided
momentum and specific targets for the major power generation groups to develop wind power.
Although the quota system has not been carried out, the plan has been an important factor driving
the rapid development for the last years.
3.4.5 Driving Force of Clean Development Mechanism (CDM)
In October 2005, NDRC, Ministry of Science and Technology(MOST), Ministry of Foreign Affairs
(MFA) and Ministry of Finance(MOF)jointly issued the Measures on the Operation and
Management of CDM Projects, which promotes the development of China CDM projects. The
newly-built wind projects meeting the CDM conditions are submitted for approval. As of January 12th,
2009, there are 367 projects in China that have been successfully registered with CDM Executive
Board. Among them, there are 95 wind power projects, accounting for 25 percent of the total. The
total installed capacity of registered wind projects is 5,589.65 MW, accounting for approx. 50 percent
of the completed wind projects. Based on 2,000 hours of power generation on average, 5.6 Mt coal is
saved and 10.22 Mt CO2 emissions is reduced annually. As for the CDM projects, their feed-in tariff
can get a subsidy of RMB0.07-0.14 /kWh subject to sales price within the given period. It is favorable
for China’s wind industry since the feed-in tariff of wind projects is still relatively low in China, making
most of wind projects profitable. The subsidy is popular among wind farm owners.
3.4.6 Fiscal Subsidy
15
16. Background Paper: Chinese Renewables Status Report October 2009
The national fund, mainly through subsidy policy, strongly supports the R&D of wind power
technology and wind turbine. In addition to this, both MOST and NDRC are giving their strong
supports to the research and innovation of domestic wind turbine and its parts through various
national technological plans and special R&D funds for renewable energy respectively. Since the
Interim Management Measures on Special Fund for Wind Power Generation Equipment
Industrialization was issued by MOF in August 2008, many incentives have been extended to
encourage the R&D of new wind power equipment. The Notice on Adjustment of Import Tax Policies
for High-Power Wind Turbine and Its Key Parts and Raw Materials has been issued by MOF, which
rules that import tax shall be collected for wind turbines of 2.5 MW or below and import duty and
value-added tax (VAT) shall be collected for the key parts before rebate, supporting the localized
production of wind equipment. These policies and measures played an active role in long-term
healthy development of China’s wind industry. The No. 224 File issued by NDRC in February 2009
requires the further planning of wind power development, doing a good job in supporting wind power
grid construction, ensuring the grid connection of all the electricity from approved wind projects,
strictly implementing price policies and clarifying tariff in a timely manner and formulating the grid
connection management measures based on requirements of wind power. New requirements have
been put forth for solving the existing problems in wind power development.
3.4.7 Local Policy Support
In addition to the national unified policies, some places and departments have also issued preferential
policies to encourage wind industry development according to their actual situation. Wind power
feed-in tariff has been increased from RMB0.53/kWh to RMB0.689/kWh in Guangdong Province,
changing the cold picture of wind power investment over the past years. A large number of wind
projects have been submitted for approval. Wind Power Equipment Development Program has been
issued by Jiangsu Province. It points out that by 2020, Jiangsu will basically form a wind turbine
manufacturing capacity of 8,000 MW and a sales revenue of RMB100 billion. The Guide for
Development of Wind Power Equipment in National Defense Industry issued by the Commission of
Science, Technology and Industry for National Defense (COSTIND) says that it is planned to build 2-3
domestically leading wind turbine manufacturing businesses by 2020, with an annual manufacturing
capacity of 2,000 turbines. Gansu Province has proposed and actively promoted the construction of a
wind base just like the Three Gorges in Hexi Corridor, and attracted manufacturing plants to Gansu by
using the opportunity that China has approved the construction of the 10 GW wind power base, with
the aim of optimizing the industrial structure. Hebei Development and Reform Commission requires
further planning of wind power development, better construction of 1 GW wind power base and
power grids and improvement of Hebei wind power industry, which have played a practical role in
promoting China's wind power industry.
3.5 Investment and Industry Trend
From 2007 to 2008, China had state-owned businesses as wind farm investors, such as the five major
power generation groups, Shenhua Group, China Energy Conservation Investment Corporation, and
Guangdong Nuclear Power Group. Among them, China Longyuan Electric Power Group Corp. is a
typical one. Longyuan Group is the first one breaking the milestones of 1000 MW and 2000 MW in
16
17. Background Paper: Chinese Renewables Status Report October 2009
installed capacity of wind power. As of the end of 2008, the total installed capacity of Longyuan was
2,800 MW, among which the 1,375 MW was newly added in 2008. Following Longyuan, Datang and
Huaneng had installed capacity of 1,073 MW and 933 MW in 2008 respectively. As planned by
Longyuan, it is expected to have its wind power installed capacity exceed 5,000 MW by 2010, and
20,000 MW by 2020, with which it will remain No.1 in China (Wind Power Generation, P1, Issue 2,
2008). Some other power generation groups and the large state-owned businesses which are new
into this field for the past years, such as Three Gorges Group and Guohua Energy Investment
Corporation, and also some local state-owned investors, such as Hebei Construction and Investment
Group, all put forward the ambitious development plans with the installed capacity goals of more
than 10,000 MW. What can be estimated is that within the next few years China wind farm
investment will still mainly be made by large SOEs. In view of the great strength of these large SOEs as
well as their enthusiasm for wind power industry, it is expected that in the near future, investment
funds will not be a constraint for development of wind power industry.
For the past years, some of public and private businesses with potential and strength have showed
their great interest in wind farm construction, and have done a variety of preliminary works for
investment. However, since there are many difficulties, they cannot make actually big progress, thus
having a small market share. The scattered power stations invested by individuals or families can be
connected to the grid nearby, and also can make full use of land resources, ease the pressure on grid
caused by large wind power access to grid and comply with the concept of distributed energy system.
There is no doubt that the stations are feasible and can bring about benefits both theoretically and
technically. According to the current management system, there will be a series of difficulties in the
approval procedures, grid connection, the relationship between the sale and purchase of electricity.
The existing management system is not favorable for the development, so it is still difficult to put
them in practice. Overall, the situation that China wind power investment is mainly made by SOEs will
not change in the near future.
In general, it is the same situation for wind manufacturing. Among so many turbine assembly and
parts manufacturing businesses, state-owned capital takes the majority. The difference is that some
listed companies, such as Goldwind, Dongfang Electricity, Nanjing Gaozai Gear, are leading the
industry, while lots of private businesses, such as Zhengjiang Huayi, Shenyang Huachuang, Guangdong
Mingyang and Huiquan of Inner Mongolia, have actively engaged in manufacturing turbine and its
parts, starting their long journey in the new industry,
3.6 Rural Electrification
The promotion of rural electrification by wind power is mainly shown in the promotion and
popularization of off-grid turbines, providing electricity for poor families in uncovered areas.
In 2007, China produced 54,800 small-and medium-sized off-grid wind turbines, with the
year-over-year growth of 9.6 percent, the total capacity of 35 MW, and the output value of RMB18
million. The 19 models include 100 W, 150 W, 10 KW and 100 KW. The production in 2008 was 78,411
turbines with approx. 73 MW capacity. From 1983 to the end of 2008, China produced 508,712 small
off-grid wind turbines in total. It is estimated that there are approx. 0.19 million small wind turbines
17
18. Background Paper: Chinese Renewables Status Report October 2009
still being used, with the installed capacity of approx. 57 MW and the annual power generation of
83.22 GWh. China is a global leader in annual output, total output, production capacity and export of
small wind turbines. There are about 10 colleges, universities and research institutes, 36 turbine
production companies, and 28 parts production companies engaging in the related business. There
are several companies with larger annual output, such as Jiangsu Shenzhou Wind Power, Hunan
Zhongke Hengyuan Technology, Guangzhou Hongying Energy Technology, Ningbo Wind King, Beijing
Yuandong Boli, Long Xinbo and Tianli Machinery of Inner Mongolia. The off-grid turbine provides
electricity for poor families in uncovered areas. Its applications extend to broadcast and
communication relay stations, street lights, garden lights, fishing boats and public facilities.
China off-grid wind turbines have been increasingly popular in foreign countries. In 2007, China has
exported more than 19,000 off-grid wind turbines, with the total capacity of 21 MW, and in 2008
39,387 turbines. There are 46 countries and regions to be exported to, such as Korea, India, Indonesia,
Japan, the Philippines, Pakistan, Argentina, Australia, Britain, and the United States (Some of the data
come from the Report on Development of China Off-gird Wind Power Industry by Mr Li Defu).
3.7 R&D
Chinese government attaches great importance to sci-tech innovation of wind power industry. The
key projects in the field have been supported by the 863 Plan, the 973 Plan, science and technology
supporting plan initiated by MOST, and the renewable energy special fund on R&D from NDRC. Lots of
technologies have been listed in related plans and special programs, such as the technologies of
MW-level, direct drive and permanent magnetic, full power and inverse wind turbine and its key parts,
and MW-level, double-feed, variable speed and constant frequency (VSCF) wind turbine and its major
parts; industrialization of domestic wind turbines; and off-shore wind power technology. The
investment has been made by Hunan, Shanghai and Zhejiang to support the R&D of wind power
technology.
With the State support, a batch of wind turbines and parts manufacturing businesses started to exert
their main role in technology innovation in various forms, and strived to have their own intellectual
property rights (IPR), with some achievements having been made. Goldwind has purchased Vensys
based in Germany, which was a design partner of Goldwind in new MW-level turbine design. Thus
Goldwind is now firmly controlling IPRs of dominant products and the technology development rights
for new products. Sinovel and Dongfang Electricity have digested the technologies of imported
turbines for improvement and innovation. Some businesses are developing 3-5 MW turbines and the
special turbines for off-shore wind power. Besides, some parts manufacturing businesses, such as
Baoding Huiteng, Nanjing Gaozai Gear and Yongji Electric Equipment Co., have developed and
manufactured products based on requirements of turbine businesses. Insisting on innovation with
improved independent design capability, they have launched new products in succession. Some of
manufacturing companies also provide parts of turbine for manufacturers in foreign countries. All in
all, China is lagging behind in the core technology and independent innovation capability of wind
equipment manufacturing and does not have a team of experts who have a full understanding of core
design technologies of wind turbine. There is a lack of basic wind generation theory, assistant tools
and research results for independent innovation. There is no state-level R&D platform for wind power
18
19. Background Paper: Chinese Renewables Status Report October 2009
generation technology. The fundamental theory research on wind power has not been carried out.
The efforts in this regards have to be enhanced.
3.8 Local Case Study: Development of Wind Power Industry in Inner Mongolia
Inner Mongolia has gone through tremendous growth in the past years in wind power installed
capacity and becomes the model region in China. Comparing with the other areas, Inner Mongolia
firstly reached the milestone of 1 GW installed capacity in 2007, with 1,736 turbines (1,585 MW) as of
the end of the year. In 2008, the newly-added installed capacity of Inner Mongolia was 2,354 MW,
with the total capacity reaching 3,939 MW, for which Inner Mongolia remains the leader in China and
greatly surpasses the provinces such as Liaoning (1,245 MW), Hebei (1,143 MW) and Jilin (1,085 MW).
The newly-added installed capacity in Chifeng, Inner Mongolia in 2008 was 500 MW, with the total
capacity exceeding 1,000 MW, becoming the first city breaking the milestone of 10 MW in China.
The rapid growth of Inner Mongolia is due to the following factors:
Firstly, Inner Mongolia is rich in wind resources. A general survey shows that in Inner Mongolia the
2
onshore 10-meter-high wind resource area with wind power density of more than 150W/m is 1.05
2
million km . In the area, approx. 1,000 GW can be installed. The area has good quality of wind
resources, non-destructive wind speed and plain terrain. It is favorable for broad wind farm. The
provinces adjacent to Inner Mongolia, such as Heilongjiang, Jilin, Hebei, Shanxi, Gansu and Xinjiang,
prefer to choose the areas near the boundary of Inner Mongolia for wind farm construction.
Another favourable factor of Inner Mongolia is its power grid conditions. The north and east side of
Inner Mongolia connects with Northeast Grid, and with China Northern Grid in the middle. Although
there is only independent regional power grid in the west of Inner Mongolia, it also has the conditions
of connecting with Northwest Grid. The strong grid linkage has provided the assurance for wind
power to be connected to grid. It is the advantage of Inner Mongolia that the other provinces such as
Xinjiang cannot compete with.
Last but not least, the government shows great interest by taking measures to encourage and
guarantee development of wind power industry. The government actively strives for concession
tender projects, and accommodates some 10 GW-level wind projects. Some local governments in
Inner Mongolia, such as Chifeng, Baotou, all made an ambitious development plan for wind power
promotion. It is planned to build large wind bases in Hulunbeier in the north; Huitengxile and
Wulanchabu in the middle; Saihanba in the east; and Bayanzhuoer and Baotou in the west of Inner
Mongolia. The government pointed out that by 2010, wind power installed capacity would reach
5,170 MW, accounting for 7.5 percent of the total installed capacity. There is a series of supporting
policies and measures issued by Inner Mongolian government to encourage various investors to build
wind farms there. As pushed by rapid growth of wind power installed capacity, Inner Mongolia
actively attracts wind turbine manufacturers to make investment and have localized production of
wind power equipment, forming a complete industrial chain, which is integrated into the economic
development of Inner Mongolia. Wind power equipment manufacturing zone has been created in
Baotou, attracting some businesses to invest, such as Goldwind, Erdos Baofeng, Dong’an Group, Sanyi
19
20. Background Paper: Chinese Renewables Status Report October 2009
Heavy Industry. And Vestas, Flanders, China Aerospace Science and Technology Corporation,
Guangdong Mingyang, and Ruineng Beifang have set up their businesses in Inner Mongolia to prepare
for competition.
3.9 Existing Problems and Barriers for Wind Power Development
China’s wind power industry has developed very fast for the past two years with an unprecedented
growth. However, it also can be seen that some problems and obstacles for development of wind
power industry will appear in future by analyzing current situation and looking into future.
3.9.1 Grid Connection Problems
In 2008, the newly-added installed capacity was 6,240 MW in China, with the total capacity reaching
12,150 MW. The installed capacity of 12,150 MW mainly benefits from the existing resources of grid
under the support of power grid operators. In the next few years, it is expected that China will still
have 5,000 and 8,000 MW added newly each year. With regard to building large bases connecting
with grid, since some of wind bases with 1 GW and 10 GW need long-distance and high-capacity
power transmission, new transmission projects shall be built. Currently, although the technology of
the power transmission system of the main grids with 220 KV and 500 KV has matured, it takes a long
time for construction planning. To build 10 GW-level wind power bases and transmit wind power on a
large scale in Xinjiang, Gansu, Inner Mongolia and other remote areas, it is necessary to build 750 KV
or 1,000 KV, EHV, AC, power transmission systems or ±600 KV and ±800 KV, EHV, DC power
transmission systems. These systems are still under testing, trial-manufacturing and commissioning,
thus the pace of development cannot be fast. Therefore, even if a power grid company attaches great
importance to and supports wind power development, in the next few years the 5,000-8,000 MW of
wind power that will be connected to power grid will impose pressure on power grid construction. It
can be estimated that in the next few years, the construction speed of wind farm in China will be
subject to that of the power grid connecting with wind power projects.
Xinjiang is a typical area showing that grid can restrict the development of wind power. Since Xinjiang
is an isolated small grid with the total installed capacity of only 8,000 MW, currently, the further
development of wind power is hard when wind turbines of approx. 600 MW (approx. 7.5 percent)
have been installed. The urgent issue to be solved is grid connection if Gansu builds the large wind
power base. In Northeast and Inner Mongolia, wind projects are delayed due to difficult grid
connection; wind turbines cannot be put into operation after installation; and wind power generation
is limited at the time of low load. This is quite common. In the next few years, the situation will be
worse.
3.9.2 Load Adjustment Problems
With 10 GW-level wind power being connected to the grid, besides transmission, it also needs to
solve the problem of power consumption. Wind power is variable, thus brings tremendous pressure
to load adjustment on the grid. The new problem resulted from wind power due to transmission, such
as the switch and dispatch of electricity between provincial and large power grids and pricing, will
20
21. Background Paper: Chinese Renewables Status Report October 2009
challenge the existing dispatch and management mode of power grid. Currently, comparing with
other technical problems of grid connection of wind power, such as reactive power regulation, static
and dynamic stability, harmonic interference and voltage flicker, the adjustment of active power/load
that might be the most important factor influencing the grid connection, which will be a key problem
that has to be solved.
3.9.3 Possible Surplus Capacity
The potential annual capacity is estimated at 30,000 MW in 2010 for the wind power equipment
assembly businesses under planning and construction in China, and might reach 60,000 MW by 2020,
a great difference compared with the expected annual market demand of 5,000-8,000 MW. It can be
predicted that supply deficit will appear in wind turbine market within the next few years. There are
70 businesses competing for wind turbine manufacturing. Most of them will face the danger of being
eliminated. Some unfavorable situations will make the readjustment of wind power industry come
earlier, such as adjustment of policies, less enthusiasm of investors for wind power projects and the
entry of foreign wind turbine manufacturers into domestic market.
3.9.4 Turn the Tendency from Favoring Capacity to Favoring Production
For a long time, there is a tendency that China pays more attention to power installation capacity
than power generation capacity and efficiency. In all plans and statistics, there is always data of wind
power installed capacity, but no clear data on the level of generation. In fact, power generation is the
final goal of installation, and the power output is essential for the efficiency of wind power projects.
Currently, it is not easy to gather the correct data of running wind farms in China in terms of actual
power generation. According to the statistics of 47 wind farms in 12 provinces and regions of China in
2007, Xinjiang was the highest with 2,401 utilization hours and Liaoning was the lowest with 1,325
hours. The average is 1,787 hours, having not achieved the expected 2,000 hours yet. According to
the data in 2008 China Wind Power Development Results Statistical Report issued by China’s
Hydropower Engineering Consultancy Group, by the end of 2008, the total production capacity of
wind power was 9,386 MW, and the total grid-connected generation was 14,829,106 MWh,
equivalent to 1,580 utilization hours on average. As a whole, the actual generation efficiency of China
wind power still needs to be improved. The actual generation of most of wind power projects in China
is lower than the expected figure. It is worth to consider and to learn lessons from the situation. If the
constructed wind farms being put into operation successively for the past years have not yet
generated profits after running for 2-3 years, this will lower the enthusiasm of investors for wind
power projects, which is harmful to the sustainable development of wind power industry.
3.9.5 Pricing Mechanism to be Improved
Provinces and regions played a very important role in determining feed-in tariff of wind power. It
should be avoided that there is a unified feed-in tariff for wind power in one region. Although most of
provinces in China are large in area, the wind areas in the same province may vary in wind resource
status. Taking Xinjiang as an example, its nine major wind areas are different from each other in wind
resource. Based on the preliminary data of wind monitoring, the wind resources in some small wind
21
22. Background Paper: Chinese Renewables Status Report October 2009
areas such as Xiaocaohu and Santanghu are much different from those in Dabancheng. If they have
the same feed-in tariff, the economic benefit/policy effectiveness will be very low. Although
Guangdong has the feed-in tariff fixed at RMB0.689/kWh, but the wind condition in the west (such as
Leizhou Peninsula) is clearly different from the east (such as Nan’ao). Therefore, it is wise and
reasonable to set feed-in tariff based on natural conditions of each wind area.
4 Solar Sector
4.1 Solar Water Heater
4.1.1 Solar Resources
1. Introduction
China can be divided into four areas by annual solar radiation in1971-2000. As shown in Figure 2, the
solar resources of the four areas are shown in Table 1.
Figure 2 Division of solar resource in China (Disregard Dongsha, Xisha, and Nansha islands)
22
23. Background Paper: Chinese Renewables Status Report October 2009
Area of Excellent Solar Resource
2
In this area, the irradiation is over 1750 kWh/m a, and the ratio of the maximum number of available
days to the minimum number of available days on a monthly basis is smaller. The annual change is
steady. The belt has the best utilization conditions of solar energy. Most parts of Tibet, the southern
part of Xinjiang, Qinghai, Gansu, and the west of Inner Mongolia are included in the belt.
Area of Very Good Solar Resource
2
In this area, the irradiation is 1400-1750 kWh/m a. The yearly change of available days is steady. But
in Hengduan Mountains and the Southeast Coastline, the ratio of the maximum to the minimum
number of available days on a monthly basis is over 2. The days on which solar energy cannot be used
increase sharply. This belt includes the Northern Xinjiang, Northeast of China, Eastern Inner Mongolia,
Northern China and the Northern Jiangsu, the Loess Plateau, the east of Qinghai and Gansu, the area
from the West of Sichuan to Hengduan Mountains, the coastline of Fujian and Guangdong, and
Hainan.
Table1 Distribution of Solar Resources in China (excl. Dongsha, Xisha and Nansha Islands)
Category No. Indicator Percent of total land Areas
area of China
(kWh/ m2·a)
Most parts of Tibet, South
Excellent solar Xinjiang, Qinghai, Gansu and
I ≥1,750 17.4 percent West Inner Mongolia.
resource
Most parts of Xinjiang, the east
of Qinghai and Gansu, Ningxia,
Shaanxi, Shanxi, Hebei, the
Very good northeast of Shandong, the
II 1,400-1,750 42.7 percent north of Inner Mongolia, the
solar resource
southwest of Northeast China,
Yunnan, the west of Sichuan.
Heilongjiang, Jilin, Liaoning,
Anhui, Jiangxi, the south of
Shanxi, the northeast of Inner
Good solar Mongolia, Henan, Shandong,
III 1,050-1,400 36.3 percent
resource Jiangsu, Zhejiang, Hubei, Hunan,
Fujian, Guangdong, Guangxi, the
east of Hainan, Sichuan, Guizhou,
the southeast of Tibet, Taiwan
23
24. Background Paper: Chinese Renewables Status Report October 2009
The midland of Sichuan, the
Modest solar
IV <1,050 3.6 percent north of Guizhou, the northwest
resource
of Hunan.
Area of Good Solar Resources
2
In this area, the irradiation is 1,050-1,400 kWh/m a. The ratio of the maximum to the minimum
number of available days on a monthly basis is over 2. The yearly change of available days is evident.
The season with the minimum number is unfavorable for the utilization of solar energy. This belt
includes: the Southeastern mountain of China, Han River, and Western Sichuan, Guizhou and Guangxi.
Area of Average Solar Resource
2
In the area, the irradiation is less 1050 kWh/m a, with the lowest solar radiation. This belt includes:
the middle of Sichuan, Northern Guizhou and Northwest of Hunan. In the belt, there are only 1-2 days
with solar radiation time of more than 6 hours in Chongqing. Besides July and August are the two
months with average 18 days of solar irradiation of 6 hours, there are less than 9 days in the other
months.
2. Review on Potential of Development and Utilization
2
During 1971-2000, the area that have more than 1,050 kWh/m a solar irradiation on a yearly basis
(Category I, II and III) accounted for approximately 96 percent of the total land area. Except for
Sichuan Basin and its neighbor areas, the solar resources of most of areas of China are better than or
equal to that of other countries at same latitude, even much better than that of the countries in
Europe, and Japan. Generally speaking, China’s solar resources are rich, and the conditions of most
areas enable solar energy resources to be popularized and applied. With the rapid development of
China’s economy, solar water heating (SWH) has been better popularized and utilized in China for the
last decades.
4.1.2 Market Status
1. Market Size
2
In 1992, China’s production of SWH reached 500,000 km , and accounted for 50 percent of the global
output for the first time. China has been the biggest SWH producer ever since. In 1998, China’s SWH
2
output was 3.5 million km , with the sales revenue of RMB2.5 billion and the capacity in operation of
2 2
15 million km . In 2008, the output was 31 million km , with the sales revenue of RMB43 billion and
2
the capacity in operation of 135 million km , accounting for 81 percent of the global output.
24
25. Background Paper: Chinese Renewables Status Report October 2009
Table 2 Annual Output and Capacity of SWH in China (1998-2008)
Total Output Annual Accumulative Capacity
Annual Output
Area Area Year-Over-Year
Year Growth Value
(million MWth (million MWth Growth (%)
( %)
2 2
km ) (RMB100) km )
million)
1998 3.5 2,450 -- 25.0 15 10,500 --
1999 5 3,500 42.9 40.0 20 14,000 33.3
2000 6.4 4,480 28.0 60.0 26 18,200 30.0
2001 8.8 5,740 28.1 93.8 32 22,400 23.1
2002 10 7,000 22.0 105.6 40 28,000 25.0
2003 12 8,400 20.0 115.0 50 35,000 25.0
2004 13.5 9,450 12.5 150.0 62 43,400 24.0
2005 15 10,500 11.1 200.0 75 52,500 21.0
2006 18 12,600 20.0 270.0 90 63,000 20.0
2007 23 16,100 27.8 320.0 108 75,600 20.0
2008 31 21,700 34.8 430.0 135 94,500 25.0
In the 1990’s, the State Economic and Trade Commission developed the 9th FYP and 2010 SWH
2
Development Plan. It was expected that China’s SWH total availability would reach 13 million km by
2
2000, and 43 million km by 2010. The target of 2010 has been reached successfully in 2004. At the
2 2
current speed, China’s SWH total availability will exceed 150 million km by 2010, and 300 million km
by 2020.
2 2
In 2007, the SWH per capita was only 83 m per thousand persons. In 2008, it was 94 m per thousand
persons, less than that of the European Union.
2. Domestic Market
The market of China’s SWH is classified into residential SWH market for urban areas, residential SWH
market for rural areas and SWH market for organizations.
Residential SWH market for urban areas
25
26. Background Paper: Chinese Renewables Status Report October 2009
SWHs are first introduced in urban areas in China. Since 1979 when China started the economy
reform and opening-up, people’s living conditions have been improved dramatically. In the 1980s,
after the residents in towns have possessed colorful TV sets and refrigerators, domestic hot water use
has become the important desire. Water heater is a necessity to meet the desire. In the 1990s, China
carried out the housing policy reform shifting from welfare-oriented public housing to commercial
housing. The housing condition of residents in urban areas has been improved stage by stage,
bringing huge demand for SWHs. In this period, the technologies of SWH are improved continuously,
with enhanced products and cost-effectiveness. Table 3 shows the comparison of cost-effectiveness
of three types of SWHs. SWHs are increasingly popular among residents for their advantages such as
energy saving, environment protection, safety and cost-efficiency. The market share of SWHs
increased year after year, from 15.2 percent in 2001 to 50.8 percent in 2008. Table 4 shows the
change of market share of three types of SWHs in 2001-2008.
Table 3 Comparison of the cost-efficiency of the Three Types of SWHs
Electric Water Gas Water Solar Water
Items
Heater Heater Heater
Hot Water Supply
100 100 100
(litre/day)
Equipment
1,200 1,000 1,800
Investment (RMB)
Annual Operational
500 350 5
Cost (RMB)
Lifetime (year) 8 8 10
Average Annual
Investment in 650 560 185
Lifetime (RMB)
Table 4 Market Share of the Three Types of SWHs (2001-2008)
Electric Water Heater
Year Gas Water Heater (%) Solar Water Heater (%)
(%)
2001 30.00 54.80 15.20
2003 44.23 37.57 22.20
2005 45.20 26.57 28.23
2007 42.30 19.20 38.50
2008 49.2 50.8
26
27. Background Paper: Chinese Renewables Status Report October 2009
Residential SWH market in rural area
Over the past few years, China has carried out the new countryside construction. Some local
governments have installed SWHs for farmers, and give the farmers a subsidy of 30-70 percent for
buying SWH. This promotes the expansion and popularity of SWHs in rural areas. In 2009, Chinese
government lists SWH into the plan named “Household Appliances to Rural Areas”, which will further
promote application and expansion of SWH in rural areas. It is predicted that, by 2020, the availability
of SWH in rural area and township will account for 60 percent. In the next decade, the residential
SWH market for rural areas will become the largest one in China.
SWH market for public utilizations
Since the end of 1990s, the Chinese Government has paid more attention to environmental
protection, and has implemented the policy using petrol or gas instead of coal in the public
organizations in urban areas. By the end of 2000, small- and medium-sized boilers had been
prohibited in most towns in China. These policies promoted the popularity and application of SWH
systems. More and more hotels, schools, hospitals and factories are equipped with SWH system for
environmental protection and lower running cost.
Since 2000, the concept to integrate solar energy into buildings has been put forward. It has gained
remarkable achievement for nearly 10 years. China has issued 35 policies and laws related to it, which
will promote the development of the integration. The integration will be a key market for solar energy
engineering in the next decade.
In addition to this, SWH system can be applied in providing hot water for industry, heating,
air-conditioning, drying, agriculture, aquiculture and desalinating.
3. Export
The export of SWH from China to the rest of the world has increased gradually since 2001. The gross
export value of SWH was USD10 million in 2001. It reached USD65 million in 2007, increased by 5.5
times that of 2001. See Table 5 for the export of SWH in 2001-2007.
Table 5 China’s Export of SWH (2001-2007)
Year 2001 2002 2003 2004 2005 2006 2007
Export Value 1,000 1,200 1,450 1,700 2,000 4,000 6,500
(USD)
Growth (%) 20.0 20.8 17.2 17.6 100 62.5
China’s SWHs have been exported to more than 80 countries and regions, including the developed
countries like Germany, Italy, Denmark, the Netherlands, Japan, and Canada, as well as the
developing countries such as Philippines in the Southeast Asia, Middle East, Africa, and South
America.
27
28. Background Paper: Chinese Renewables Status Report October 2009
The exported products include all-glass evacuated heat collecting tube, heat collector with evacuated
tube, water heater with evacuated tube, flat plate SWH. They are mostly exported to 32 countries and
regions in Europe, Africa and Southeast Asia. The all-glass evacuated heat collecting tube and the heat
collector with evacuated tube are mainly exported to the developed countries in Europe. The water
heater with evacuated tube and the flat plate SWH are mainly exported to the Southeast Asia and
Africa.
4.1.3 Government Administration and Related Policies
1. Government Administration
China has shifted from Command Economy to Market Economy since 1975. In the era of Command
Economy, the original State Development Planning Commission and the State Economic and Trade
Commission were mainly in charge of the planning and development strategies of SWH industry. Prior
to 1983, the pilot demonstration and technology commercialization of the industry was managed by
the State Science and Technology Commission, and those of energy technologies for rural areas
(including utilization technologies of solar energy) by the Ministry of Agriculture (MOA) since 1983.
Since the end of 1990s, with the development of China SWH industry, NDRC has developed the
planning and development strategies for the SWH industry to promote the integration of SWH into
buildings, which is a tendency in the future. So the Ministry of Construction (MOC) started to take the
lead of the pilot demonstration and technology commercialization of the integration.
2. Policies and Planning
In 1975, the original State Science and Technology Commission held the first National
Experience-sharing Sessions in utilizing solar energy in Anyang, Henan Province. Since then the
promotion and research of solar energy were incorporated into the state plan, receiving special funds
and material support. Some universities and research institutions established the projects and
th th
departments for solar energy research. It unfolds an upsurge of solar energy R&D. In the 6 , 7 , and
th
8 Five Year Plans, the state supplied a large number of funds to organize the research of SWH
technology. A series of high grade technologies and products, such as all-glass evacuated heat
collecting tube and heat collector with evacuated tube, have been developed successfully, laying a
sound foundation for the commercialization of SWH in China.
In 2003, the UNF funded NRDC and MOC to carry out a project named “Global Practice in the
Integration of SWH and Buildings and Its Reference to China”. With the help of UNF, China has
developed the standards and norms related to the integration, improved design plans, carried out
pilot demonstration and organized visits to foreign countries. This accelerated the process of the
integration of SWH into buildings. Some model communities for the integration have been set up in
Beijing, Shanghai, Jiangsu, Yunnan, Shandong, Liaoning and Tianjin. The pilot demonstration also
obtained better affects.
The ECL, which was implemented on January 1, 1998 and amended on April 1, 2008, has the
provisions encouraging to promote and apply renewable and new energy sources like solar energy,
28
29. Background Paper: Chinese Renewables Status Report October 2009
and to use renewable energy systems during energy-saving reconstruction of new and existing
buildings.
st
The ReLaw, which came into effect on 1 January, 2006, rules that the state encourages organizations
and individuals to install and use SWH system, solar energy heating system and solar photovoltaic
system. The State Council appoints the related departments to develop technical economy policies
and technical specifications for the integration. Real estate developers are expected to provide the
necessary conditions for the use of solar energy in the design and construction of buildings.
st
The Ordinance on Energy-Saving of Civil Buildings, which came into effect on 1 October, 2008, rules
that the state encourages and supports to use renewable energy, such as solar energy and
geothermal energy, during energy-saving reconstruction of new and existing buildings. The local
governments in the places that have the condition of using solar energy are expected to take effective
measures to encourage and support organizations and individuals to install and use SWH, solar
lighting, solar heating and solar heating/cooling systems.
Since 2006, some local governments, such as Jiangsu Province, Baoding and Xingtai in Hebei Province,
Sanmenxia and Nanyang in Henan Province, Yantai, Qingdao and Zibo in Shandong Province, Dalian in
Liaoning Province, Hainan Province, and Anhui Province, have issued 35 local policies and regulations
on the integration of solar energy and buildings.
From 2006 to 2008, MOC and MOF have implemented demonstration projects of renewable energy
throughout the country. The projects are mainly for solar and heat pump energy-saving technologies.
With the above efforts, China has obtained a lot of experience in the integration of SWH with villa,
multi-storey and small high-rise dwelling buildings, which lays a foundation for the future
development.
3. Standards and Certification
Until recently, twenty national standards and three industrial standards for SWH industry have been
issued, formed a standard certification system. In particular, in recent years, the original national
standards have been revised for all-glass evacuated heat collecting tube, flat plate SWH, heat
collector with evacuated tube, and residential SWH. And some new national standards were
constituted, such as the Technical Specification for Application of SHW in Civil Buildings and the
Specification for Evaluation of SWH. Some places have issued related local standards. They ensure the
healthy development of solar energy industry.
At the end of 2008, the Solar Energy Standardization Committee was founded, with a dedication to
the planning, development and review of national standards for solar energy industry. Up to now
there are two state-level testing centers for solar energy products, and two certification centers,
which are Golden Sun Certification Center (for product quality) and Ten Rings Certification Center (for
environmental performance).
29
30. Background Paper: Chinese Renewables Status Report October 2009
4.1.4 Industry Development
1. Scale
2
Over the past ten years, the SWH output and sales increased from 3.5 million m and RMB2.5 billion
2
in 1998 to 31 million m and RMB43 billion in 2008 by nearly 8 times. According to 2007 statistics,
there were more than 3000 SWH manufacturers of which nearly 50 had output value of over RMB50
million, with a market share of 46.9%; 25 had output value of over RMB100 million, with a market
share of 31.2%; 4 had output value of more than RMB500 million; and 2 had output value of over
RMB1.5 billion.
Table 6 shows the market share of leading businesses (2001-2007). According to the table, we can
conclude that their market share is increasing year by year. The market share increased from 20% in
2001 to 46.9% in 2007. It was expected it would reach more than 50% soon.
Table 6 Market Share of Leading Businesses (2001-2007)
Leading businesses (revenue Large leading businesses
over RMB50 M) (revenue over RMB100 M)
Annual sales
Year
(RMB100 M) Annual sales Annual sales
(RMB100 M) Market (RMB100 M) Market
share (%) share (%)
2001 93.8 18.8 20.0 12.2 13.0
2002 105.6 21.1 20.0 16.1 15.2
2003 115.0 34.5 30.0 20.2 17.6
2004 150.0 57 38.0 31.5 21.0
2005 200.0 90 45.0 48 24.0
2006 270.0 120 44.4 75 27.8
2007 320.0 150 46.9 100 31.2
2. Industry System
Up to now, China’s SWH industry has formed an integral chain ranging from the raw materials to
collector and water heater products. The industry includes manufacturing, marketing, design,
equipment, and after-sales service. It has promoted the development of raw material sectors such as
glass, metal, and insulation materials, as well as manufacturing sectors such as metal processing,
welding equipment, evacuated equipment, rubber and plastic products, electrothermal tube, and
30
31. Background Paper: Chinese Renewables Status Report October 2009
electronic meters and instrumentation. By the end of 2007, there were 45 factories that produce raw
glass for evacuated tube, 115 kilns, and 996 production lines for evacuated tube coating. The annual
production of evacuated tube was 250 million pieces. The industry created more than 2.5 million jobs.
Raw glass production is mainly concentrated in Shandong, Hebei, Henan, Chongqing, and Zhejiang
Provinces; evacuated tube production is concentrated in Beijing, Shandong, Jiangsu, Zhejiang, and
Anhui; and SWH production is concentrated in Beijing, Shandong, Jiangsu, Zhejiang, Anhui,
Guangdong, and Yunnan.
3. Corporate investment and financing
In recent years, many SWH businesses in China have increased investment, upgraded the production
equipment and transformed technology. Some production lines were set up, such as automatic
all-glass evacuated tube coating production line, enamel pressure water tank automatic production
line, support production line, and fluorine-free foam insulation materials production line. Some
businesses set up production bases in other regions of China and foreign countries. Meanwhile, some
foreign businesses invested in china in the forms of wholly-owned factories or joint ventures. They
mainly produce plate or evacuated tube heat collectors and most of the outputs are exported.
Since 2007 some civil and foreign investment and financing institutions began to set foot in China’s
SWH industry. Goldman Sachs Group and CDH International signed a letter of intent (LOI) with Himin
Solar Energy Group in Shandong. They injected USD100 million into Himin in their first investment so
as to promote the public listing of Himin. It is expected that more investment institutions will invest
the SWH industry.
4.1.5 R&D
1. Research results
The 15-year period from 1978 to 1992 was the stage focusing on R&D of SWH industry. A series of
scientific research results were gained, which laid the technical foundation for the future
development of the SWH industry. The research results are as follows:
Since late 1970s China started to research and make solar energy absorbing layers. Beijing Institute of
Chemical Technology, Tianjin University, Beijing Solar Energy Research Institute, Xi'an Institute of
Chemical Engineering, and Solar Energy Research Institute of Xinjiang used spraying and sol-gel
technique to make different solar coatings like lead sulfide paint, acrylic resin paint and so on.
Tsinghua University, Beijing Solar Energy Research Institute, Institute of Electrical Engineering,
Chinese Academy of Sciences, Liaoning Environmental Protection Research Institute applied chemical
and electrochemical technology to make selective solar absorption coating like PbS/Al, black chrome,
and electroplating nickel. Tsinghua University, Beijing Solar Energy Research Institute, Institute of
Electrical Engineering, and Liaoning Environmental Protection Research Institute employed
magnetron sputtering technology to make selective solar absorption coatings like Al/N/Al and
Cu/N/Al.
31