High Profile Call Girls Nagpur Meera Call 7001035870 Meet With Nagpur Escorts
Presentation 4 ce 904 on Hydrology by Rabindra Ranjan Saha,PEng, Associate Professor WUB
1. 1
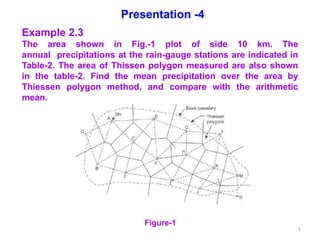
Example 2.3
The area shown in Fig.-1 plot of side 10 km. The
annual precipitations at the rain-gauge stations are indicated in
Table-2. The area of Thissen polygon measured are also shown
in the table-2. Find the mean precipitation over the area by
Thiessen polygon method, and compare with the arithmetic
mean.
Figure-1
Presentation -4
2. 2
Stations Recorded rainfall (Pi )
(cm)
Area of polygon ai
(km2)
A 8.8 570
B 7.6 920
C 10.8 720
D 9.2 620
E 13.8 520
F 10.4 550
G 8.5 400
H 10.5 650
I 11.2 500
J 9.5 350
K 7.8 520
L 5.2 250
M 5.6 350
Data Table-1
Presentation -4(contd.)
3. 3
Solution
Given, Area of plot side is = 10 km2 away
Rainfall at A to M gauge stations are given in the Table-1
Rainfall data and
Thissen polygon area measured are also given in the table-1
To be calculated mean precipitation of those stations by
Thissen polygon method and Compare with the arithmetic
mean.
Presentation -4(contd.)
4. 4
We know mean precipitation by thissen method for M stations,
M
Pavg = ∑Pi Ai / A
i where, i = A,B,C.....M
For station A, PAAA = 8.8 *570 = 5016
B, PB AB = 7.6 *920 = 6992
C , PC AC = 10.8*720 =7776
D , PD AD = 9.2 *620 = 5704
E , PE AE = 13.8*520 = 7176
F , PF AF = 10.4*520 = 5720
G, PG AG=8.5 * 400 = 3400
H , PH AH = 10.5*650 = 6825
I , PI AI= 11.2*500 = 5600
J, PJ AJ = 9.5*350 = 3225
K, PKAK = 7.8*520 = 4056
L, PL AL = 5.2 * 250 = 1300
M, PM AM = 5.6*350 = 1960
M
∑Pi Ai = 66714
I
Presentation -4(contd.)
5. 5
Stations Recorded rainfall
(Pi ) (cm)
Area of polygon Ai
(km2)
Product of
Ai *Pi km2 cm
Pavg = Total
(Ai *Pi ) / A (cm)
A 8.8 570 5016 0.72
B 7.6 920 6992 1.01
C 10.8 720 7776 1.12
D 9.2 620 5706 0.82
E 13.8 520 7176 1.04
F 10.4 550 5720 0.83
G 8.5 400 3400 0.49
H 10.5 650 6825 0.99
I 11.2 500 5600 0.81
J 9.5 350 3225 0.47
K 7.8 520 4056 0.59
L 5.2 250 1300 0.19
M 5.6 350 1960 0.28
N = 13 ∑Pi = 118.90 ∑Ai =6920 64752 9.36
Solution(contd.)
Putting respective values in the above equation
M
Pavg = ∑Pi Ai / A and inserted in the
i
Data table
Pavg = 9.36 cm
Presentation -4(contd.)
6. 6
Calculation of mean precipitation by arithmetical mean
method for comparison:
N
Pavg = 1/N ∑Pi , where, i = 1,2,3....N
i
Stations Recorded rainfall (Pi )
(cm)
A 8.8
B 7.6
C 10.8
D 9.2
E 13.8
F 10.4
G 8.5
H 10.5
I 11.2
J 9.5
K 7.8
L 5.2
M 5.6
N = 13 ∑Pi = 118.90
Presentation -4(contd.)
7. 7
Putting the concerned values in the above equation from
the Table
Pavg = (1/13) (118.90) = 9.15 cm
Comparison:
Pavg Calculated by Arithmetical mean method is (9.36 – 9.15)
= 0.21 cm less compared to Pavg calculated by Thissen
Polygon method .
Presentation -4(contd.)
8. 8
(3) Isohyetal Method :
A isohyetal is a line joining points of equal rainfall
magnitude.
Procedure
The catchment area is drawn to scale and the rain gauge stations
are marked .The recorded values for which areal average P is to
be determined is then marked on the plot at appropriate stations.
Neighboring stations outside the catchment are also considered.
The isohyets of various values are then drawn by considering
point rainfalls as guides and interpolating by the eye.
Presentation -4(contd.)
9. 9
•B 7.8
10
G•4
•D 8
8.2
•C
•12
•E9.1
6
8
A •7.6
• F 9.8
Catchment boundary
8 10
6
Isohyet
4
4
The area between two adjacent isohyets are then measured
by planimeter. Figures in cm.
If the isohyets go out of the catchment, the catchment
boundary is used as the bounding line.
Rain gauge station : •
Figure-2:- Isohyets of storm
Presentation -4(contd.)
10. 10
The average /mean value of rainfall indicated by two
isohyets is assumed to be acting over the inter-
isohyet area.
Calculation of average precipitation Pavg
Assume P1, P2, P3, ......................Pn are the value of
isohyets and a1, a2, a3, .............................an-1 are inter
isohyets areas respectively. Then
A = a1+ a2 + a3,+.............................+ an-1 + an
Where, A = total catchment area
and Pavg = Average/Mean precipitation
Presentation -4(contd.)
11. 11
So, Average / Mean precipitation :
Pavg ={ a1 (P1 + P2) / 2 + a2(P2 + P3)/2 + ..... + an ( Pn +Pn+1)/2}/A
n
Pavg = [∑{ai (Pi + Pi+1) / 2}]/A
i
This method is very much useful other than the two
especially when the stations are large.
Weightage Factor = ai / A
Presentation -4(contd.)
12. 12
Example 2-3:
The isohyets due to a storm in a catchment was
drawn(Figure- 2 above) and the area of the catchment
boundary by isohyets were tabulated as below: Estimate
the mean precipitation due to storm.
Isohyets (cm) Area (km2)
Station – 12.0 30
12.0 – 10 140
10.0 – 8.0 80
8.0 – 6.0 180
6.0 – 4.0 20
Solution:
Given,
Isohyets values from figure are in table
Area bounded by isohyets are also in the table
Presentation -4(contd.)
13. 13
For the 1st area consisting of a station surrounded by a
closed isohyets, a precipitation value of 12.0 cm is taken.
For all other areas, the mean of two bounding isohyets are
taken.
As we know from isohyets method mean precipitation
n
Pavg = [∑{ai (Pi + Pi+1) / 2}]/A
i
Pavg ={ a1 (P1 + P2) / 2 + a2(P2 + P3)/2 +....+ an( Pn +Pn+1)/2}/A
1st isohyets bounding 12 = { a1 (P1 )} = 30 * 12 = 360 km2cm
2nd isohyets, ={ a2 (P2 + P3) / 2 = (12 + 10)/2*140 = 1540 km2cm
3rd isohyets, = ={ a2 (P2 + P3) / 2 = 80*(10 + 8)/2 = 720 km2cm
Presentation -4(contd.)
14. 14
Isohyets (cm) Area (km2) ai (Pi + Pi+1) / 2 {ai (Pi + Pi+1) / 2}/A
(cm)
Station – 12.0 30 360 0.80
12.0 – 10 140 1540 3.42
10.0 – 8.0 80 720 1.60
8.0 – 6.0 180 1260 2.80
6.0 – 4.0 20 100 0.22
Total = A = 450 Pavg = 8.84
Putting the values in the calculation table
Presentation -4(contd.)
15. 15
Example -2-3(a)
The isohyets due to a storm in a catchment were drawn (Figure-3)
and the area of the catchment boundary by isohyets were
tabulated as below: Estimate the mean precipitation due to storm.
Isohyets (cm) Area (km2)
2.0-2.5 55.2
2.5-3.0 48.3
3.0-3.5 45.1
3.5-4.0 28.5
4.0-4.5 30.4
4..5-5.0 29.6
5.0-5.5 32.7
5.5-6.0 25.6
2.5
4.0
4.5
5.0
5.5
4.0
3.5
3.0
2.5
3.5
6.0
5.5
4.5
2.0
3.0
2.0
6.0
5.0
Figure-3
Presentation -4(contd.)
16. 16
Solution
Given-
Precipitation of different stations and its cotours
isohyets
Area in between the isohyets are in the table
To be calculated mean /average precipitation of those
stations
Sketch of catchment area with isohyets are drawn as below :
Presentation -4(contd.)
17. 17
We know according to Isohyets method mean precipitation
Pavg ={ a1 (P1 + P2) / 2 + a2(P2 + P3)/2 + ....... + an ( Pn +Pn +1)/2}/A
weightage area = a1/A = 55.2/ 295.4 = 0.1868 Km2 cm
2.0
2.0
2.5
2.25
Presentation -4(contd.)
18. 18
Isohyets
(cm)
ai (Pi + Pi+1) / 2
Average value
of /contour
(cm)
ai
Area
(km2)
ai (Pi + Pi+1) / 2
Km2 cm
Pavg =
n
[∑{ai (Pi + Pi+1) / 2}]/A
i
(cm)
2.0-2.5 2.25 55.2 124.20
1099.2/295.4
= 3.70
2.5-3.0 2.75 48.3 132.8
3.0-3.5 3.25 45.1 146.6
3.5-4.0 3.75 28.5 106.9
4.0-4.5 4.25 30.4 129.2
4..5-5.0 4.75 29.6 140.6
5.0-5.5 5.25 32.7 171.7
5.5-6.0 5.75 25.6 147.2
Total = 295.4 1099.2 3.70
Calculation table
Presentation -4(contd.)
19. 19
Chapter-3
Frequency of Point Rainfall
Probability and Return Period:
Probability means that the event will occur.
Mathematically, the probability that an event will
occur is expressed as a number between 0 and 1.
Notationally, the probability of event A is represented
by P(A).
Presentation -4(contd.)
20. 20
The probability of occurrence of a particular
extreme rainfall e.g. a 24-h maximum rainfall, will be
importance. Such information is obtained by the
frequency analysis of point-rainfall data. The rainfall at a
place is a random hydrologic process and the rainfall
data at a place when arranged in chronological order
constitute a time series.
Frequency analysis of this time series will represent the
probability occurrence.
Presentation -4(contd.)
21. 21
Frequency is the number of occurrence in a
definite interval in a time series i.e. an event
occurring in a time series.
Probability of Occurrence (p)
The probability that an event of the specified magnitude
will be equaled or exceeded during a one year period.
Probability of Nonoccurrence (q)
The probability that an event of the specified magnitude
will not be equaled or exceeded during a one year period.
Presentation -4(contd.)
22. 22
Return Period: The occurrence interval is known as
Return Period which is denoted by T.
The Return period and Probability are inversely related to each
other. That is P = 1/T and T = 1/P
For example, the probability of a 50 year storm occurring
in a one year period is 1/50 or 0.02
The probability of occurrence and probability of non
occurrence are related by the fact that something must
either occur or not occur, so, p + q = 1
Presentation -4(contd.)
23. 23
Mathematical calculation of Probability
The binomial distribution can be used to find the probability of
occurrence of the event r times in n successive years, Thus
Pr,n = n C r Pr qn-r = [n! / {(n-r) ! r ! }] Pr q n-r
Where, Pr,n = probability of a random hydrologic event (rainfall)
of given magnitude and exceedence probability P occurring r
times in n successive years.
Presentation -4(contd.)
24. 24
Example :
(a)The probability of an event of exceedence probability P
occurring 2 times in n successive years is
P2, n = {n ! / (n-2)! 2! } P2 qn-2
(b) The probability of the event not occurring at all in n
successive years is
P0, n = qn = (1- P)n
(c)The probability of the event occurring at least once in n
successive years
P1 = 1 – qn = 1 – (1-P)n
Presentation -4(contd.)
25. 25
Example 3-1
Analysis of data on maximum one-day rainfall depth at Madras
indicated that a depth of 280 mm had a return period of 50
years. Determine the probability of one-day rainfall depth equal
to or greater than 280 mm at Madras occurring
(a) one in 20 successive years
(b) two times in 15 successive years and
(c) at least once in 20 successive years.
Solution
Given
Rainfall depth = 280 mm
Return Period, T = 50 years
Presentation -4(contd.)
26. 26
Return Period, T = 1/P , P = 1/T = 1/50 = 0.02
To be calculated the probability for
(a) one in 20 successive years
given n = 20 , r = 1
We know, Pr,n = { n! / (n-r) ! r ! } P r q n-r
Putting value of r and n in the above equation
P1,20 = { 20! / (20-1) ! 1 ! } P 1 (1-P) 20-1
= { 20! / (20-1) ! 1 ! } (0.02)1 (1-0.02) 20-1
= 20 x 0.02 x 0.9819
= 0.272
Presentation -4(contd.)
27. 27
(b) Given,
n = 15 , r = 2
We know,
Pr,n = [ n! / {(n-r) ! r ! }] P r q n-r
P2,15 = [15! / {(15-2) ! 2 !}] x (0.02) 2 (1-0.02) 15- 2
= 0.0323
(c) at least once in 20 successive years.
Given,
n = 20 years ; r = 1
Pr = 1 – qn = 1 – (1 –P)n
Putting the respective values in the above equation
P1 = 1 – (1- 0.02) 20
P 1 = 1 – (0.98) 20 = 0.332
Presentation -4(contd.)