Raddon Chart of the Day, December 22, 2011
•Télécharger en tant que PPTX, PDF•
1 j'aime•220 vues

The document contains charts from Raddon Financial Group summarizing data from their national consumer research in Fall 2011. The charts show trends in consumers purchasing investment services from their primary financial institution, awareness of investment services offered, participation in work-related retirement plans, comfort levels with investment decisions and savings levels, and economic expectations. The charts also show spending and savings habits compared to a year ago and opinions on the current state of the economy.

Recommandé
Recommandé
Contenu connexe
Tendances
Tendances (16)
En vedette
En vedette (20)
Similaire à Raddon Chart of the Day, December 22, 2011
Similaire à Raddon Chart of the Day, December 22, 2011 (20)
Plus de Raddon Financial Group
Plus de Raddon Financial Group (20)
Dernier
Dernier (20)
Raddon Chart of the Day, December 22, 2011
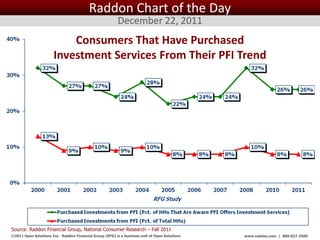
- 1. Raddon Chart of the Day December 22, 2011 Consumers That Have Purchased Investment Services From Their PFI Trend Source: Raddon Financial Group, National Consumer Research – Fall 2011 ©2011 Open Solutions Inc. Raddon Financial Group (RFG) is a business unit of Open Solutions Inc. www.raddon.com | 800.827.3500
- 2. Raddon Chart of the Day December 20, 2011 75% Consumers Awareness of PFI Offering Investment Services Trend 57% 54% 50% 44% 49% 50% 49% 50% 48% 48% 47% 44% 41% 38% 36% 36% 33% 34% 34% 34% 29% 29% 30% 25% 20% 20% 21% 16% 17% 16% 16% 17% 16% 15% 14% 0% 2000 2001 2002 2003 2004 2005 2006 2007 2008 2010 2011 RFG Study Primary Offers Primary Does Not Offer Do Not Know Source: Raddon Financial Group, National Consumer Research – Fall 2011 ©2011 Open Solutions Inc. Raddon Financial Group (RFG) is a business unit of Open Solutions Inc. www.raddon.com | 800.827.3500
- 3. Raddon Chart of the Day December 12, 2011 Investment Household Trend 60% 16,000 13,896 57% 12,302 55% 55% 12,000 11,679 54% 10,851 10,569 10,021 10,080 10,387 52% 9,275 9,712 51% 51% 50% 49% 8,000 7,592 49% 48% 47% 4,000 40% 0 2001 2002 2003 2004 2005 2006 2007 2008 2009 2010 2011 RFG Study Households with Any Investment Dow Jones Industrial Average Source: Raddon Financial Group, National Consumer Research – Fall 2011 ©2011 Open Solutions Inc. Raddon Financial Group (RFG) is a business unit of Open Solutions Inc. www.raddon.com | 800.827.3500
- 4. Raddon Chart of the Day December 7, 2011 Consumers’ Personal Situation Relative to a Volatile Stock Market Have Not Changed Investment Portfolio 32% Moved Some Money/Safer Mix 15% Moved All Money 3% Do Not Have Investments 50% 0% 10% 20% 30% 40% 50% 60% Source: Raddon Financial Group, National Consumer Research – Fall 2011 ©2011 Open Solutions Inc. Raddon Financial Group (RFG) is a business unit of Open Solutions Inc. www.raddon.com | 800.827.3500
- 5. Raddon Chart of the Day December 1, 2011 Consumers’ Participation in a Work-Related Retirement Plan Participate in Such a Plan 44% 56% Do Not Participate in Such a Plan Source: Raddon Financial Group, National Consumer Research – Fall 2011 ©2011 Open Solutions Inc. Raddon Financial Group (RFG) is a business unit of Open Solutions Inc. www.raddon.com | 800.827.3500
- 6. Raddon Chart of the Day November 29, 2011 Consumers’ Current Status Regarding Retirement 27% Currently Retired Retire within the Next 5 Yrs. 64% Will Not Retire for More 9% than 5 Yrs. Source: Raddon Financial Group, National Consumer Research – Fall 2011 ©2011 Open Solutions Inc. Raddon Financial Group (RFG) is a business unit of Open Solutions Inc. www.raddon.com | 800.827.3500
- 7. Raddon Chart of the Day November 21, 2011 Consumers’ Attitude About the Stock Market Stock Market Will Rebound/Best 31% Place for Long-Term Invest. Opportunities 49% Stock Market No Longer the Place to Invest Do Not Know 20% Source: Raddon Financial Group, National Consumer Research – Fall 2011 ©2011 Open Solutions Inc. Raddon Financial Group (RFG) is a business unit of Open Solutions Inc. www.raddon.com | 800.827.3500
- 8. Raddon Chart of the Day November 17, 2011 Consumers’ Preference for an Online Trading Firm Lowest Possible Stock Trading Fees 45% 55% Offers Wide Investment Selection/Does Not Have Lowest Trading Fees Source: Raddon Financial Group, National Consumer Research – Fall 2011 ©2011 Open Solutions Inc. Raddon Financial Group (RFG) is a business unit of Open Solutions Inc. www.raddon.com | 800.827.3500
- 9. Raddon Chart of the Day November 15, 2011 Consumers’ Online Trading Status and Interest in an Online Trading Service 60% 56% 50% 40% 31% 30% 20% 9% 10% 5% 0% Currently Trade Previously Traded Do Not Trade Not Comfortable Online Online/Not Currently Online/Would Using an Online Consider Using Brokerage Service Source: Raddon Financial Group, National Consumer Research – Fall 2011 ©2011 Open Solutions Inc. Raddon Financial Group (RFG) is a business unit of Open Solutions Inc. www.raddon.com | 800.827.3500
- 10. Raddon Chart of the Day November 10, 2011 Consumers’ Comfort Level in Making Investment Decisions 46% 54% Prefer to Receive Advice Comfortable Making Own Decisions Source: Raddon Financial Group, National Consumer Research – Fall 2011 ©2011 Open Solutions Inc. Raddon Financial Group (RFG) is a business unit of Open Solutions Inc. www.raddon.com | 800.827.3500
- 11. Raddon Chart of the Day November 9, 2011 Consumers’ Satisfaction with Current Savings Level 40% 34% 30% 30% 27% 20% 10% 9% 0% Very Comfortable Somewhat Somewhat Very Uncomfortable Comfortable Uncomfortable Source: Raddon Financial Group, National Consumer Research – Fall 2011 ©2011 Open Solutions Inc. Raddon Financial Group (RFG) is a business unit of Open Solutions Inc. www.raddon.com | 800.827.3500
- 12. Raddon Chart of the Day November 7, 2011 Consumers’ Personal Situation 30% 28% In The Next Six Months 25% 22% 21% 20% 19% 19% 18% 17% 16% 16% 15% 10% 10% 5% 0% Better Shape Worse Shape Fall '07 Fall '08 Fall '09 Fall '10 Fall '11 Source: Raddon Financial Group, National Consumer Research – Fall 2011 ©2011 Open Solutions Inc. Raddon Financial Group (RFG) is a business unit of Open Solutions Inc. www.raddon.com | 800.827.3500
- 13. Raddon Chart of the Day November 2, 2011 Consumers’ Current Spending Habits Compared To One Year Ago 8% Spending More 54% 38% Spending the Same Spending Less Source: Raddon Financial Group, National Consumer Research – Fall 2011 ©2011 Open Solutions Inc. Raddon Financial Group (RFG) is a business unit of Open Solutions Inc. www.raddon.com | 800.827.3500
- 14. Raddon Chart of the Day November 1, 2011 Consumers’ Current Savings Habits Compared To One Year Ago 18% 40% Saving More Saving the Same Saving Less 42% Source: Raddon Financial Group, National Consumer Research – Fall 2011 ©2011 Open Solutions Inc. Raddon Financial Group (RFG) is a business unit of Open Solutions Inc. www.raddon.com | 800.827.3500
- 15. Raddon Chart of the Day October 25, 2011 Consumers’ Economic Expectations For The Next Six Months 70% 60% 59% 50% 48% 46% 40% 39% 30% 30% 24% 27% 19% 23% 20% 21% 10% 12% 15% 18% 6% 9% 7% 0% Spring '08 Fall '08 Spring '09 Fall '09 Spring '10 Fall '10 Spring '11 Fall '11 Better Shape Worse Shape Source: Raddon Financial Group, National Consumer Research – Fall 2011 ©2011 Open Solutions Inc. Raddon Financial Group (RFG) is a business unit of Open Solutions Inc. www.raddon.com | 800.827.3500
- 16. Raddon Chart of the Day October 24, 2011 Consumers’ Opinion Regarding The Current State Of The Economy 13% Not Sure 11% Definitely See Evidence That the Economy 5% Is Improving 6% Just Begun to See Signs That the Recession 12% Is Ending 21% See No Evidence That the Recession Is 69% Over 61% 0% 10% 20% 30% 40% 50% 60% 70% 80% Fall '11 Spr. '11 Source: Raddon Financial Group, National Consumer Research – Fall 2011 ©2011 Open Solutions Inc. Raddon Financial Group (RFG) is a business unit of Open Solutions Inc. www.raddon.com | 800.827.3500