1. NREL is a national laboratory of the U.S. Department of Energy
Office of Energy Efficiency & Renewable Energy
Operated by the Alliance for Sustainable Energy, LLC
This report is available at no cost from the National Renewable Energy
Laboratory (NREL) at www.nrel.gov/publications.
Contract No. DE-AC36-08GO28308
Conference Paper
NREL/CP-5D00-74481
October 2020
Developing a Reduced 240-Bus WECC
Dynamic Model for Frequency
Response Study of High Renewable
Integration
Preprint
Haoyu Yuan, Reetam Sen Biswas, Jin Tan, and
Yingchen Zhang
National Renewable Energy Laboratory
Presented at the 2020 IEEE Power and Energy Society Transmission and
Distribution Conference and Exposition (IEEE PES T&D)
October 12–15, 2020
3. NOTICE
This work was authored by the National Renewable Energy Laboratory, operated by Alliance for Sustainable
Energy, LLC, for the U.S. Department of Energy (DOE) under Contract No. DE-AC36-08GO28308. Funding
provided by U.S. Department of Energy Office of Energy Efficiency and Renewable Energy Solar Energy
Technologies Office. The views expressed herein do not necessarily represent the views of the DOE or the U.S.
Government.
This report is available at no cost from the National Renewable
Energy Laboratory (NREL) at www.nrel.gov/publications.
U.S. Department of Energy (DOE) reports produced after 1991
and a growing number of pre-1991 documents are available
free via www.OSTI.gov.
Cover Photos by Dennis Schroeder: (clockwise, left to right) NREL 51934, NREL 45897, NREL 42160, NREL 45891, NREL 48097,
NREL 46526.
NREL prints on paper that contains recycled content.
4. 1
This report is available at no cost from the National Renewable Energy Laboratory (NREL) at www.nrel.gov/publications.
Developing a Reduced 240-Bus WECC Dynamic
Model for Frequency Response Study of High
Renewable Integration
Haoyu Yuan, Reetam Sen Biswas1
, Jin Tan, Yingchen Zhang
Power Systems Engineering center
National Renewable Energy Laboratory
Golden, CO, USA
{haoyu.yuan, reetam.senbiswas, jin.tan, yingchen.zhang}@nrel.gov
Abstract—The ongoing changes in the generation resource
mix, driven by the rapid adoption of inverter-based resources
(IBR) as well as the early retirement of synchronous generators,
are bringing new challenges to the planning and operation of bulk
electric power systems. Consequently, there is an increasing need
to understand, design, and quantify the reliability service
provision from IBRs by performing integrated scheduling and
dynamic simulations. Test systems that have consistent scheduling
and dynamic models rarely exist, however, largely because of the
decoupled nature of the two simulations on a synchronous
generator-dominated system. This paper develops the dynamic
model of a reduced Western Electricity Coordinating Council
(WECC) system. In conjunction with the existing scheduling
model, it is suitable for integrating scheduling and dynamic
simulations. The reduced 240-bus WECC model reflects the
generation resource mix of the Western Interconnection as of
2018. Moreover, the developed dynamic model is validated against
field frequency events measured by FNET/GridEye and preserves
the dominant inter-area oscillation mode in WECC.
Keywords—dynamic simulation, generation resource mix,
reduced WECC model, renewable energy.
I. INTRODUCTION
On March 16, 2019, utility-scale solar output in the
California Independent System Operator region peaked at
10,765 MW and was meeting 59% of the total load [1]. And on
May 24, 2013, Xcel Energy’s Colorado system set a record of
hourly wind energy penetration of 60.5% [2]. It is evidenced that
the electric power system is dominated by inverter-based
resources (IBRs) during light-load conditions in areas that
aggressively adopt renewable energy resources (RES). The
ongoing and fundamental changes in the generation resource
mix bring new challenges to the planning and operation of the
bulk electric power system.
The first challenge is that the electric grid needs for
reliability services, such as inertia and governor response, are
changing as RES penetration levels increase from one year to
another and RES generation varies hourly throughout the day.
The second challenge is that the technical and economic
characteristics of RES determine that the provision and
acquisition of reliability services will change drastically from
current practices, which are tailored for synchronous generators.
To properly address such challenges, integrated scheduling and
dynamic simulations need to be performed to enable different
stakeholders to understand and analyze both the economic and
technical characteristics of RES.
However, publicly available, interconnection-level models
suitable for integrated simulations are not present. Synthetic
electric grid cases [3] developed through the Advanced
Research Projects Agency-Energy grid data program include a
10,000-bus synthetic Western Electricity Coordinating Council
(WECC) system; however, this model resembles only the
footprint of the actual WECC system and misses necessary
information, such as startup/shutdown costs, to perform a unit
commitment study. The 179-bus reduced WECC system [4] was
developed based on system conditions during the late 1990s and
lacks scheduling information. The 240-bus reduced WECC
system developed in [5] provides comprehensive scheduling
information but lacks dynamic models. Moreover, the
generation resource mixes in both systems do not reflect current
grid conditions, which can be IBR-dominated.
The 240-bus WECC model in [5] is used as a starting point
because of its comprehensive scheduling information, which is
benchmarked against the operation data. On top of the model in
[5], this paper first develops a 2018 base case that reflects the
up-to-date generation resource mix [6]–[9], including installed
photovoltaic (PV) and wind capacities; and then it develops
high-fidelity dynamic models, including synchronous
generators, exciters, governors, and renewable models that are
validated against recorded events data of WECC. The National
Renewable Energy Laboratory (NREL) will make the developed
WECC 240-bus models publicly available to researchers and
stakeholders.2
Consequently, the developed base case and
dynamic model, combined with the scheduling model in [5],
serves as a good interconnection-level system to perform
integrated scheduling and dynamic simulations and serves as a
cornerstone to address the integration challenges of high
penetrations of RES. The two main contributions of this paper
are:
• Developed a 2018 WECC base case with the up-to-date
resource mix that can simulate high renewable penetrations
(up to 78%)
• Developed the dynamic model of the WECC system
that captures the interconnection-level dynamic responses
that are validated against recording data.
The remainder of this paper is organized as follows. Section
II presents the generation resource mix using publicly available
data. Section III introduces the development of the dynamic
model. Section IV validates the dynamic model against field
measurements. Section V concludes this work.
1
Reetam Sen Biswas is also with Arizona State University. 2
Link to the model will be available at https://github.com/harry-utk/240-Bus-
WECC-Systems.
5. 2
This report is available at no cost from the National Renewable Energy Laboratory (NREL) at www.nrel.gov/publications.
II. GENERATION RESOURCE MIX BASED ON 2018 DATA
The existing 240-bus system from [5] has a total capacity of
206 GW, including 2.0 GW PV and 6.6 GW wind. The IBR
takes less than 5% of the total capacity. This resource mix is a
representation of pre-2011 system conditions and is nowhere
close to the current resource mix.
Therefore, resource mix and generation capacity in this 240-
bus system is updated according to publicly available data [6]–
[9]. The updated resource mix for 11 U. S. western states, two
Canadian provinces, and northern Baja Mexico is shown in
Table I.
The 2018 Q3 data from the American Wind Energy
Association [6] are referred for the wind capacity data. The
utility-scale PV capacity is based on 2018 Q3 data from the
Solar Energy Industries Association [7]. Small-scale PV
(distributed PV; labeled DPV in Table I) capacity is based on
2018 Form EIA-861M from the U.S. Energy Information
Administration [8]. Generation capacity from other fuel types
(biomass, coal, geothermal, gas, hydro, nuclear, and pumped
storage) are extracted from Form EIA-860 [9] where fuel type
and capacity information of all generators in the United States
are provided. The generation capacity of Alberta, British
Columbia, and Mexico’s northern Baja California Peninsula are
based on a WECC planning case. Note that if the generation
capacity of a fuel type of a state is less than 1% of that state’s
total capacity, the capacity of that fuel type is assumed to be 0
to prevent adding too many small generators. This explains
some blank cells in Table I.
To match the generation capacity and mix shown in Table I,
the generation capacity of the existing 240-bus system is scaled
by a factor for each fuel and state combination. Some notable
exceptions:
• The San Onofre nuclear plant in California was retired in
2013. Instead of scaling down the two nuclear generators
in California, the San Onofre generator is removed in the
new case.
• Instead of scaling down the hydropower plants in
California, Helms PP, which is a pumped hydro storage
plant in the field, is converted from hydro to pumped
storage.
• Fifty-seven DPV generators (aggregated) are added in
major load centers across the system.
• Three utility-scale PV plants are added in Lugo, Vincent,
and Mira Loma. This decision is made based on the fact
that there has been newly built PV generation near these
stations since 2011 as a result of the Blue Cut fire and
Canyon 2 fire events [10].
In the updated system, the total capacity is 291 GW, and the
total IBR capacity is 59 GW, including utility PV, wind, and
DPV, which comprise 20% of the total capacity. Consider that
the peak demand of WECC is approximately 150 GW [11] and
light spring load is typically 50%–60% of the peak load, i.e., 75–
90 GW, so the highest IBR penetration of this test system can
easily be reach 50% and become IBR-dominated. In theory, the
highest penetration the developed system can simulate is 78%,
i.e., 59 GW/75 GW.
III. THE DYNAMIC MODEL
The dynamic model for the updated 240-bus system is
developed in this section. The updated system has 146
generators with an average capacity of 1,800 MW, meaning that
most generators are an aggregation of smaller generators of the
same fuel type. With this level of aggregation, it is inevitable
that some detailed or high-order dynamic responses will be lost;
however, the dynamic responses at the system level should be
preserved and validated.
To achieve this goal, first, generic dynamic models are
determined based on fuel type. Then, to match the system
frequency response, the inertia of the system is carefully
distributed to match a WECC planning case. Finally, recorded
measurements of real system events are used to validate the
performance of the developed dynamic model.
All the dynamic models are chosen from the model library
of Siemens PSS/E version 34.4 [12], and the simulations are
performed on the same platform.
A. Choices of Dynamic Models
For each synchronous generator, a generator model, a
turbine-governor model, and an excitation system model are
modeled. Because of the aggregated nature of the generators,
TABLE I. GENERATION RESOURCE MIX (CAPACITY) BY STATE
State
Biomass
(MW)
Coal
(MW)
Geo-
thermal
(MW)
Gas
(MW)
Hydro
(MW)
Nuclear
(MW)
Pumped
Storage
(MW)
Utility
PV (MW)
Wind
(MW)
DPV
(MW)
State
Total
(MW)
Arizona 6245 16271 3527 4210 2419 1245 33917
California 1008 2788 44039 10061 2323 3746 15452 5690 7736 92843
Colorado 4948 7829 672 509 738 3106 349 18151
Idaho 122 1272 2541 395 973 5303
Montana 2488 476 2671 720 6355
Nevada 809 751 8380 243 2423 152 284 13042
New Mexico 2817 3750 638 1682 139 9026
Oregon 642 4366 4524 427 3213 13172
Utah 4894 3239 275 1407 229 10044
Washington 711 1460 4162 25066 1200 3075 35674
Wyoming 7254 418 303 1489 9464
Alberta 13039 9636 108 4410 541 27734
B. C. 2650 10747 13397
Mexico 699 2140 2839
Grand Total 1841 44596 4238 10826 60588 7733 4255 28309 21032 9982 290961
6. 3
This report is available at no cost from the National Renewable Energy Laboratory (NREL) at www.nrel.gov/publications.
lower order dynamic models that are popular among researchers
and open-source software are chosen.
The GENROU model, which is a round rotor generator
model with quadratic saturation, is used for all synchronous
generators. Default parameters from PSS/E [12] are used except
for H, the inertia time constants. The inertia constants have
significant impacts on the system frequency response, which is
a key concern in the IBR-dominant system. Therefore, this
parameter is carefully chosen as detailed in Subsection III-B.
The SEXS model, which is a simplified excitation system, is
used for all synchronous generators with the default parameters.
Voltage response is not the focus of the integrated scheduling
and dynamic simulations, and therefore a simplified model is
chosen.
According to Table I, gas and hydro (including pumped
storage hydro) generators comprise more than 50% of the
capacity, and the rest of the synchronous generators (biomass,
coal geothermal, and nuclear) can be classified as steam
turbines. Therefore, to differentiate the frequency responses
from these three types of generators, three turbine-governor
models—GASTDU, HYGOVDU, and TGOV1DU—are used
to represent gas, hydro, and other fuel type generators.
Parameters of the governor models, such as droop settings and
time constants, are important to system response and are tuned
in Subsection III-C.
For nonsynchronous generators, state-of-the-art, second-
generation generic renewable models are used [13], i.e.,
REGCA, REECB, and REPCA models. Such models include
frequency response capabilities and are suitable for integrated
scheduling and dynamic simulations. Note that advanced control
capabilities are not enabled in the validating simulations because
these IBRs are not currently providing such services.
B. System Inertia
For the reduced WECC system to have realistic inertial
frequency response, the inertia constants of the generator models
are carefully chosen so that the total kinetic energy of the
reduced system matches that of a detailed WECC planning case.
The 2015 high summer WECC planning case [14] is chosen for
this purpose because the online capacity is close to the reduced
WECC model. The net kinetic energy of the hydro and non-
hydro generators of each area in the WECC planning case is
mapped to that of the 240-bus test case. The contribution of the
kinetic energy from hydro and non-hydro generation is
summarized using the pie charts shown in Fig. 1 and Fig. 2.
Here, the objective is to find the inertia constants of the
synchronous power plants in the 240-bus WECC system.
Kinetic energy (𝐾𝐾) is the product of inertia constant (𝐻𝐻) and the
installed capacity of a power plant (𝑆𝑆)[15]. Therefore, knowing
the kinetic energy contributions from the hydro and the non-
hydro generation in each area and the installed capacity of the
generation in each area of the 240-bus system, the inertia
constants of the hydro and non-hydro power plants of each area
can be computed accordingly.
To observe the differences between the computed inertia
constants and the average inertia constants of the synchronous
units of the WECC planning case, we present a comparison
using the bar charts in Fig. 3 and Fig. 4. In the two figures, “R.
M. Area” and “So. Cal.” refer to the Rocky Mountain region and
Southern California, respectively.
After the inertia of the 240-bus system is mapped, the inertial
response (first 2 to 3 seconds after the disturbance) of the
reduced system matches the actual system’s response.
C. Fine Tunings of Governor Models
The governor models are fine-tuned to preserve the system-
level frequency response, especially the settling frequency and
frequency nadir. Recorded measurements of system events in
Fig. 1. Kinetic energy contribution from hydropower plants.
Fig. 2. Kinetic energy contribution from non-hydropower plants.
Fig. 3. Comparison of inertia constants in 240-bus system and WECC
planning case for hydropower generation.
Fig. 4. Comparison of inertia constants in 240-bus system and WECC
planning case for non-hydropower generation.
7. 4
This report is available at no cost from the National Renewable Energy Laboratory (NREL) at www.nrel.gov/publications.
WECC as shown in Table II are benchmarked. To match the
recorded system response, the following parameters are tuned:
• Governor deadband: the deadband of ± 0.036 Hz is
implemented on all governor models per [16].
• Droop settings: 5% droop is set for HYGOVDU, and 6%
droop is set for both TGOV1DU and GASTDU, which
are typical values in the field.
• Baseload generators: even though all synchronous
generators are equipped with governors, a percentage of
the generators, especially nuclear generators, are
baseload and will not respond to frequency events.
• Time constants: time constants of the governor models
are fine-tuned. Particularly, T1 and T2 of GASTDU, Tg
and TW of HYGOVDU, and T3 of TGOV1DU are tuned.
The tuning process can be summarized with the following
four steps:
Step 1: The governor deadband and droop settings are first
set to the typical values.
Step 2: The non-baseload capacity is tuned to match the key
frequencies, i.e., frequency nadir and settling frequency. The
non-baseload capacities of each fuel type are changed
proportionally in a 10% step size to match the settling frequency.
The 40% non-baseload capacity setting yields the best match in
terms of the summed deviations from the two key frequencies.
Step 3: The composition of the non-baseload capacity is
changed to refine the frequency response. A 40% non-baseload
capacity yields a good match on the settling frequency but a
higher frequency nadir. To maintain the settling frequency and
reduce the frequency nadir, the non-baseload capacity of slower
hydro generators is increased and that of the faster steam
generators is decreased by a similar amount. Because the
capacity of each generator is large and fixed, the non-baseload
capacity of each fuel type can be changed only in discrete steps,
and different combinations must be explored to ensure that the
changed capacity of both fuel types are close enough. After
tuning, 69% of hydro capacity together with 16% of steam
capacity yields the best results.
Step 4: Finally, the time constants of the governor models
are tuned to match the times when the frequency nadir and
settling frequency are recorded.
IV. VALIDATION OF THE DYNAMIC MODEL
In this section, the frequency response of the reduced model
is validated against three recorded events in WECC. Moreover,
the N-S oscillation mode of the reduced system is analyzed and
validated.
A. Validation Against Frequency Events
To ensure the accuracy of the dynamic model, the dynamic
frequency response of the reduced WECC model is compared
with the FNET/GridEye frequency measurement data [17], [18].
Three different generation trip events that occurred in 2015 are
picked up for the validation. The time, location, and estimated
trip amount are shown in Table II. The frequency response from
six Frequency Disturbance Recorder (FDR) locations are
recorded, and six buses in the reduced model are compared with
the FDR locations, as detailed in Table III. The locations of the
events (lightning) and observations (circles) are plotted on a map
in Fig. 5.
Under all three events, the simulation closely matches the
measurement. Because of space constraints, only the
comparison of Event A is depicted in Figure 6, which shows that
the simulation (red curves) matches the measurement (blue
curves) for all six locations. Specifically, the three key metrics
to measure frequency response—inertial response (i.e., the rate
of change of frequency), frequency nadir, and settling
frequency—are compared. The reduced system can preserve the
system-level frequency response, which is crucial for the
integrated scheduling and dynamic simulations to address the
challenge of the reduced inertia and governor response.
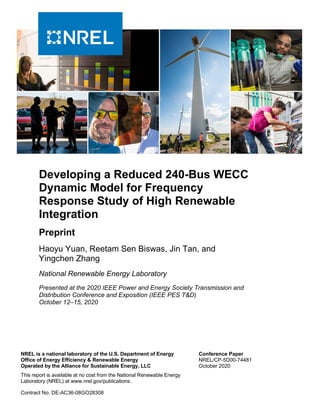
B. Valiation of the N-S Mode
Inter-area oscillation modes in WECC need to be monitored
and mitigated during planning and operation [19]. Siemens PSS
SINCAL is used to perform an eigenvalue analysis of the
reduced model. The well-known N-S mode in WECC is
observed in the reduced system (N-S mode A and B merge to
one mode because of the lack of Alberta-to-U.S. connection
[19]). The mode frequency is at 0.365 Hz, and a 9.646%
damping ratio is calculated. The mode shape is illustrated in Fig.
7, which shows that the generators in the north, e.g., Canada and
Washington, are oscillating against the generators in the south,
TABLE II. EVENTS AND ESTIMATED AMOUNT
Event Date
Time
(UTC)
Estimated
Generation
Trip (MW)
Estimated
Location
lat long
A 03/03/2015 22:24:50 783.5 47.9119 -114.550
B 04/05/2015 19:57:52 805.0 34.8553 -115.209
C 04/26/2015 17:53:23 605.0 48.7557 -119.861
TABLE III. FDR LOCATION AND BUS NO. IN 240-BUS SYSTEM
No. FDR No. Observation Point Bus No.
1 732 Sacramento, CA 8005
2 768 San Diego, CA 2201
3 757 Walkerville, MT 6202
4 996 Portland, OR 4101
5 766 Layton, UT 6503
6 779 Maple Falls, WA 4201
Fig. 5. Geographic distribution of events and obervation locations.
8. 5
This report is available at no cost from the National Renewable Energy Laboratory (NREL) at www.nrel.gov/publications.
e.g., California. Based on the frequency and mode shape, it is
validated that this mode represents the N-S mode [19].
Meanwhile, E-W mode and local oscillation modes around
1 Hz are calculated and have low damping ratios. Less damping
oscillations can also be observed in the time-domain simulation
shown in Fig. 6, which is expected because of the lack of
stabilizer models. It is ongoing work to add stabilizers and to
keep improving the small-signal stability of the system.
V. CONCLUSION
This work developed a reduced WECC model for integrated
scheduling and dynamic simulation. This model updated the
generation resource mix according to the 2018 state of WECC
and therefore can simulate realistic IBR-dominated grid
conditions with up to 78% penetration. Moreover, a dynamic
model that preserves the system-level frequency response and
the dominant N-S oscillation mode was developed, which is a
first of its kind. This reduced WECC model will benefit both
academia and industry audiences to address the challenges of
integrating high penetrations of RES. Future work on the
reduced WECC model will include developing power system
stabilizer models, generating realistic time-series renewable and
load data, and developing advanced inverter controls to enable
grid services.
ACKNOWLEDGMENT
The authors gratefully acknowledge Dr. Yilu Liu from UTK
for providing FNET data, Dr. Erik Ela from the Electric Power
Research Institute, and Dr. Marcos Netto from NREL for their
valuable discussion and help.
This work was authored by the National Renewable Energy
Laboratory, operated by Alliance for Sustainable Energy, LLC,
for the U.S. Department of Energy (DOE) under Contract No.
DE-AC36-08GO28308. Funding provided by U.S. Department
of Energy Office of Energy Efficiency and Renewable Energy
Solar Energy Technologies Office. The views expressed in the
article do not necessarily represent the views of the DOE or the
U.S. Government. The U.S. Government retains and the
publisher, by accepting the article for publication, acknowledges
that the U.S. Government retains a nonexclusive, paid-up,
irrevocable, worldwide license to publish or reproduce the
published form of this work, or allow others to do so, for U.S.
Government purposes.
REFERENCES
[1] S. Hanley, “California Solar Sets Record, But That’s Not The Big News,”
Clean Tehnica, 24-Mar-2019. .
[2] M. Goggin, “Xcel Colorado sets U.S. record with over 60% wind,” Into
the Wind the AWEA blog, 01-Nov-2013. .
[3] “Electric Grid Test Cases,” Electric Grid Test Case Repository. [Online].
Available: https://electricgrids.engr.tamu.edu/electric-grid-test-cases/.
[4] J. Jung, Chen-Ching Liu, S. L. Tanimoto, and V. Vittal, “Adaptation in
load shedding under vulnerable operating conditions,” IEEE Trans.
Power Syst., vol. 17, no. 4, pp. 1199–1205, Nov. 2002.
[5] J. E. Price and J. Goodin, “Reduced network modeling of WECC as a
market design prototype,” IEEE Power Energy Soc. Gen. Meet., pp. 1–6,
2011.
[6] “U.S. Wind Industry Third Quarter 2018 Market Report,” American
Wind Energy Association, Oct. 2018.
[7] “Solar Energy Industries Association (SEIA) for third quarter 2018.”
[Online]. Available: https://www.seia.org/states-map.
[8] “Small scale PV estimate, 2018 Form EIA-861M detailed data,” U.S.
Energy Information Administration.
[9] “Form EIA-860.” U.S. Energy Information Administration.
[10] “900 MW Fault Induced Solar Photovoltaic Resource Interruption
Disturbance Report,” NERC, 2017.
[11] “WECC State of the Interconnection,” 2018. [Online]. Available:
https://www.wecc.org/epubs/StateOfTheInterconnection.
[12] “PSSE 34.4 Model Library.” Siemens PTI, Apr-2018.
[13] P. Pourbeik et al., “Generic Dynamic Models for Modeling Wind Power
Plants and Other Renewable Technologies in Large-Scale Power System
Studies,” IEEE Trans. Energy Convers., vol. 32, no. 3, pp. 1108–1116,
Sep. 2017.
[14] “WECC System Stability Planning Base Cases.” [Online]. Available:
https://www.wecc.org/SystemStabilityPlanning/Pages/BaseCases.aspx.
[15] A. Mullane, G. Bryans, and M. O’Malley, “Kinetic energy and frequency
response comparison for renewable generation systems,” in 2005
International Conference on Future Power Systems, 2005, pp. 1–6.
[16] “Industry Advisory, Generator Governor Frequency Response.” North
American Electric Reliability Corp., 05-Feb-2015.
[17] Y. Zhang et al., “Wide-area frequency monitoring network (FNET)
architecture and applications,” IEEE Trans. Smart Grid, vol. 1, no. 2, pp.
159–167, 2010.
[18] J. Tan, Y. Zhang, S. Veda, T. Elgindy, and Y. Liu, “Developing High PV
Penetration Cases for Frequency Response Study of U.S. Western
Interconnection,” in 2017 Ninth Annual IEEE Green Technologies
Conference (GreenTech), 2017, pp. 304–311.
[19] “Modes of Inter-Area Power Oscillations in the Western
Interconnection,” WECC Joint Synchronized Information Subcommittee,
Jan. 2013.
Fig. 6. Comparison of simulation and measurement for Event A.
Fig. 7. Mode shape of N-S mode.