SlideShare une entreprise Scribd logo
India - Macro-economic Summary : 1999-00 to 2013-14 (on 1st December, 2013)
Indicators

India's Real GDP Growth Rates
(Factor Cost)
Agriculture growth (%)

81999-2K 2000-01 2001-02 2002-03 2003-04 2004-05 2005-06 2006-07 2007-08 2008-09

2009-10 2010-11

2011-12
(QE)

2012-13
(RE)

2013-14
(Proj.)

7.59

4.30

5.52

3.99

8.06

6.97

9.48

9.57

9.32

6.72

8.59

9.32

6.21

4.96

4.60

2.67

-0.01
6.03
5.37

6.01
2.61
6.88

-6.60
7.21
6.97

9.05
7.32
8.06

0.18
9.81
8.13

5.14
9.72
10.91

4.16
12.17
10.06

5.80
9.67
10.27

0.09
4.44
9.98

0.81
9.16
10.50

7.94
9.16
9.75

3.65
3.49
8.20

1.91
2.10
7.10

4.80
1.50
6.30

3.0
3.4
0.9
0.0

5.3
6.0
2.3
7.4

2.3
2.9
-0.4
6.8

5.4
5.9
2.6
13.6

2.3
2.1
3.4
20.7

8.6
8.5
8.9
16.2

7.9
8.7
3.8
13.8

9.3
9.2
9.6
16.2

7.6
7.1
10.4
3.5

8.2
7.1
13.9
7.7

8.1
8.6
5.9
14.0

8.1
8.0
8.6
4.4

3.9
4.0
3.9
1.7

4.9
4.5
7.0
2.5

78.5
23.8
23.2
16.8
17.3
18.4

78.9
22.3
22.9
14.1
15.3
14.6

77.2
24.6
25.7
14.7
23.7
16.1

75.0
26.9
29.1
16.8
15.3
17.5

70.1
32.82
32.41
14.0
30.9
13.0

69.2
34.65
33.44
15.9
37.0
24.0

68.0
35.66
34.60
20.0
28.1
23.8

67.2
38.11
36.82
22.1
22.3
22.4

68.6
34.30
32.02
20.5
17.5
19.9

69.1
36.30
33.69
19.2
16.9
17.0

67.2
36.84
34.02
16.0
21.5
16.0

68.0
35.40
30.81
15.8
17.0
13.5

68.7
35.60
30.20
13.4
14.1
14.3

69.1
36.00
30.50
17.0
15.0
13.5

-5.2
-4.5
-9.0
3.3
3.4
37.5
9.5
55.4
16.5
-17.8
13.7
-4.1

-5.4
-4.0
-9.1
7.1
3.7
45.5
21.1
57.9
4.6
-12.5
9.8
-2.7

-6.0
-4.1
-9.5
3.6
4.3
44.7
-1.6
56.3
-2.8
-11.6
15.0
3.4

-5.7
-3.9
-9.1
3.4
4.1
53.8
20.3
64.5
14.5
-10.7
17.0
6.3

-4.3
-4.2
-8.1
5.5
3.8
66.3
23.3
80.0
24.1
-13.7
27.8
14.1

-3.88
-3.32
-7.2
6.5
3.9
85.2
28.5
118.9
48.6
-33.7
31.2
-2.5

-4.00
-2.50
-6.5
3.7
4.2
105.2
23.4
157.1
32.1
-51.9
42.0
-9.9

-3.30
-2.10
-5.40
6.5
6.8
128.9
22.6
190.7
21.4
-61.8
52.2
-9.6

-2.50
-1.40
-4.01
4.8
6.2
166.2
28.9
257.6
35.1
-91.5
75.7
-15.7

-6.00
-2.30
-8.30
8.0
9.1
189.0
13.7
308.5
19.8
-119.5
91.6
-27.9

-6.50
-2.91
-9.41
3.6
12.3
182.4
-3.5
300.6
-2.6
-118.2
80.0
-38.2

-4.80
-3.20
-8.00
9.6
10.5
256.2
40.4
383.5
27.6
-127.3
79.3
-48.1

-5.70
-2.32
-8.10
8.8
8.4
309.8
20.9
499.5
30.3
-189.8
111.6
-78.2

-4.90
-2.10
-7.00
7.4
10.2
306.6
-1.0
502.2
0.5
-195.7
107.5
-88.2

-5.00
-1.90
-6.90
6.0
9.2
323.4
5.5
489.7
-2.5
-166.2
115.9
-50.4

% to GDP

-0.9

-0.6

0.7

1.2

2.3

-0.3

-1.2

-1.0

-1.3

-2.3

-2.8

-2.8

-4.2

-4.8

-2.7

Capital Account (US$bn)
% GDP
External Debt (US$bn)
Short Term Debt

9.5
2.0
35.1
98.3
3.9

8.8
1.9
39.6
101.3
3.6

8.6
1.7
51.0
98.8
2.7

10.8
2.1
71.9
104.9
4.7

16.7
2.7
106.1
112.7
4.4

28.0
3.9
135.1
134.0
17.7

25.5
3.1
145.1
139.1
19.5

45.2
4.8
191.9
172.4
28.1

106.6
8.6
299.1
224.4
45.7

6.8
0.6
241.6
224.5
43.3

51.6
3.8
252.8
260.9
52.3

63.7
3.7
273.7
305.9
65.0

67.8
3.6
260.9
345.4
78.2

89.3
4.8
264.7
392.1
96.7

63.6
3.5
277.9
388.5
96.8

Exchange Rate US$/Rs. -avg.

45.9

45.7

48.3

45.9

45.0

45.0

44.3

45.2

40.2

46.0

47.4

45.6

48.1

54.0

61.1

Industry growth (%)
5.96
Services growth (%)
11.19
By Demand (%YoY)
Consumption
7.2
Private Consumption
6.1
Public Consumption
13.2
Gross Fixed Capital Formation
11.2
Consumption; Investments, Savings (%GDP)
Consumption
79.4
Capital Formation
25.3
Gross Domestic Savings
24.2
Money Supply
14.6
Bank Credit growth
18.2
Deposit growth
13.9
Fiscal Indicators (% GDP)
Centre's Fiscal Deficit
State Fiscal Deficit
Combined Deficit (Centre+State)
Inflation - WPI (Average)
CPI (Average)
Exports (US$bn)
% YoY
Imports (US$bn)
%YoY
Trade deficit (US$bn)
Invisibles (US$bn)
Current Account Deficit (US$bn)

Forex Assets (exc. gold)(US$bn)

Source: CSO, RBI, EAC to PM, Ministry of Finance; 1st December, 2013

Databook for DCH; 18th December 2013

Page 1 of 333

Contenu connexe

Similaire à India macro economy summary dec 2013

Kerala economy structural comp
Kerala economy structural compKerala economy structural comp
Kerala economy structural compSubhashvpv Vp
 
E2 a02 unit_i_sectoral development in india
E2 a02 unit_i_sectoral development in indiaE2 a02 unit_i_sectoral development in india
E2 a02 unit_i_sectoral development in india4512452
 
Materi seminar binus university idx
Materi seminar binus university idxMateri seminar binus university idx
Materi seminar binus university idxZola Azaria
 
Financial Analysis of ZF Steering India Ltd.
Financial Analysis of ZF Steering India Ltd.Financial Analysis of ZF Steering India Ltd.
Financial Analysis of ZF Steering India Ltd.Ronak Sani
 
Smgr corp presentation march 2014 gy
Smgr corp presentation march 2014 gySmgr corp presentation march 2014 gy
Smgr corp presentation march 2014 gySemen Indonesia
 
This is my scorecard, what I infer from my simplified worksheet (...)
This is my scorecard, what I infer from my simplified worksheet (...)This is my scorecard, what I infer from my simplified worksheet (...)
This is my scorecard, what I infer from my simplified worksheet (...)Giuseppe Piazzolla
 
Key+tyre+industry+figures+2012
Key+tyre+industry+figures+2012Key+tyre+industry+figures+2012
Key+tyre+industry+figures+2012Vladimir Kolev
 
Prerequisites to Innovation-driven Economy by Faisal Basri
Prerequisites to Innovation-driven Economy by Faisal BasriPrerequisites to Innovation-driven Economy by Faisal Basri
Prerequisites to Innovation-driven Economy by Faisal Basrippibelanda
 
Fundamental analysis.pptx
Fundamental analysis.pptxFundamental analysis.pptx
Fundamental analysis.pptxvinayakhalemani
 
FAISAL BASRI: Subsidi BBM Sudah Bewujud Kanker Ganas
FAISAL BASRI: Subsidi BBM Sudah Bewujud Kanker GanasFAISAL BASRI: Subsidi BBM Sudah Bewujud Kanker Ganas
FAISAL BASRI: Subsidi BBM Sudah Bewujud Kanker GanasRuslan Chandra
 
Gold Imports data of India from January 2013 to January 2014
Gold Imports data of India from January 2013 to January 2014Gold Imports data of India from January 2013 to January 2014
Gold Imports data of India from January 2013 to January 2014Jhunjhunwalas
 
Indicator wise performance report (oct 2007 sep 2012) ssfp-october 2012
Indicator wise performance report (oct 2007 sep 2012) ssfp-october 2012Indicator wise performance report (oct 2007 sep 2012) ssfp-october 2012
Indicator wise performance report (oct 2007 sep 2012) ssfp-october 2012Md.Afzal Hossain
 
Evolução dos valores programados - meio tv - Governo Federal
Evolução dos valores programados - meio tv -  Governo FederalEvolução dos valores programados - meio tv -  Governo Federal
Evolução dos valores programados - meio tv - Governo FederalIvson Alves
 
한국석유공사 우리나라 석유가격의 발자취
한국석유공사 우리나라 석유가격의 발자취한국석유공사 우리나라 석유가격의 발자취
한국석유공사 우리나라 석유가격의 발자취Penguin
 
Indonesia automotive market in brief
Indonesia automotive market in briefIndonesia automotive market in brief
Indonesia automotive market in briefIda Bagus Dharmayana
 
Destinations 20 year calendar performance
Destinations 20 year calendar performanceDestinations 20 year calendar performance
Destinations 20 year calendar performanceDon McNeill, ChFC
 
Dpm on indian economy falling rupee and common man (26.8.13)
Dpm on indian economy   falling rupee and common man (26.8.13)Dpm on indian economy   falling rupee and common man (26.8.13)
Dpm on indian economy falling rupee and common man (26.8.13)Divyang Majmudar
 

Similaire à India macro economy summary dec 2013 (20)

Kerala economy structural comp
Kerala economy structural compKerala economy structural comp
Kerala economy structural comp
 
E2 a02 unit_i_sectoral development in india
E2 a02 unit_i_sectoral development in indiaE2 a02 unit_i_sectoral development in india
E2 a02 unit_i_sectoral development in india
 
Materi seminar binus university idx
Materi seminar binus university idxMateri seminar binus university idx
Materi seminar binus university idx
 
Financial Analysis of ZF Steering India Ltd.
Financial Analysis of ZF Steering India Ltd.Financial Analysis of ZF Steering India Ltd.
Financial Analysis of ZF Steering India Ltd.
 
Smgr corp presentation march 2014 gy
Smgr corp presentation march 2014 gySmgr corp presentation march 2014 gy
Smgr corp presentation march 2014 gy
 
This is my scorecard, what I infer from my simplified worksheet (...)
This is my scorecard, what I infer from my simplified worksheet (...)This is my scorecard, what I infer from my simplified worksheet (...)
This is my scorecard, what I infer from my simplified worksheet (...)
 
Key+tyre+industry+figures+2012
Key+tyre+industry+figures+2012Key+tyre+industry+figures+2012
Key+tyre+industry+figures+2012
 
Prerequisites to Innovation-driven Economy by Faisal Basri
Prerequisites to Innovation-driven Economy by Faisal BasriPrerequisites to Innovation-driven Economy by Faisal Basri
Prerequisites to Innovation-driven Economy by Faisal Basri
 
Fundamental analysis.pptx
Fundamental analysis.pptxFundamental analysis.pptx
Fundamental analysis.pptx
 
Stock recommendations
Stock recommendationsStock recommendations
Stock recommendations
 
NAM's 2nd Quarter Manufacturing Update
NAM's 2nd Quarter Manufacturing UpdateNAM's 2nd Quarter Manufacturing Update
NAM's 2nd Quarter Manufacturing Update
 
FAISAL BASRI: Subsidi BBM Sudah Bewujud Kanker Ganas
FAISAL BASRI: Subsidi BBM Sudah Bewujud Kanker GanasFAISAL BASRI: Subsidi BBM Sudah Bewujud Kanker Ganas
FAISAL BASRI: Subsidi BBM Sudah Bewujud Kanker Ganas
 
Gold Imports data of India from January 2013 to January 2014
Gold Imports data of India from January 2013 to January 2014Gold Imports data of India from January 2013 to January 2014
Gold Imports data of India from January 2013 to January 2014
 
Indicator wise performance report (oct 2007 sep 2012) ssfp-october 2012
Indicator wise performance report (oct 2007 sep 2012) ssfp-october 2012Indicator wise performance report (oct 2007 sep 2012) ssfp-october 2012
Indicator wise performance report (oct 2007 sep 2012) ssfp-october 2012
 
Evolução dos valores programados - meio tv - Governo Federal
Evolução dos valores programados - meio tv -  Governo FederalEvolução dos valores programados - meio tv -  Governo Federal
Evolução dos valores programados - meio tv - Governo Federal
 
한국석유공사 우리나라 석유가격의 발자취
한국석유공사 우리나라 석유가격의 발자취한국석유공사 우리나라 석유가격의 발자취
한국석유공사 우리나라 석유가격의 발자취
 
Nps list
Nps listNps list
Nps list
 
Indonesia automotive market in brief
Indonesia automotive market in briefIndonesia automotive market in brief
Indonesia automotive market in brief
 
Destinations 20 year calendar performance
Destinations 20 year calendar performanceDestinations 20 year calendar performance
Destinations 20 year calendar performance
 
Dpm on indian economy falling rupee and common man (26.8.13)
Dpm on indian economy   falling rupee and common man (26.8.13)Dpm on indian economy   falling rupee and common man (26.8.13)
Dpm on indian economy falling rupee and common man (26.8.13)
 

Dernier

Essential Maintenance Tips For Commercial Vans.
Essential Maintenance Tips For Commercial Vans.Essential Maintenance Tips For Commercial Vans.
Essential Maintenance Tips For Commercial Vans.commercialvansolutions
 
一比一原版SDSU毕业证圣地亚哥州立大学毕业证成绩单如何办理
一比一原版SDSU毕业证圣地亚哥州立大学毕业证成绩单如何办理一比一原版SDSU毕业证圣地亚哥州立大学毕业证成绩单如何办理
一比一原版SDSU毕业证圣地亚哥州立大学毕业证成绩单如何办理psavhef
 
gtyccccccccccccccccccccccccccccccccccccccccccccccccccccccc
gtycccccccccccccccccccccccccccccccccccccccccccccccccccccccgtyccccccccccccccccccccccccccccccccccccccccccccccccccccccc
gtyccccccccccccccccccccccccccccccccccccccccccccccccccccccc4thzenzstar
 
What Should You Do If Your Jaguar XF Bluetooth Isn't Working
What Should You Do If Your Jaguar XF Bluetooth Isn't WorkingWhat Should You Do If Your Jaguar XF Bluetooth Isn't Working
What Should You Do If Your Jaguar XF Bluetooth Isn't WorkingAuto Assets
 
Advanced Technology for Auto Part Industry Inventory Solutions
Advanced Technology for Auto Part Industry Inventory SolutionsAdvanced Technology for Auto Part Industry Inventory Solutions
Advanced Technology for Auto Part Industry Inventory Solutionscontactcaysonandres
 
The Future of Autonomous Vehicles | civilthings.com | Detailed information
The Future of Autonomous Vehicles | civilthings.com |  Detailed informationThe Future of Autonomous Vehicles | civilthings.com |  Detailed information
The Future of Autonomous Vehicles | civilthings.com | Detailed informationgettygaming1
 
Car Seat Covers and Seat Protection Guide
Car Seat Covers and Seat Protection GuideCar Seat Covers and Seat Protection Guide
Car Seat Covers and Seat Protection GuideAskXX.com
 
Core technology of Hyundai Motor Group's EV platform 'E-GMP'
Core technology of Hyundai Motor Group's EV platform 'E-GMP'Core technology of Hyundai Motor Group's EV platform 'E-GMP'
Core technology of Hyundai Motor Group's EV platform 'E-GMP'Hyundai Motor Group
 

Dernier (8)

Essential Maintenance Tips For Commercial Vans.
Essential Maintenance Tips For Commercial Vans.Essential Maintenance Tips For Commercial Vans.
Essential Maintenance Tips For Commercial Vans.
 
一比一原版SDSU毕业证圣地亚哥州立大学毕业证成绩单如何办理
一比一原版SDSU毕业证圣地亚哥州立大学毕业证成绩单如何办理一比一原版SDSU毕业证圣地亚哥州立大学毕业证成绩单如何办理
一比一原版SDSU毕业证圣地亚哥州立大学毕业证成绩单如何办理
 
gtyccccccccccccccccccccccccccccccccccccccccccccccccccccccc
gtycccccccccccccccccccccccccccccccccccccccccccccccccccccccgtyccccccccccccccccccccccccccccccccccccccccccccccccccccccc
gtyccccccccccccccccccccccccccccccccccccccccccccccccccccccc
 
What Should You Do If Your Jaguar XF Bluetooth Isn't Working
What Should You Do If Your Jaguar XF Bluetooth Isn't WorkingWhat Should You Do If Your Jaguar XF Bluetooth Isn't Working
What Should You Do If Your Jaguar XF Bluetooth Isn't Working
 
Advanced Technology for Auto Part Industry Inventory Solutions
Advanced Technology for Auto Part Industry Inventory SolutionsAdvanced Technology for Auto Part Industry Inventory Solutions
Advanced Technology for Auto Part Industry Inventory Solutions
 
The Future of Autonomous Vehicles | civilthings.com | Detailed information
The Future of Autonomous Vehicles | civilthings.com |  Detailed informationThe Future of Autonomous Vehicles | civilthings.com |  Detailed information
The Future of Autonomous Vehicles | civilthings.com | Detailed information
 
Car Seat Covers and Seat Protection Guide
Car Seat Covers and Seat Protection GuideCar Seat Covers and Seat Protection Guide
Car Seat Covers and Seat Protection Guide
 
Core technology of Hyundai Motor Group's EV platform 'E-GMP'
Core technology of Hyundai Motor Group's EV platform 'E-GMP'Core technology of Hyundai Motor Group's EV platform 'E-GMP'
Core technology of Hyundai Motor Group's EV platform 'E-GMP'
 

India macro economy summary dec 2013

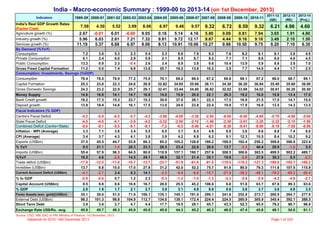
  • 1. India - Macro-economic Summary : 1999-00 to 2013-14 (on 1st December, 2013) Indicators India's Real GDP Growth Rates (Factor Cost) Agriculture growth (%) 81999-2K 2000-01 2001-02 2002-03 2003-04 2004-05 2005-06 2006-07 2007-08 2008-09 2009-10 2010-11 2011-12 (QE) 2012-13 (RE) 2013-14 (Proj.) 7.59 4.30 5.52 3.99 8.06 6.97 9.48 9.57 9.32 6.72 8.59 9.32 6.21 4.96 4.60 2.67 -0.01 6.03 5.37 6.01 2.61 6.88 -6.60 7.21 6.97 9.05 7.32 8.06 0.18 9.81 8.13 5.14 9.72 10.91 4.16 12.17 10.06 5.80 9.67 10.27 0.09 4.44 9.98 0.81 9.16 10.50 7.94 9.16 9.75 3.65 3.49 8.20 1.91 2.10 7.10 4.80 1.50 6.30 3.0 3.4 0.9 0.0 5.3 6.0 2.3 7.4 2.3 2.9 -0.4 6.8 5.4 5.9 2.6 13.6 2.3 2.1 3.4 20.7 8.6 8.5 8.9 16.2 7.9 8.7 3.8 13.8 9.3 9.2 9.6 16.2 7.6 7.1 10.4 3.5 8.2 7.1 13.9 7.7 8.1 8.6 5.9 14.0 8.1 8.0 8.6 4.4 3.9 4.0 3.9 1.7 4.9 4.5 7.0 2.5 78.5 23.8 23.2 16.8 17.3 18.4 78.9 22.3 22.9 14.1 15.3 14.6 77.2 24.6 25.7 14.7 23.7 16.1 75.0 26.9 29.1 16.8 15.3 17.5 70.1 32.82 32.41 14.0 30.9 13.0 69.2 34.65 33.44 15.9 37.0 24.0 68.0 35.66 34.60 20.0 28.1 23.8 67.2 38.11 36.82 22.1 22.3 22.4 68.6 34.30 32.02 20.5 17.5 19.9 69.1 36.30 33.69 19.2 16.9 17.0 67.2 36.84 34.02 16.0 21.5 16.0 68.0 35.40 30.81 15.8 17.0 13.5 68.7 35.60 30.20 13.4 14.1 14.3 69.1 36.00 30.50 17.0 15.0 13.5 -5.2 -4.5 -9.0 3.3 3.4 37.5 9.5 55.4 16.5 -17.8 13.7 -4.1 -5.4 -4.0 -9.1 7.1 3.7 45.5 21.1 57.9 4.6 -12.5 9.8 -2.7 -6.0 -4.1 -9.5 3.6 4.3 44.7 -1.6 56.3 -2.8 -11.6 15.0 3.4 -5.7 -3.9 -9.1 3.4 4.1 53.8 20.3 64.5 14.5 -10.7 17.0 6.3 -4.3 -4.2 -8.1 5.5 3.8 66.3 23.3 80.0 24.1 -13.7 27.8 14.1 -3.88 -3.32 -7.2 6.5 3.9 85.2 28.5 118.9 48.6 -33.7 31.2 -2.5 -4.00 -2.50 -6.5 3.7 4.2 105.2 23.4 157.1 32.1 -51.9 42.0 -9.9 -3.30 -2.10 -5.40 6.5 6.8 128.9 22.6 190.7 21.4 -61.8 52.2 -9.6 -2.50 -1.40 -4.01 4.8 6.2 166.2 28.9 257.6 35.1 -91.5 75.7 -15.7 -6.00 -2.30 -8.30 8.0 9.1 189.0 13.7 308.5 19.8 -119.5 91.6 -27.9 -6.50 -2.91 -9.41 3.6 12.3 182.4 -3.5 300.6 -2.6 -118.2 80.0 -38.2 -4.80 -3.20 -8.00 9.6 10.5 256.2 40.4 383.5 27.6 -127.3 79.3 -48.1 -5.70 -2.32 -8.10 8.8 8.4 309.8 20.9 499.5 30.3 -189.8 111.6 -78.2 -4.90 -2.10 -7.00 7.4 10.2 306.6 -1.0 502.2 0.5 -195.7 107.5 -88.2 -5.00 -1.90 -6.90 6.0 9.2 323.4 5.5 489.7 -2.5 -166.2 115.9 -50.4 % to GDP -0.9 -0.6 0.7 1.2 2.3 -0.3 -1.2 -1.0 -1.3 -2.3 -2.8 -2.8 -4.2 -4.8 -2.7 Capital Account (US$bn) % GDP External Debt (US$bn) Short Term Debt 9.5 2.0 35.1 98.3 3.9 8.8 1.9 39.6 101.3 3.6 8.6 1.7 51.0 98.8 2.7 10.8 2.1 71.9 104.9 4.7 16.7 2.7 106.1 112.7 4.4 28.0 3.9 135.1 134.0 17.7 25.5 3.1 145.1 139.1 19.5 45.2 4.8 191.9 172.4 28.1 106.6 8.6 299.1 224.4 45.7 6.8 0.6 241.6 224.5 43.3 51.6 3.8 252.8 260.9 52.3 63.7 3.7 273.7 305.9 65.0 67.8 3.6 260.9 345.4 78.2 89.3 4.8 264.7 392.1 96.7 63.6 3.5 277.9 388.5 96.8 Exchange Rate US$/Rs. -avg. 45.9 45.7 48.3 45.9 45.0 45.0 44.3 45.2 40.2 46.0 47.4 45.6 48.1 54.0 61.1 Industry growth (%) 5.96 Services growth (%) 11.19 By Demand (%YoY) Consumption 7.2 Private Consumption 6.1 Public Consumption 13.2 Gross Fixed Capital Formation 11.2 Consumption; Investments, Savings (%GDP) Consumption 79.4 Capital Formation 25.3 Gross Domestic Savings 24.2 Money Supply 14.6 Bank Credit growth 18.2 Deposit growth 13.9 Fiscal Indicators (% GDP) Centre's Fiscal Deficit State Fiscal Deficit Combined Deficit (Centre+State) Inflation - WPI (Average) CPI (Average) Exports (US$bn) % YoY Imports (US$bn) %YoY Trade deficit (US$bn) Invisibles (US$bn) Current Account Deficit (US$bn) Forex Assets (exc. gold)(US$bn) Source: CSO, RBI, EAC to PM, Ministry of Finance; 1st December, 2013 Databook for DCH; 18th December 2013 Page 1 of 333