SlideShare une entreprise Scribd logo
1  sur  4
Télécharger pour lire hors ligne
If you are looking for an edge in
an increasingly competitive Telco
environment, TEKLABZ Network
Engineer® Reporting Engine is a
proven differentiator. Now
network information can be
easily presented and seamlessly
shared across the organization
using the data exploration,
reporting and monitoring
dashboard developed by
TEKLABZ.
Give your business decision
makers timely access to
personalized,
easy-to-understand Network
Information, simply and
affordably. TEKLABZ Reporting
Engine is a Network Intelligence
Solution that enables deeper
insights to Network Information
and positions your organization
Network Inventory System with
a greater competitive advantage.
With robust reports creation
framework, Network Engineer®
integration, and monitoring
dashboard functionality,
TEKLABZ NE Reporting Engine
helps business users; at all
levels; make more informed
decisions.
Reporting Engine
Overview
TEKLABZ Reporting Engine helps
your people to be more effective
in querying Network Data and
seamlessly share valuable
information.
Make fact-based decisions
throughout your organization by
relying on our Network
Intelligence Solution.
Easily access relevant
information whenever and
wherever you need it to better
understand your business, act
quickly and confidently and
ultimately achieve remarkable
results.
Why TEKLABZ Reporting
Engine
Greater ability to access and
analyze Network Data for
end-users within Network
Engineer without the need for
GIS/NE administrator
involvement.
Faster and more collaborative
decision making.
Defined and standard output
style formats for all generated
reports.
Flexible Reporting APIs to
allow developers completely
control reports creation to fit
their needs.
Improved performance metric
tracking.
More accountability, with
visibility into key performance
indicators by line of business.
Enable informed and rapid
decisions based on reliable
and real-time business data.
Provide intuitive, self-service
access to business
information.
Maximize visibility into the
performance of your Network
Plan and Design operations.
Simply deployable into your
existing Network Engineer
environment.
User Experience
The user experience in
accessing the reporting engine
conforms to Network Engineer
user experience in all means.
The Administrator can access
the configuration options of
the reporting engine through
the Network Engineer Toolbox.
All configurations options are
guided steps to reach your
final goal of creating reports to
be used by end users.
End users can access reports
from within ArcMap/NE
application. A reporting menu
will be added to the menu bar
where users can access
allowable reports. Once a
report is selected the user will
be guided through a wizard to
enter the input selection in
which user will have to fill in
required fields.
All values entered will be
validated to ensure
correctness of information.
Users will then choose the
output file type and location in
which the report will be saved.
Explore, manage and share critical Telco Network
Information – With the most user friendly Network Data
Analytics to be built on Ericsson Network Engineer®.
Network Engineer
Reporting Engine
Network Engineer
Reporting Engine
Network Engineer
Reporting Engine
Using a simple guided contractual process to create a standard
report template, you can get the Network Information you need
from across all your data sources. Developers can follow a number
of contracts using TEKLABZ open Reporting APIs to create standard
report templates (blueprints) which can be used to create multiple
reports with different configuration options.
Answer new and evolving
business questions with
self-service ad-hoc reporting and
spatial analysis queries on the
web and the desktop.
Uncover deep business
insights using simple guided
steps.
Share business insights with
end-users and peers in a
fixed or interactive web
format.
Run multidimensional
analytics on one common
Network Intelligence Report
Builder.
Combine data from different
sources to get answers to
your business questions.
Improve user adoption while
optimizing your return on
your IT investment.
Reports Suite
Combine a number of related
reports that can be generated at
once into one formatted report
document. Report Suites provide
convenience for end users to
generate multiple reports at
once. Create a report suite to
ease your documentation efforts
in delivering proper analysis of
your Telco Network.
www.teklabz.com info@teklabz.com sales@teklabz.com
Reports Creation Framework
A framework for performing analysis of multidimensional data sources in
an intuitive environment to quickly answer complex business questions.
A user-friendly easy-to-use Report Builder provided to create custom
query based reports using a combination of SQL filters and/or spatial
filters for Reporting Engine Administrators. The Report Builder is mostly
suited for creating arbitrary quantitative reports from the data available
within the Network Engineer® database with the benefit of applying
spatial filters based on data available within the GIS environment.
Data Visualizing and
Layout
Produce reports that are clear
and customizable – for
business insight that is easy to
understand and act on. Data
can be presented through
tables or graphs, giving the
users excellent visualization
capabilities. The report’s
layouts can be configured to
use the organization’s template
format which can be presented
on a word document and/or
excel workbook ready to be
printed and shared within the
organization.
Improve report usability
with guided interactivity.
Ensure data input is
perfectly translated with
charts, graphs and simple
diagrams.
Embed reports easily into
business operations and
processes.
Deliver enterprise formatted
reports to global users.
Monitoring Dashboard
Delivers personalized business
dashboard and easy add-ons
gadget with Web Monitoring
Dashboard. Enable streaming
real-time data for better
decision making. Create
personalized dashboards from
many reports to monitor
Network KPI. Transform
complex Network Data into
interactive dashboards gadgets
to answer questions and make
informed decisions. Present
content of multiple reports for
a powerful interactive
visualization of your data into a
single view.
Get instant access to clear, understandable metrics, so you can see
your key performance indicators at glance and know what's driving
your Network Performance.
Enable streaming real-time data for better decision making.
Create reports from many data sources and publish them in user
friendly outputs.
Monitor Network Inventory KPIs.
Transform complex Network Data into Interactive Dashboards
Gadgets.
Answer Questions and make Informed Decisions.
Security Options and Roles
Reports created using the TEKLABZ Reporting Engine are secure on
multiple levels that conform to NE® security options and roles. You
can secure your reports and dashboards at the user and group
levels. Each report or report suite will be added to the security
membership in which each membership privileges can be granted
per user or group.
www.teklabz.com info@teklabz.com sales@teklabz.com
A number of highly engineered
built-in report templates with
flexible configuration options can
deliver proper information and
analysis of your Network to help
you stream line your daily
activities.
Represent Splice Closure
connectivity information
through tabular and diagrams.
List all your work order items
using network inventory model
grouping and lengths sums in
the Bill of Quantity.
Increase you distribution frame
utilization through DF
Utilization report.
Control your Network Cabinet
expansions using the Cabinet
Utilization report.
Ensure your civil infrastructure
serves all parcels within the
fiber distribution boundary.
Make sure your FTTx network
is serving the maximum
number of customers and
allow marketing deep analysis
on who should they target.
www.teklabz.com info@teklabz.com sales@teklabz.com
Measure the network design
and plan progress through WO
KPIs.
Maximum utilization of your
equipment housing structures
through analyzing the Rack
Spaces.
Select best routes for the
network expansion by
analyzing duct spaces.
Built-In Reports Templates

Contenu connexe

Tendances

LeanIX introduction_pathfinder_v2
LeanIX introduction_pathfinder_v2LeanIX introduction_pathfinder_v2
LeanIX introduction_pathfinder_v2LeanIX GmbH
 
Introduction to Event Driven Architecture
Introduction to Event Driven ArchitectureIntroduction to Event Driven Architecture
Introduction to Event Driven ArchitectureCitiusTech
 
Metadata Matters! What it is and How to Manage it
Metadata Matters! What it is and How to Manage itMetadata Matters! What it is and How to Manage it
Metadata Matters! What it is and How to Manage itSafe Software
 
Understanding the Anametrix Cloud-based Analytics Platform
Understanding the Anametrix Cloud-based Analytics PlatformUnderstanding the Anametrix Cloud-based Analytics Platform
Understanding the Anametrix Cloud-based Analytics PlatformAnametrix
 
Designer-integrated Work Management for Utilities
Designer-integrated Work Management for UtilitiesDesigner-integrated Work Management for Utilities
Designer-integrated Work Management for UtilitiesSSP Innovations
 
App Modernization - What you need to know before planning a migration to Offi...
App Modernization - What you need to know before planning a migration to Offi...App Modernization - What you need to know before planning a migration to Offi...
App Modernization - What you need to know before planning a migration to Offi...Oliver Wirkus
 
A Framework for Infrastructure Visibility, Analytics & Operational Intelligence
A Framework for Infrastructure Visibility, Analytics & Operational IntelligenceA Framework for Infrastructure Visibility, Analytics & Operational Intelligence
A Framework for Infrastructure Visibility, Analytics & Operational IntelligenceStephen Collins
 
Embedded Analytics and Big Data Visualization Inside Any App
Embedded Analytics and Big Data Visualization Inside Any AppEmbedded Analytics and Big Data Visualization Inside Any App
Embedded Analytics and Big Data Visualization Inside Any AppMia Yuan Cao
 
Power Big Data Analytics with Informatica Cloud Integration for Redshift, Kin...
Power Big Data Analytics with Informatica Cloud Integration for Redshift, Kin...Power Big Data Analytics with Informatica Cloud Integration for Redshift, Kin...
Power Big Data Analytics with Informatica Cloud Integration for Redshift, Kin...Amazon Web Services
 
Webinar: Digital Transformation With Integration Platform as a Service (iPaaS)
Webinar: Digital Transformation With Integration Platform as a Service (iPaaS)Webinar: Digital Transformation With Integration Platform as a Service (iPaaS)
Webinar: Digital Transformation With Integration Platform as a Service (iPaaS)APPSeCONNECT
 
Progea Cloud - Databoom eng
Progea Cloud - Databoom engProgea Cloud - Databoom eng
Progea Cloud - Databoom engSimona Giosa
 
Esri GIS at Thames Water
Esri GIS at Thames WaterEsri GIS at Thames Water
Esri GIS at Thames WaterEsri UK
 
Sharepoint 2013-applied architecture from the field v3 (public)
Sharepoint 2013-applied architecture from the field v3 (public)Sharepoint 2013-applied architecture from the field v3 (public)
Sharepoint 2013-applied architecture from the field v3 (public)Tihomir Ignatov
 
Reactive Worksheets presentation @ Silicon Roundabout - London FinTech Week
Reactive Worksheets presentation @ Silicon Roundabout - London FinTech WeekReactive Worksheets presentation @ Silicon Roundabout - London FinTech Week
Reactive Worksheets presentation @ Silicon Roundabout - London FinTech WeekFalconSoft Ltd
 
Instant Data Discovery with Dashboards and Visual Analytics
Instant Data Discovery with Dashboards and Visual AnalyticsInstant Data Discovery with Dashboards and Visual Analytics
Instant Data Discovery with Dashboards and Visual AnalyticsMia Yuan Cao
 
High performance data center computing using manageable distributed computing
High performance data center computing using manageable distributed computingHigh performance data center computing using manageable distributed computing
High performance data center computing using manageable distributed computingJuniper Networks
 
ILINX Capture Connect Share Part One
ILINX Capture Connect Share Part OneILINX Capture Connect Share Part One
ILINX Capture Connect Share Part OneShadrach White
 

Tendances (20)

LeanIX introduction_pathfinder_v2
LeanIX introduction_pathfinder_v2LeanIX introduction_pathfinder_v2
LeanIX introduction_pathfinder_v2
 
Introduction to Event Driven Architecture
Introduction to Event Driven ArchitectureIntroduction to Event Driven Architecture
Introduction to Event Driven Architecture
 
Metadata Matters! What it is and How to Manage it
Metadata Matters! What it is and How to Manage itMetadata Matters! What it is and How to Manage it
Metadata Matters! What it is and How to Manage it
 
Understanding the Anametrix Cloud-based Analytics Platform
Understanding the Anametrix Cloud-based Analytics PlatformUnderstanding the Anametrix Cloud-based Analytics Platform
Understanding the Anametrix Cloud-based Analytics Platform
 
Designer-integrated Work Management for Utilities
Designer-integrated Work Management for UtilitiesDesigner-integrated Work Management for Utilities
Designer-integrated Work Management for Utilities
 
App Modernization - What you need to know before planning a migration to Offi...
App Modernization - What you need to know before planning a migration to Offi...App Modernization - What you need to know before planning a migration to Offi...
App Modernization - What you need to know before planning a migration to Offi...
 
A Framework for Infrastructure Visibility, Analytics & Operational Intelligence
A Framework for Infrastructure Visibility, Analytics & Operational IntelligenceA Framework for Infrastructure Visibility, Analytics & Operational Intelligence
A Framework for Infrastructure Visibility, Analytics & Operational Intelligence
 
Embedded Analytics and Big Data Visualization Inside Any App
Embedded Analytics and Big Data Visualization Inside Any AppEmbedded Analytics and Big Data Visualization Inside Any App
Embedded Analytics and Big Data Visualization Inside Any App
 
Power Big Data Analytics with Informatica Cloud Integration for Redshift, Kin...
Power Big Data Analytics with Informatica Cloud Integration for Redshift, Kin...Power Big Data Analytics with Informatica Cloud Integration for Redshift, Kin...
Power Big Data Analytics with Informatica Cloud Integration for Redshift, Kin...
 
Webinar: Digital Transformation With Integration Platform as a Service (iPaaS)
Webinar: Digital Transformation With Integration Platform as a Service (iPaaS)Webinar: Digital Transformation With Integration Platform as a Service (iPaaS)
Webinar: Digital Transformation With Integration Platform as a Service (iPaaS)
 
Progea Cloud - Databoom eng
Progea Cloud - Databoom engProgea Cloud - Databoom eng
Progea Cloud - Databoom eng
 
Batch Expert+ Boosts Lab Productivity
Batch Expert+ Boosts Lab ProductivityBatch Expert+ Boosts Lab Productivity
Batch Expert+ Boosts Lab Productivity
 
Esri GIS at Thames Water
Esri GIS at Thames WaterEsri GIS at Thames Water
Esri GIS at Thames Water
 
Sharepoint 2013-applied architecture from the field v3 (public)
Sharepoint 2013-applied architecture from the field v3 (public)Sharepoint 2013-applied architecture from the field v3 (public)
Sharepoint 2013-applied architecture from the field v3 (public)
 
Reactive Worksheets presentation @ Silicon Roundabout - London FinTech Week
Reactive Worksheets presentation @ Silicon Roundabout - London FinTech WeekReactive Worksheets presentation @ Silicon Roundabout - London FinTech Week
Reactive Worksheets presentation @ Silicon Roundabout - London FinTech Week
 
Instant Data Discovery with Dashboards and Visual Analytics
Instant Data Discovery with Dashboards and Visual AnalyticsInstant Data Discovery with Dashboards and Visual Analytics
Instant Data Discovery with Dashboards and Visual Analytics
 
High performance data center computing using manageable distributed computing
High performance data center computing using manageable distributed computingHigh performance data center computing using manageable distributed computing
High performance data center computing using manageable distributed computing
 
Netkit
NetkitNetkit
Netkit
 
HR microservices
HR microservicesHR microservices
HR microservices
 
ILINX Capture Connect Share Part One
ILINX Capture Connect Share Part OneILINX Capture Connect Share Part One
ILINX Capture Connect Share Part One
 

Similaire à Teklabz NE Reporting Engine Brochure

Time and attendance software
Time and attendance softwareTime and attendance software
Time and attendance softwarepftecsoft
 
Business Intelligence for users - Sharperlight
Business Intelligence for users - SharperlightBusiness Intelligence for users - Sharperlight
Business Intelligence for users - SharperlightMichell8240
 
Deliver Dynamic and Interactive Web Content in J2EE Applications
Deliver Dynamic and Interactive Web Content in J2EE ApplicationsDeliver Dynamic and Interactive Web Content in J2EE Applications
Deliver Dynamic and Interactive Web Content in J2EE Applicationsinfopapers
 
NLS Banking Solutions - NQuest BI
NLS Banking Solutions - NQuest BINLS Banking Solutions - NQuest BI
NLS Banking Solutions - NQuest BIkarthik nagarajan
 
FineReport 10.0 Product Brochure-Transform Data into Power!
FineReport 10.0 Product Brochure-Transform Data into Power!FineReport 10.0 Product Brochure-Transform Data into Power!
FineReport 10.0 Product Brochure-Transform Data into Power!FineReport Reporting Software
 
Contigo en trader introduction
Contigo en trader introductionContigo en trader introduction
Contigo en trader introductiondcalmonson
 
Confluent Partner Tech Talk with Reply
Confluent Partner Tech Talk with ReplyConfluent Partner Tech Talk with Reply
Confluent Partner Tech Talk with Replyconfluent
 
Cxair Tech Overview V5
Cxair Tech Overview V5Cxair Tech Overview V5
Cxair Tech Overview V5keesgelderblom
 
IRJET- Data Analytics & Visualization using Qlik
IRJET- Data Analytics & Visualization using QlikIRJET- Data Analytics & Visualization using Qlik
IRJET- Data Analytics & Visualization using QlikIRJET Journal
 
Agile Methodology Approach to SSRS Reporting
Agile Methodology Approach to SSRS ReportingAgile Methodology Approach to SSRS Reporting
Agile Methodology Approach to SSRS ReportingDanielson Samuel
 
Prodev Solutions Intro
Prodev Solutions IntroProdev Solutions Intro
Prodev Solutions IntrolarryATprodev
 
德國 combit List & label 21 報表設計工具軟體新功能介紹
德國 combit List & label 21 報表設計工具軟體新功能介紹德國 combit List & label 21 報表設計工具軟體新功能介紹
德國 combit List & label 21 報表設計工具軟體新功能介紹Cheer Chain Enterprise Co., Ltd.
 
TEMS™ Discovery – Post-process and analyze large network testing data sets | ...
TEMS™ Discovery – Post-process and analyze large network testing data sets | ...TEMS™ Discovery – Post-process and analyze large network testing data sets | ...
TEMS™ Discovery – Post-process and analyze large network testing data sets | ...Infovista
 
NetDialog Value Add Monitoring Software on top of BlueCoat PacketShaper
NetDialog Value Add Monitoring Software on top of BlueCoat PacketShaperNetDialog Value Add Monitoring Software on top of BlueCoat PacketShaper
NetDialog Value Add Monitoring Software on top of BlueCoat PacketShaperNetDialog
 
Netserv Technology Services
Netserv Technology ServicesNetserv Technology Services
Netserv Technology Servicessthicks14
 
Logitech - LOGITECH ACCELERATES CLOUD ANALYTICS USING DATA VIRTUALIZATION
Logitech - LOGITECH ACCELERATES CLOUD ANALYTICS USING DATA VIRTUALIZATIONLogitech - LOGITECH ACCELERATES CLOUD ANALYTICS USING DATA VIRTUALIZATION
Logitech - LOGITECH ACCELERATES CLOUD ANALYTICS USING DATA VIRTUALIZATIONAvinash Deshpande
 

Similaire à Teklabz NE Reporting Engine Brochure (20)

RUGGEDCOM REFLEX software
RUGGEDCOM REFLEX softwareRUGGEDCOM REFLEX software
RUGGEDCOM REFLEX software
 
Time and attendance software
Time and attendance softwareTime and attendance software
Time and attendance software
 
Business Intelligence for users - Sharperlight
Business Intelligence for users - SharperlightBusiness Intelligence for users - Sharperlight
Business Intelligence for users - Sharperlight
 
Deliver Dynamic and Interactive Web Content in J2EE Applications
Deliver Dynamic and Interactive Web Content in J2EE ApplicationsDeliver Dynamic and Interactive Web Content in J2EE Applications
Deliver Dynamic and Interactive Web Content in J2EE Applications
 
NLS Banking Solutions - NQuest BI
NLS Banking Solutions - NQuest BINLS Banking Solutions - NQuest BI
NLS Banking Solutions - NQuest BI
 
FineReport 10.0 Product Brochure-Transform Data into Power!
FineReport 10.0 Product Brochure-Transform Data into Power!FineReport 10.0 Product Brochure-Transform Data into Power!
FineReport 10.0 Product Brochure-Transform Data into Power!
 
Contigo en trader introduction
Contigo en trader introductionContigo en trader introduction
Contigo en trader introduction
 
Confluent Partner Tech Talk with Reply
Confluent Partner Tech Talk with ReplyConfluent Partner Tech Talk with Reply
Confluent Partner Tech Talk with Reply
 
Cxair Tech Overview V5
Cxair Tech Overview V5Cxair Tech Overview V5
Cxair Tech Overview V5
 
Cxair technical overview
Cxair technical overviewCxair technical overview
Cxair technical overview
 
Info sphere overview
Info sphere overviewInfo sphere overview
Info sphere overview
 
IRJET- Data Analytics & Visualization using Qlik
IRJET- Data Analytics & Visualization using QlikIRJET- Data Analytics & Visualization using Qlik
IRJET- Data Analytics & Visualization using Qlik
 
Agile Methodology Approach to SSRS Reporting
Agile Methodology Approach to SSRS ReportingAgile Methodology Approach to SSRS Reporting
Agile Methodology Approach to SSRS Reporting
 
Prodev Solutions Intro
Prodev Solutions IntroProdev Solutions Intro
Prodev Solutions Intro
 
德國 combit List & label 21 報表設計工具軟體新功能介紹
德國 combit List & label 21 報表設計工具軟體新功能介紹德國 combit List & label 21 報表設計工具軟體新功能介紹
德國 combit List & label 21 報表設計工具軟體新功能介紹
 
TEMS™ Discovery – Post-process and analyze large network testing data sets | ...
TEMS™ Discovery – Post-process and analyze large network testing data sets | ...TEMS™ Discovery – Post-process and analyze large network testing data sets | ...
TEMS™ Discovery – Post-process and analyze large network testing data sets | ...
 
NetDialog Value Add Monitoring Software on top of BlueCoat PacketShaper
NetDialog Value Add Monitoring Software on top of BlueCoat PacketShaperNetDialog Value Add Monitoring Software on top of BlueCoat PacketShaper
NetDialog Value Add Monitoring Software on top of BlueCoat PacketShaper
 
Netserv Technology Services
Netserv Technology ServicesNetserv Technology Services
Netserv Technology Services
 
Logitech - LOGITECH ACCELERATES CLOUD ANALYTICS USING DATA VIRTUALIZATION
Logitech - LOGITECH ACCELERATES CLOUD ANALYTICS USING DATA VIRTUALIZATIONLogitech - LOGITECH ACCELERATES CLOUD ANALYTICS USING DATA VIRTUALIZATION
Logitech - LOGITECH ACCELERATES CLOUD ANALYTICS USING DATA VIRTUALIZATION
 
icv
icvicv
icv
 

Dernier

Exploring Multimodal Embeddings with Milvus
Exploring Multimodal Embeddings with MilvusExploring Multimodal Embeddings with Milvus
Exploring Multimodal Embeddings with MilvusZilliz
 
Apidays New York 2024 - APIs in 2030: The Risk of Technological Sleepwalk by ...
Apidays New York 2024 - APIs in 2030: The Risk of Technological Sleepwalk by ...Apidays New York 2024 - APIs in 2030: The Risk of Technological Sleepwalk by ...
Apidays New York 2024 - APIs in 2030: The Risk of Technological Sleepwalk by ...apidays
 
Cloud Frontiers: A Deep Dive into Serverless Spatial Data and FME
Cloud Frontiers:  A Deep Dive into Serverless Spatial Data and FMECloud Frontiers:  A Deep Dive into Serverless Spatial Data and FME
Cloud Frontiers: A Deep Dive into Serverless Spatial Data and FMESafe Software
 
Modular Monolith - a Practical Alternative to Microservices @ Devoxx UK 2024
Modular Monolith - a Practical Alternative to Microservices @ Devoxx UK 2024Modular Monolith - a Practical Alternative to Microservices @ Devoxx UK 2024
Modular Monolith - a Practical Alternative to Microservices @ Devoxx UK 2024Victor Rentea
 
presentation ICT roal in 21st century education
presentation ICT roal in 21st century educationpresentation ICT roal in 21st century education
presentation ICT roal in 21st century educationjfdjdjcjdnsjd
 
WSO2's API Vision: Unifying Control, Empowering Developers
WSO2's API Vision: Unifying Control, Empowering DevelopersWSO2's API Vision: Unifying Control, Empowering Developers
WSO2's API Vision: Unifying Control, Empowering DevelopersWSO2
 
Connector Corner: Accelerate revenue generation using UiPath API-centric busi...
Connector Corner: Accelerate revenue generation using UiPath API-centric busi...Connector Corner: Accelerate revenue generation using UiPath API-centric busi...
Connector Corner: Accelerate revenue generation using UiPath API-centric busi...DianaGray10
 
EMPOWERMENT TECHNOLOGY GRADE 11 QUARTER 2 REVIEWER
EMPOWERMENT TECHNOLOGY GRADE 11 QUARTER 2 REVIEWEREMPOWERMENT TECHNOLOGY GRADE 11 QUARTER 2 REVIEWER
EMPOWERMENT TECHNOLOGY GRADE 11 QUARTER 2 REVIEWERMadyBayot
 
Introduction to Multilingual Retrieval Augmented Generation (RAG)
Introduction to Multilingual Retrieval Augmented Generation (RAG)Introduction to Multilingual Retrieval Augmented Generation (RAG)
Introduction to Multilingual Retrieval Augmented Generation (RAG)Zilliz
 
Mcleodganj Call Girls 🥰 8617370543 Service Offer VIP Hot Model
Mcleodganj Call Girls 🥰 8617370543 Service Offer VIP Hot ModelMcleodganj Call Girls 🥰 8617370543 Service Offer VIP Hot Model
Mcleodganj Call Girls 🥰 8617370543 Service Offer VIP Hot ModelDeepika Singh
 
Corporate and higher education May webinar.pptx
Corporate and higher education May webinar.pptxCorporate and higher education May webinar.pptx
Corporate and higher education May webinar.pptxRustici Software
 
Navigating the Deluge_ Dubai Floods and the Resilience of Dubai International...
Navigating the Deluge_ Dubai Floods and the Resilience of Dubai International...Navigating the Deluge_ Dubai Floods and the Resilience of Dubai International...
Navigating the Deluge_ Dubai Floods and the Resilience of Dubai International...Orbitshub
 
Apidays New York 2024 - Passkeys: Developing APIs to enable passwordless auth...
Apidays New York 2024 - Passkeys: Developing APIs to enable passwordless auth...Apidays New York 2024 - Passkeys: Developing APIs to enable passwordless auth...
Apidays New York 2024 - Passkeys: Developing APIs to enable passwordless auth...apidays
 
ICT role in 21st century education and its challenges
ICT role in 21st century education and its challengesICT role in 21st century education and its challenges
ICT role in 21st century education and its challengesrafiqahmad00786416
 
Architecting Cloud Native Applications
Architecting Cloud Native ApplicationsArchitecting Cloud Native Applications
Architecting Cloud Native ApplicationsWSO2
 
Boost Fertility New Invention Ups Success Rates.pdf
Boost Fertility New Invention Ups Success Rates.pdfBoost Fertility New Invention Ups Success Rates.pdf
Boost Fertility New Invention Ups Success Rates.pdfsudhanshuwaghmare1
 
Platformless Horizons for Digital Adaptability
Platformless Horizons for Digital AdaptabilityPlatformless Horizons for Digital Adaptability
Platformless Horizons for Digital AdaptabilityWSO2
 
Repurposing LNG terminals for Hydrogen Ammonia: Feasibility and Cost Saving
Repurposing LNG terminals for Hydrogen Ammonia: Feasibility and Cost SavingRepurposing LNG terminals for Hydrogen Ammonia: Feasibility and Cost Saving
Repurposing LNG terminals for Hydrogen Ammonia: Feasibility and Cost SavingEdi Saputra
 
MS Copilot expands with MS Graph connectors
MS Copilot expands with MS Graph connectorsMS Copilot expands with MS Graph connectors
MS Copilot expands with MS Graph connectorsNanddeep Nachan
 
Web Form Automation for Bonterra Impact Management (fka Social Solutions Apri...
Web Form Automation for Bonterra Impact Management (fka Social Solutions Apri...Web Form Automation for Bonterra Impact Management (fka Social Solutions Apri...
Web Form Automation for Bonterra Impact Management (fka Social Solutions Apri...Jeffrey Haguewood
 

Dernier (20)

Exploring Multimodal Embeddings with Milvus
Exploring Multimodal Embeddings with MilvusExploring Multimodal Embeddings with Milvus
Exploring Multimodal Embeddings with Milvus
 
Apidays New York 2024 - APIs in 2030: The Risk of Technological Sleepwalk by ...
Apidays New York 2024 - APIs in 2030: The Risk of Technological Sleepwalk by ...Apidays New York 2024 - APIs in 2030: The Risk of Technological Sleepwalk by ...
Apidays New York 2024 - APIs in 2030: The Risk of Technological Sleepwalk by ...
 
Cloud Frontiers: A Deep Dive into Serverless Spatial Data and FME
Cloud Frontiers:  A Deep Dive into Serverless Spatial Data and FMECloud Frontiers:  A Deep Dive into Serverless Spatial Data and FME
Cloud Frontiers: A Deep Dive into Serverless Spatial Data and FME
 
Modular Monolith - a Practical Alternative to Microservices @ Devoxx UK 2024
Modular Monolith - a Practical Alternative to Microservices @ Devoxx UK 2024Modular Monolith - a Practical Alternative to Microservices @ Devoxx UK 2024
Modular Monolith - a Practical Alternative to Microservices @ Devoxx UK 2024
 
presentation ICT roal in 21st century education
presentation ICT roal in 21st century educationpresentation ICT roal in 21st century education
presentation ICT roal in 21st century education
 
WSO2's API Vision: Unifying Control, Empowering Developers
WSO2's API Vision: Unifying Control, Empowering DevelopersWSO2's API Vision: Unifying Control, Empowering Developers
WSO2's API Vision: Unifying Control, Empowering Developers
 
Connector Corner: Accelerate revenue generation using UiPath API-centric busi...
Connector Corner: Accelerate revenue generation using UiPath API-centric busi...Connector Corner: Accelerate revenue generation using UiPath API-centric busi...
Connector Corner: Accelerate revenue generation using UiPath API-centric busi...
 
EMPOWERMENT TECHNOLOGY GRADE 11 QUARTER 2 REVIEWER
EMPOWERMENT TECHNOLOGY GRADE 11 QUARTER 2 REVIEWEREMPOWERMENT TECHNOLOGY GRADE 11 QUARTER 2 REVIEWER
EMPOWERMENT TECHNOLOGY GRADE 11 QUARTER 2 REVIEWER
 
Introduction to Multilingual Retrieval Augmented Generation (RAG)
Introduction to Multilingual Retrieval Augmented Generation (RAG)Introduction to Multilingual Retrieval Augmented Generation (RAG)
Introduction to Multilingual Retrieval Augmented Generation (RAG)
 
Mcleodganj Call Girls 🥰 8617370543 Service Offer VIP Hot Model
Mcleodganj Call Girls 🥰 8617370543 Service Offer VIP Hot ModelMcleodganj Call Girls 🥰 8617370543 Service Offer VIP Hot Model
Mcleodganj Call Girls 🥰 8617370543 Service Offer VIP Hot Model
 
Corporate and higher education May webinar.pptx
Corporate and higher education May webinar.pptxCorporate and higher education May webinar.pptx
Corporate and higher education May webinar.pptx
 
Navigating the Deluge_ Dubai Floods and the Resilience of Dubai International...
Navigating the Deluge_ Dubai Floods and the Resilience of Dubai International...Navigating the Deluge_ Dubai Floods and the Resilience of Dubai International...
Navigating the Deluge_ Dubai Floods and the Resilience of Dubai International...
 
Apidays New York 2024 - Passkeys: Developing APIs to enable passwordless auth...
Apidays New York 2024 - Passkeys: Developing APIs to enable passwordless auth...Apidays New York 2024 - Passkeys: Developing APIs to enable passwordless auth...
Apidays New York 2024 - Passkeys: Developing APIs to enable passwordless auth...
 
ICT role in 21st century education and its challenges
ICT role in 21st century education and its challengesICT role in 21st century education and its challenges
ICT role in 21st century education and its challenges
 
Architecting Cloud Native Applications
Architecting Cloud Native ApplicationsArchitecting Cloud Native Applications
Architecting Cloud Native Applications
 
Boost Fertility New Invention Ups Success Rates.pdf
Boost Fertility New Invention Ups Success Rates.pdfBoost Fertility New Invention Ups Success Rates.pdf
Boost Fertility New Invention Ups Success Rates.pdf
 
Platformless Horizons for Digital Adaptability
Platformless Horizons for Digital AdaptabilityPlatformless Horizons for Digital Adaptability
Platformless Horizons for Digital Adaptability
 
Repurposing LNG terminals for Hydrogen Ammonia: Feasibility and Cost Saving
Repurposing LNG terminals for Hydrogen Ammonia: Feasibility and Cost SavingRepurposing LNG terminals for Hydrogen Ammonia: Feasibility and Cost Saving
Repurposing LNG terminals for Hydrogen Ammonia: Feasibility and Cost Saving
 
MS Copilot expands with MS Graph connectors
MS Copilot expands with MS Graph connectorsMS Copilot expands with MS Graph connectors
MS Copilot expands with MS Graph connectors
 
Web Form Automation for Bonterra Impact Management (fka Social Solutions Apri...
Web Form Automation for Bonterra Impact Management (fka Social Solutions Apri...Web Form Automation for Bonterra Impact Management (fka Social Solutions Apri...
Web Form Automation for Bonterra Impact Management (fka Social Solutions Apri...
 

Teklabz NE Reporting Engine Brochure

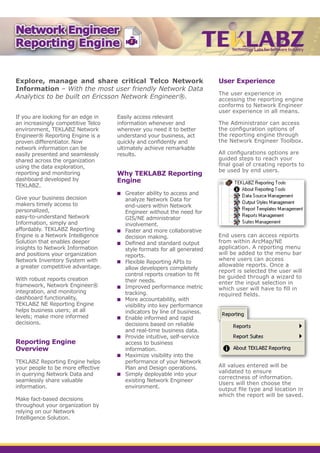
  • 1. If you are looking for an edge in an increasingly competitive Telco environment, TEKLABZ Network Engineer® Reporting Engine is a proven differentiator. Now network information can be easily presented and seamlessly shared across the organization using the data exploration, reporting and monitoring dashboard developed by TEKLABZ. Give your business decision makers timely access to personalized, easy-to-understand Network Information, simply and affordably. TEKLABZ Reporting Engine is a Network Intelligence Solution that enables deeper insights to Network Information and positions your organization Network Inventory System with a greater competitive advantage. With robust reports creation framework, Network Engineer® integration, and monitoring dashboard functionality, TEKLABZ NE Reporting Engine helps business users; at all levels; make more informed decisions. Reporting Engine Overview TEKLABZ Reporting Engine helps your people to be more effective in querying Network Data and seamlessly share valuable information. Make fact-based decisions throughout your organization by relying on our Network Intelligence Solution. Easily access relevant information whenever and wherever you need it to better understand your business, act quickly and confidently and ultimately achieve remarkable results. Why TEKLABZ Reporting Engine Greater ability to access and analyze Network Data for end-users within Network Engineer without the need for GIS/NE administrator involvement. Faster and more collaborative decision making. Defined and standard output style formats for all generated reports. Flexible Reporting APIs to allow developers completely control reports creation to fit their needs. Improved performance metric tracking. More accountability, with visibility into key performance indicators by line of business. Enable informed and rapid decisions based on reliable and real-time business data. Provide intuitive, self-service access to business information. Maximize visibility into the performance of your Network Plan and Design operations. Simply deployable into your existing Network Engineer environment. User Experience The user experience in accessing the reporting engine conforms to Network Engineer user experience in all means. The Administrator can access the configuration options of the reporting engine through the Network Engineer Toolbox. All configurations options are guided steps to reach your final goal of creating reports to be used by end users. End users can access reports from within ArcMap/NE application. A reporting menu will be added to the menu bar where users can access allowable reports. Once a report is selected the user will be guided through a wizard to enter the input selection in which user will have to fill in required fields. All values entered will be validated to ensure correctness of information. Users will then choose the output file type and location in which the report will be saved. Explore, manage and share critical Telco Network Information – With the most user friendly Network Data Analytics to be built on Ericsson Network Engineer®. Network Engineer Reporting Engine Network Engineer Reporting Engine Network Engineer Reporting Engine
  • 2. Using a simple guided contractual process to create a standard report template, you can get the Network Information you need from across all your data sources. Developers can follow a number of contracts using TEKLABZ open Reporting APIs to create standard report templates (blueprints) which can be used to create multiple reports with different configuration options. Answer new and evolving business questions with self-service ad-hoc reporting and spatial analysis queries on the web and the desktop. Uncover deep business insights using simple guided steps. Share business insights with end-users and peers in a fixed or interactive web format. Run multidimensional analytics on one common Network Intelligence Report Builder. Combine data from different sources to get answers to your business questions. Improve user adoption while optimizing your return on your IT investment. Reports Suite Combine a number of related reports that can be generated at once into one formatted report document. Report Suites provide convenience for end users to generate multiple reports at once. Create a report suite to ease your documentation efforts in delivering proper analysis of your Telco Network. www.teklabz.com info@teklabz.com sales@teklabz.com Reports Creation Framework A framework for performing analysis of multidimensional data sources in an intuitive environment to quickly answer complex business questions. A user-friendly easy-to-use Report Builder provided to create custom query based reports using a combination of SQL filters and/or spatial filters for Reporting Engine Administrators. The Report Builder is mostly suited for creating arbitrary quantitative reports from the data available within the Network Engineer® database with the benefit of applying spatial filters based on data available within the GIS environment.
  • 3. Data Visualizing and Layout Produce reports that are clear and customizable – for business insight that is easy to understand and act on. Data can be presented through tables or graphs, giving the users excellent visualization capabilities. The report’s layouts can be configured to use the organization’s template format which can be presented on a word document and/or excel workbook ready to be printed and shared within the organization. Improve report usability with guided interactivity. Ensure data input is perfectly translated with charts, graphs and simple diagrams. Embed reports easily into business operations and processes. Deliver enterprise formatted reports to global users. Monitoring Dashboard Delivers personalized business dashboard and easy add-ons gadget with Web Monitoring Dashboard. Enable streaming real-time data for better decision making. Create personalized dashboards from many reports to monitor Network KPI. Transform complex Network Data into interactive dashboards gadgets to answer questions and make informed decisions. Present content of multiple reports for a powerful interactive visualization of your data into a single view. Get instant access to clear, understandable metrics, so you can see your key performance indicators at glance and know what's driving your Network Performance. Enable streaming real-time data for better decision making. Create reports from many data sources and publish them in user friendly outputs. Monitor Network Inventory KPIs. Transform complex Network Data into Interactive Dashboards Gadgets. Answer Questions and make Informed Decisions. Security Options and Roles Reports created using the TEKLABZ Reporting Engine are secure on multiple levels that conform to NE® security options and roles. You can secure your reports and dashboards at the user and group levels. Each report or report suite will be added to the security membership in which each membership privileges can be granted per user or group. www.teklabz.com info@teklabz.com sales@teklabz.com
  • 4. A number of highly engineered built-in report templates with flexible configuration options can deliver proper information and analysis of your Network to help you stream line your daily activities. Represent Splice Closure connectivity information through tabular and diagrams. List all your work order items using network inventory model grouping and lengths sums in the Bill of Quantity. Increase you distribution frame utilization through DF Utilization report. Control your Network Cabinet expansions using the Cabinet Utilization report. Ensure your civil infrastructure serves all parcels within the fiber distribution boundary. Make sure your FTTx network is serving the maximum number of customers and allow marketing deep analysis on who should they target. www.teklabz.com info@teklabz.com sales@teklabz.com Measure the network design and plan progress through WO KPIs. Maximum utilization of your equipment housing structures through analyzing the Rack Spaces. Select best routes for the network expansion by analyzing duct spaces. Built-In Reports Templates