Russian Escorts in Abu Dhabi 0508644382 Abu Dhabi Escorts
MA2604_Project_2022.pdf
1. Jia Shao (2022) MA2604 Probability and Statistics Project Assessment Page 1
MA2604 Probability and Statistics Project
London Datastore Census - Analysis by Ward
For this project you will analyse specified Excel datasets produced by Borough within London,
and wards within each Borough that are available on the course Brightspace (and also originally
on the London Datastore website, https://data.london.gov.uk/census/ . )
ALLOCATION OF PROJECT TOPICS
Each student has been allocated a subset of London Boroughs and a theme to focus upon.
Please refer to the table below that shows that Boroughs have been divided into six groups, A -
F, and four themes: Child Obesity, House Prices, Household Income, and GCSE Scores. Use the
last two digits of your student number to find your dataset.
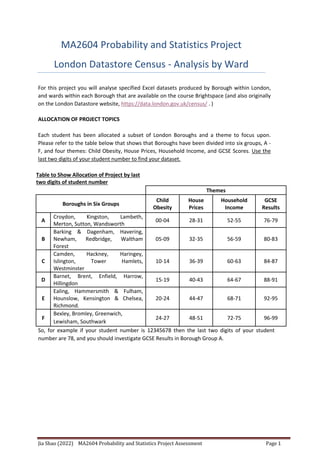
Table to Show Allocation of Project by last
two digits of student number
Themes
Boroughs in Six Groups
Child
Obesity
House
Prices
Household
Income
GCSE
Results
A
Croydon, Kingston, Lambeth,
Merton, Sutton, Wandsworth
00-04 28-31 52-55 76-79
B
Barking & Dagenham, Havering,
Newham, Redbridge, Waltham
Forest
05-09 32-35 56-59 80-83
C
Camden, Hackney, Haringey,
Islington, Tower Hamlets,
Westminster
10-14 36-39 60-63 84-87
D
Barnet, Brent, Enfield, Harrow,
Hillingdon
15-19 40-43 64-67 88-91
E
Ealing, Hammersmith & Fulham,
Hounslow, Kensington & Chelsea,
Richmond.
20-24 44-47 68-71 92-95
F
Bexley, Bromley, Greenwich,
Lewisham, Southwark
24-27 48-51 72-75 96-99
So, for example if your student number is 12345678 then the last two digits of your student
number are 78, and you should investigate GCSE Results in Borough Group A.
2. Jia Shao (2022) MA2604 Probability and Statistics Project Assessment Page 2
DATASETS
For each theme the two large Excel data sets below are available on Brightspace. They can be
downloaded and used for analysis as required. For a background to the content of each dataset
refer to the corresponding links below:
1. London-ward-well-being-probability scores https://data.london.gov.uk/dataset/london-
ward-well-being-scores
2. London-ward-profiles-excel-version https://data.london.gov.uk/dataset/ward-profiles-and-
atlas
The Key Measures by Ward to investigate for each theme are:
Child Obesity - ‘Children with a BMI greater than or equal to the 95th centile of the British
1990 growth reference (UK90) BMI distribution have been classified as obese”
House Prices - ‘Median House Price (£) - 2014’
Household Income - ‘Median Household Income estimate 2012/13’
GCSE Results - ‘Average GCSE point score’.
Each dataset reports the above measures in slightly different formats. You will need to thoroughly
understand your geographical area, and the content of both datasets before you decide your
research question and hypotheses to investigate. Then you can determine the data you need to
retain for your chosen analyses. There is a lot of data you could collect, therefore you should
focus your search and concentrate on selecting only a few indicators.
STATISTICAL ANALYSIS
Your statistical analysis should include both descriptive and inferential statistics. The descriptive
analysis may involve analysing your data and variables with appropriate summary statistics,
tables, and graphs, while your inferential analysis may include hypothesis tests (including one-
sample t-test, two-sample t-test, test of proportions), and simple linear regression analysis. Your
entire analysis should be done using R, although it is often easier to process the data for analysis
first in a spreadsheet, such as Excel, before reading into R, and this is certainly permitted.
There is a possibility that the data you collect may be severely skewed. If you want to apply a
parametric statistical test (for example, a t-test which assumes normality) you will need to apply
a transformation to the data. In such cases, first try applying a log transformation (take the log
of each data point), but if the data is still not close to normal, apply a square root transformation
(take the square root of each data point). Both transformations can be performed in R by
computing a new variable.
SUPPORT AVAILABLE
The R notes used are available at
http://people.brunel.ac.uk/~bbbp006/R/index.html . Other resources for R are linked through
that page (see the Preface).
Please see the course Brightspace page for details of further support.
3. Jia Shao (2022) MA2604 Probability and Statistics Project Assessment Page 3
Your research question:
A research question or statement sets out to investigate the relationship between two or more
variables. It is not predictive; instead, it is phrased as an investigative or exploratory statement or
question such as “What is the relationship between…” or “Is there a difference between…”. Look at the
variables available to you.
You should decide what is interesting to investigate. Is there an issue or problem that you are curious
about?
Variables:
I recommend that you should have no more than 8 variables. Also, you should have at least 1 dependent
variable (DV) and 1 independent variable (IV):
• DV: This variable depends on the value of another variable (it depends on one or more IVs).
• IV: This variable possibly affects a change in the DV(s).
For example, if I study the relationship between age and income, age is the IV because it possibly affects
a change in income but income will never affect a change in a person’s age (I won’t get younger if I make
less or older if I make more). The variable income is the DV because it may depend on age. I would then
do analysis to see if there is a relationship between these variables. For each of the variables that you
have chosen in your model, you might see if it has a significant association with the response.
Hypotheses:
There are three types of hypotheses:
1. Descriptive
2. Difference
3. Associational/relational
DESCRIPTIVE
These hypotheses seek to explore the data by using descriptive statistics to describe and summarise
findings of one or more variables. You do not use inferential statistics (e.g., hypotheses tests) to
investigate these hypotheses.
DIFFERENCE
These hypotheses state that one group of the IV is different from another group of the IV on the DV. For
example, “Males earn more income than females in the same occupation”. Here gender is the IV with
two groups, males and females, and income is the DV.
ASSOCIATIONAL/RELATIONAL
These hypotheses state that one DV is associated or related to an IV in a particular way. For example,
“People who are older tend to have a higher income”. Here, as above, age is the IV and income is the
DV. We are predicting that they have a positive relationship as they both increase together (as age
increases so does income).
4. Jia Shao (2022) MA2604 Probability and Statistics Project Assessment Page 4
What is expected from you
Use the dataset and theme that has been selected for you to pose some research questions.
The grade for this report will consider the methodology, analysis of results, the quality of the written
report and the layout and presentation of the report. The full Learning Outcomes and Marking Criteria
are available in the course Brightspace.
• The report should be a maximum of 8 sides of A4, minimum 11pt font, and submitted in pdf
format.
• A copy of the R code you use should also be submitted.
• The submission will be done via Wiseflow and consist of one pdf file, and one text file containing
R code (normally this will be a file with suffix .Rmd).
• It is recommended you use R Markdown within R Studio to generate the report. (We discussed
this in section 1.2 of the R notes), and submit the markdown file itself. You may use other tools,
as long as one pdf report and one file containing code are submitted.
The report should contain:
1. An introduction to your research: What are you studying? Where did you get the data from? Why is it
interesting to investigate? What are the research questions? (This can include external sources that help
provide relevance and context to your research).
2. Summary of the data in a meaningful way using descriptive statistics (charts, graphs and tables). This
will include investigating hypotheses that are not tested with inferential statistics and can be broader
and include more variables.
3. Hypothesis testing: Apply appropriate inferential statistics covered in R Labs to test some of your
hypotheses. This will be more specific and include only a few variables that you summarised in 2) above.
4. Conclusion: Bring it all together in a meaningful way. Have you been able to answer your research
question? If not, why and what else do you think needs to be done in order to answer it? If so, what are
your final conclusions? Be critical about what you have done and what you have found.
In general, your individual report should follow the order above, but you can mix 2) and 3) if you think it
works better that way. Just make sure your report is cohesive and flows together well.
Remember, this is an individual project, and all work should be your own. For support about
how to avoid plagiarism, the library has a good collection of resources:
https://www.brunel.ac.uk/life/library/SubjectSupport/Plagiarism
SUMMARY OF DELIVERABLES and DEADLINES
On Wiseflow – before 7th
December at 5pm submit pdf version of the report and code used.