1. GHP Investment Advisors, Inc.
INVESTMENT INSIGHT Fourth Quarter 2014
GHP
Global Markets
Personal Wealth
Management
GHP
Global Markets
Personal Wealth
Management
In a Bond Bind
Ron New, Fixed Income Portfolio Manager
Money makes the world go round and borrowed money makes it go faster. The Federal Reserve (the Fed) is all too
aware of this and controls monetary policy by adjusting the rate at which banks lend money to each other, called the
Federal Funds Rate. This one lending rate influences borrowing costs for Uncle Sam and for you. On December 16th,
2008 the Fed lowered this rate to zero and has kept it there ever since. As a result, we have enjoyed low borrowing rates
for credit and mortgages. The trade-off is that if you are a saver, bank CDs and bond yields remain at historic lows. The
Fed now indicates this policy is likely to end in 2015. We are looking forward to when the Fed finally raises interest
rates. Why? Put simply, it means that in the Fed’s estimation the U.S. economy is doing well. Their concern will shift
from boosting economic growth to controlling inflation. Even better, our clients will start earning a more appropriate
return on their hard earned money when investing in the bond market and CDs. However, broad expectations of rising
interest rates do not ensure their occurrence. The Fed has been thwarted in the past when attempting to increase long
term interest rates and similar factors face them again.
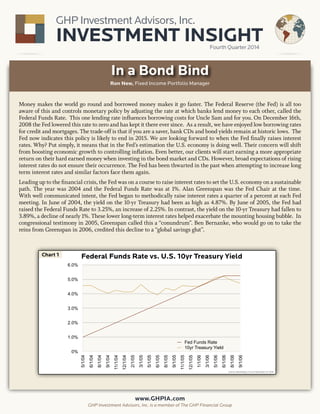
Leading up to the financial crisis, the Fed was on a course to raise interest rates to set the U.S. economy on a sustainable
path. The year was 2004 and the Federal Funds Rate was at 1%. Alan Greenspan was the Fed Chair at the time.
With well communicated intent, the Fed began to methodically raise interest rates a quarter of a percent at each Fed
meeting. In June of 2004, the yield on the 10-yr Treasury had been as high as 4.87%. By June of 2005, the Fed had
raised the Federal Funds Rate to 3.25%, an increase of 2.25%. In contrast, the yield on the 10-yr Treasury had fallen to
3.89%, a decline of nearly 1%. These lower long-term interest rates helped exacerbate the mounting housing bubble. In
congressional testimony in 2005, Greenspan called this a “conundrum”. Ben Bernanke, who would go on to take the
reins from Greenspan in 2006, credited this decline to a “global savings glut”.
0%
1.0%
2.0%
3.0%
4.0%
5.0%
6.0%
5/1/04
6/1/04
8/1/04
9/1/04
11/1/04
12/1/04
2/1/05
3/1/05
5/1/05
6/1/05
8/1/05
9/1/05
11/1/05
12/1/05
1/1/06
3/1/06
5/1/06
6/1/06
8/1/06
9/1/06
Fed Funds Rate
10yr Treasury Yield
Source: Bloomberg, LP as of December 23, 2014
Chart 1
GHP Investment Advisors, Inc. is a member of The GHP Financial Group
www.GHPIA.com
Federal Funds Rate vs. U.S. 10yr Treasury Yield
2. Page 2GHP Investment Advisors, Inc.
Slower global growth may caution the Federal Reserve against raising interest rates out of concern that we might fall
into the same slump as our trading partners. Looking at GDP and inflation projections for 2014 and 2015 as prepared
by the International Monetary Fund, we find again that while nationally growth in the U.S. is far from robust, it is
better than both the Euro Area and Japan, meanwhile China is decelerating.
We also must consider what motivates the Fed. The Federal Reserve has a dual mandate; in 1977 Congress amended
the Federal Reserve Act, stating the monetary policy objectives of the Federal Reserve as:
“The Board of Governors of the Federal Reserve System and the Federal Open Market Committee shall maintain long
run growth of the monetary and credit aggregates commensurate with the economy’s long run potential to increase
production, so as to promote effectively the goals of maximum employment, stable prices and moderate long-term
interest rates.” [source: ChicagoFed.org]
The Federal Reserve seeks to maintain stable prices, meaning low inflation while encouraging maximum employment,
think “low unemployment rate”. It is a delicate balancing act, one where the winds of world events and the global
economy are constantly blowing in different directions. The oil price collapse that began in October 2014 is an example
Today there exists another savings glut as global investors have driven down interest rates around the world. Germany
has been experiencing negative interest rates on their shorter maturity government bonds and the German 10-yr
government bond yields less than 1%. Other countries with credit ratings below that of the U.S. are also experiencing
lower long term interest rates. Ireland, whose credit rating is seven notches below the AAA rating of the U.S., has a
10-yr government bond that yields more than a half of a percent less than the U.S. 10-yr which is above 2%. Even a
tiny country like Slovakia has interest rates below those of the U.S. As you can see, as paltry as U.S. interest rates may
appear to you and me, to foreign investors these must look like bargains.
Country 2-yr 10-yr Moody's Rating
USA 0.58% 2.12% Aaa
Canada 0.98% 1.79% Aaa
Germany -0.05% 0.62% Aaa
Italy 0.66% 2.00% Baa2
Spain 0.56% 1.79% Baa2
Ireland 0.03% 1.27% Baa1
France -0.01% 0.90% Aa1
Slovakia 0.27% 1.24% A2
Japan 0.00% 0.37% Aa3
Table 1
Source: Bloomberg, LP as of December 23, 2014
Global Interest Rates
Real GDPReal GDPReal GDPReal GDPReal GDPReal GDPReal GDP ProjectionsProjectionsProjections
Country 2007 2008 2009 2010 2011 2012 2013 2014 2015 2019
USA 1.8 -0.3 -2.8 2.5 1.6 2.3 2.2 2.2 3.1 2.6
Euro Area 3.0 0.4 -4.5 1.9 1.6 -0.7 -0.4 0.8 1.3 1.6
Japan 2.2 -1.0 -5.5 4.7 -0.5 1.5 1.5 0.9 0.8 1.0
China 14.2 9.6 9.2 10.4 9.3 7.7 7.7 7.4 7.1 6.3
Consumer PricesConsumer PricesConsumer PricesConsumer PricesConsumer PricesConsumer PricesConsumer Prices ProjectionsProjectionsProjections
Country 2007 2008 2009 2010 2011 2012 2013 2014 2015 2019
USA 2.9 3.8 -0.3 1.6 3.1 2.1 1.5 2.0 2.1 2.0
Euro Area 2.2 3.3 0.3 1.6 2.7 2.5 1.3 0.5 0.9 1.5
Japan 0.1 1.4 -1.3 -0.7 -0.3 0.0 0.4 2.7 2.0 2.0
China 4.8 5.9 -0.7 3.3 5.4 2.6 2.6 2.3 2.5 3.0
Source: International Monetary Fund IMF October 2014Source: International Monetary Fund IMF October 2014Source: International Monetary Fund IMF October 2014Source: International Monetary Fund IMF October 2014Source: International Monetary Fund IMF October 2014Source: International Monetary Fund IMF October 2014
Table 2
Real GDP
Inflation
U.S./Euro Area/Japan/China GDP and Consumer Prices
3. Page 3 GHP Investment Advisors, Inc.
of the many variables the Fed must interpret and anticipate the resulting economic impact. The decline in a core
commodity can be both deflationary and economically stimulating. Inflation is averaging 1.40% in 2014, well below the
Fed’s stated target of 2%. From 2000 through 2007 inflation averaged approximately 1.89%. Since the financial crisis
it has been even lower, averaging 1.54%.
Looking at jobs data we find that metric is less black and white. While the widely quoted Unemployment Rate peaked
at 10% in 2009, it has since fallen to an impressive 5.8% as of October 2014. However, the Labor Force Participation
Rate - which reflects the percentage of the working age population with a job – hovers around 63%, down from the
pre-financial crisis high of 67.3%. We have not witnessed such a low participation rate since early 1978. Looking at the
unemployment rate and the rate of inflation, it is doubtful the Federal Reserve will be compelled to drive interest rates
substantially higher.
Monetary Policy is a delicate balancing act. Like Goldilocks, an economy that is “too hot” can generate excessive
inflation whereas an economy that is “too cold” fails to create meaningful employment. The Federal Reserve must get
it “just right” and a lot is at stake if the Federal Reserve gets it wrong. For example, we witnessed the “Taper Tantrum”
in the second half of 2013 when Fed Chair Bernanke suggested that it might be time to taper the Federal Reserve’s
monetary expansion to wind down quantitative easing. This led to a “tantrum” in the bond market that drove the yield
of the 10-yr treasury from 1.63% to just above 3% between May and December 2013. One could argue this contributed
to the plunge in U.S. GDP in Q1-2014 of -2.1% when the preceding quarter had been +3.5%. With so much at stake,
Fed Chair Janet Yellen may opt for an extension of the status quo rather than rocking the boat and risking a capsizing
of the economy.
For our clients, we continue to take a cautious approach to interest rate sensitive investments. We are constantly
monitoring the markets, vigilantly seeking valuations that are in alignment with our benchmarks. Entering the new
year, interest rates remain at historically low levels. This is a boon for borrowers. However, for investors, many short
term bond yields are below the rate of inflation and long term bond yields are not much higher. When your return on
investment is less than the rate of inflation, you are effectively losing ground.
As we enter into 2015, many expect the Fed to raise interest rates. Many expect long-term yields to be significantly
higher. The Fed itself has indicated they may be in a position to raise rates in 2015. As bond investors we are hopeful
this will occur. However, when reviewing all of the many inputs that go into the Fed’s decision it appears doubtful they
will raise rates meaningfully higher. Furthermore, even if they do they may be frustrated to find that long term yields
may be resistant to change. Simply wishing for higher yields does not make it so. For those desiring materially higher
bond yields, 2015 may bring more frustration.
0
2
4
6
8
10
12
57
59
60
62
63
65
66
68
Labor Participation Rate
Unemployment Rate
10/1/1974
1/1/1976
4/1/1977
7/1/1978
10/1/1979
1/1/1981
4/1/1982
7/1/1983
10/1/1984
1/1/1986
4/1/1987
7/1/1988
10/1/1989
1/1/1991
4/1/1992
7/1/1993
10/1/1994
1/1/1996
4/1/1997
7/1/1998
10/1/1999
1/1/2001
4/1/2002
7/1/2003
10/1/2004
1/1/2006
4/1/2007
7/1/2008
10/1/2009
1/1/2011
4/1/2012
7/1/2013
10/1/2014
Source: Bloomberg, LP as of December 23, 2014
Chart 2 Unemployment Rate vs Labor Participation Rate
UnemploymentRate
LaborParticipationRate
4. GHP Investment Advisors, Inc.Insert Page
*Please note that the P/E data reported above are based on “as reported” earnings information rather than “operating” earnings. “As reported” earnings
include one time write-offs whereas “operating” earnings reflect the profitability of a company as a going concern. We believe P/E ratios based on
operating earnings are a better long-term valuation indicator, but Standard and Poor’s does not report this information for the style indexes used in
our calculations. To address this issue we have also included Price to Book Value (P/BV) and Price to Cash Flow (P/CF) data, which are other important
valuation indicators.
Market Summary
GHP Investment Advisors, Inc. benchmarks are based on proprietary models. P/E, P/BV and P/CF data are provided by Bloomberg L.P. as of 01/05/2015.
The GHPIA Equity Valuation Dashboard
Returns by Index
Index 2014:Q4* YTD*
DJIA Total Return 5.20% 10.04%
NASDAQ Total Return 5.70% 14.75%
SP 500 Total Return 4.93% 13.69%
SP 500/Value 4.14% 9.61%
SP 500/Growth 4.61% 13.01%
SP MidCap 400/Value 6.38% 10.01%
SP MidCap 400/Growth 5.53% 6.46%
SP SmallCap 600/Value 10.0% 5.87%
SP SmallCap 600/Growth 8.88% 2.94%
Asset Class
Price/
Earnings
2014:Q4
P/E
Benchmark
Over/
Under
Valuation
Price/Book
Value
2014:Q4
P/BV
Benchmark
Over/
Under
Valuation
Price/
Cash
Flow
2014:Q4
P/CF
Benchmark
Over/
Under
Valuation
Large-Cap
Growth Stocks
22.7 27.0 -15.9% 4.5 5.7 -21.1% 14.8 17.5 -15.4%
Large-Cap
Value Stocks
15.0 20.2 -25.7% 2.0 2.5 -20.0% 9.2 13.1 -29.8%
Mid-Cap
Growth Stocks
27.0 24.8 8.9% 3.6 4.5 -20.0% 16.3 16.1 1.2%
Mid-Cap
Value Stocks
19.2 19.1 0.5% 1.8 2.2 -18.2% 10.2 12.4 -17.7%
Small-Cap
Growth Stocks
27.0 23.2 16.4% 3.0 3.5 -14.3% 14.6 15.0 -2.7%
Small-Cap
Value Stocks
24.3 18.2 33.5% 1.6 2.1 -23.8% 11.3 11.8 -4.2%
DJIA, NASDAQ SP Returns: Bloomberg L.P. as of 01/05/2015.
*Dividends Reinvested.
5. GHP Investment Advisors, Inc.
Registered Investment Advisor
1670 Broadway, Suite 3000
Denver, Colorado 80202
P (303) 831-5000
F (303) 831-5082
Invest@GHPIA.com
www.GHPIA.com
Brian J. Friedman, CFA President
Robert W. Hochstadt, CPA/PFS Senior Principal
Steven I. Levey, CPA/PFS Principal Emeritus
Carin D. Wagner, CFP® Vice President of Personal Wealth Management
Mike Sullivan, CFP® Wealth Management Advisor
Sommer C. Vincent, RP® Relationship Manager
Deirdre McGuire Client Relations Specialist
Barbara Terrazas Client Relations Specialist
Ron New Fixed Income Portfolio Manager
Brad Engle Research, Trading and Portfolio Analytics
Sebrina Ivey, CPA/PFS, CIA CCO and Operations Manager
Dave Garcia Data and Operations Analyst
Ed Leone Jr., DMD, MBA, CFP®, RFC Associate
Investment Insight is published as a service to our clients and other interested parties. This material is not intended to be relied upon as a forecast, research, investment,
accounting, legal or tax advice, and is not a recommendation, offer or solicitation to buy or sell any securities or to adopt any investment strategy. The views and strategies
described may not be suitable for all investors. References to specific securities, asset classes and financial markets are for illustrative purposes only. Past performance is
no guarantee of future results.
To update your address or to request additional copies of Investment Insight, please contact Sommer Vincent at (303) 831-5055.
Financial Planning
Financial Planning
We create a personalized financial
plan to help you meet your wealth
management goals – and give you
peace of mind.
PortfolioManagement
Portfolio Management
We develop and implement an
integrated portfolio investment
strategy, taking into account your
individual investment goals, time
horizon and risk tolerance.
BusinessAdvisoryServices
Business Advisory Services
We help you drive your continued
success as a business owner, executive
or entrepreneur.
Financial Concierge Services
Financial Concierge Services
We relieve you of the everyday burden
of your financial affairs.
![Page 2GHP Investment Advisors, Inc.
Slower global growth may caution the Federal Reserve against raising interest rates out of concern that we might fall
into the same slump as our trading partners. Looking at GDP and inflation projections for 2014 and 2015 as prepared
by the International Monetary Fund, we find again that while nationally growth in the U.S. is far from robust, it is
better than both the Euro Area and Japan, meanwhile China is decelerating.
We also must consider what motivates the Fed. The Federal Reserve has a dual mandate; in 1977 Congress amended
the Federal Reserve Act, stating the monetary policy objectives of the Federal Reserve as:
“The Board of Governors of the Federal Reserve System and the Federal Open Market Committee shall maintain long
run growth of the monetary and credit aggregates commensurate with the economy’s long run potential to increase
production, so as to promote effectively the goals of maximum employment, stable prices and moderate long-term
interest rates.” [source: ChicagoFed.org]
The Federal Reserve seeks to maintain stable prices, meaning low inflation while encouraging maximum employment,
think “low unemployment rate”. It is a delicate balancing act, one where the winds of world events and the global
economy are constantly blowing in different directions. The oil price collapse that began in October 2014 is an example
Today there exists another savings glut as global investors have driven down interest rates around the world. Germany
has been experiencing negative interest rates on their shorter maturity government bonds and the German 10-yr
government bond yields less than 1%. Other countries with credit ratings below that of the U.S. are also experiencing
lower long term interest rates. Ireland, whose credit rating is seven notches below the AAA rating of the U.S., has a
10-yr government bond that yields more than a half of a percent less than the U.S. 10-yr which is above 2%. Even a
tiny country like Slovakia has interest rates below those of the U.S. As you can see, as paltry as U.S. interest rates may
appear to you and me, to foreign investors these must look like bargains.
Country 2-yr 10-yr Moody's Rating
USA 0.58% 2.12% Aaa
Canada 0.98% 1.79% Aaa
Germany -0.05% 0.62% Aaa
Italy 0.66% 2.00% Baa2
Spain 0.56% 1.79% Baa2
Ireland 0.03% 1.27% Baa1
France -0.01% 0.90% Aa1
Slovakia 0.27% 1.24% A2
Japan 0.00% 0.37% Aa3
Table 1
Source: Bloomberg, LP as of December 23, 2014
Global Interest Rates
Real GDPReal GDPReal GDPReal GDPReal GDPReal GDPReal GDP ProjectionsProjectionsProjections
Country 2007 2008 2009 2010 2011 2012 2013 2014 2015 2019
USA 1.8 -0.3 -2.8 2.5 1.6 2.3 2.2 2.2 3.1 2.6
Euro Area 3.0 0.4 -4.5 1.9 1.6 -0.7 -0.4 0.8 1.3 1.6
Japan 2.2 -1.0 -5.5 4.7 -0.5 1.5 1.5 0.9 0.8 1.0
China 14.2 9.6 9.2 10.4 9.3 7.7 7.7 7.4 7.1 6.3
Consumer PricesConsumer PricesConsumer PricesConsumer PricesConsumer PricesConsumer PricesConsumer Prices ProjectionsProjectionsProjections
Country 2007 2008 2009 2010 2011 2012 2013 2014 2015 2019
USA 2.9 3.8 -0.3 1.6 3.1 2.1 1.5 2.0 2.1 2.0
Euro Area 2.2 3.3 0.3 1.6 2.7 2.5 1.3 0.5 0.9 1.5
Japan 0.1 1.4 -1.3 -0.7 -0.3 0.0 0.4 2.7 2.0 2.0
China 4.8 5.9 -0.7 3.3 5.4 2.6 2.6 2.3 2.5 3.0
Source: International Monetary Fund IMF October 2014Source: International Monetary Fund IMF October 2014Source: International Monetary Fund IMF October 2014Source: International Monetary Fund IMF October 2014Source: International Monetary Fund IMF October 2014Source: International Monetary Fund IMF October 2014
Table 2
Real GDP
Inflation
U.S./Euro Area/Japan/China GDP and Consumer Prices](data:image/gif;base64,R0lGODlhAQABAIAAAAAAAP///yH5BAEAAAAALAAAAAABAAEAAAIBRAA7)