SlideShare une entreprise Scribd logo
1  sur  19
Drawing Trigonometric Graphs.
The Basic Graphs.
You should already be familiar with the following graphs:

Y = SIN X
Y= COS X
Y = TAN X
Changing Trigonometric Graphs.
You should know how the following graphs differ from the basic
trigonometric graphs:

Y= 2 SIN X


 The 2 in front of the sin x changes the “amplitude” of the graph.
Y = 5 COS X


As expected the amplitude of the graph is now 5. Hence the
graph has a maximum value of 5 and a minimum value of –5.
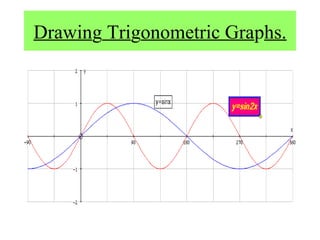
Y = SIN 2X


  By introducing the 2 in front of the X , the “period” of the
  graph now becomes 360o ÷ 2 = 180o.
Y= COS 6X


The period of the graph has now become 360o ÷ 6 = 60o as
expected.
Y= SIN X + 1


The plus 1 has the effect of “translating” the graph one
square parallel to the y axis.
Y = COS X - 5


 The cosine graph is translated 5 squares downwards parallel to
 the y axis.
Y= – SIN X


The minus sign in front of the function “reflects” the whole graph
in the X axis.
Y = – COS X


 As expected the cosine graph is reflected in the X axis.
Summary Of Effects.
(1) Y= K COS X & Y = K SINX

        +k

                   -k
                           The amplitude of the function is “K” .

(2) Y = COS KX & Y = SIN KX


                     360 ÷ K

                        The period of the function is “360 ÷ k” .
(3) Y= COS X + K & Y = SIN X + K


        +k

        -k


                              Translates the graph + K or – K
                              parallel to the y axis.
 (4) Y = - COS X & Y = - SIN X.


        Y = - COS X               Reflects the graph in the x axis.
Combining The Effects.


We are now going to draw more complex trigonometric graphs
like the one shown above, by considering what each part of the
equation does to the graph of the equation.
y = 4 sin x
Example 1.

Draw the graph of :               4
       y = 4sin2x + 3

Solution.
                        y = 4 sin 2x
Draw the graph of :
y = sin x

                               180o

                        y = 4sin 2x + 3

                                          +3
Example 2                         y = - 6cos5x
Draw the graph y = 2 – 6 cos 5x

Solution.

Draw the graph of :

y = cos x
                                   y = 2 – 6 cos 5x


y= 6cos5x

                      72o

                  6
Creating A Phase Shift.
Shown below is the graph of y = sin xo


Now compare it with the graph of y= sin( x - 60o)


                 + 60o

  The graph is translated 60o to the right parallel to the x axis.
Shown below is the graph of y = cos x.


Now compare it to the graph of y = cos ( x + 45o)


                        -45o

  The graph is translated 45o to the left parallel to the x axis.

Contenu connexe

Tendances

14.6 triple integrals in cylindrical and spherical coordinates
14.6 triple integrals in cylindrical and spherical coordinates14.6 triple integrals in cylindrical and spherical coordinates
14.6 triple integrals in cylindrical and spherical coordinatesEmiey Shaari
 
Coordinate and unit vector
Coordinate and unit vectorCoordinate and unit vector
Coordinate and unit vectorJobins George
 
Lesson 16: Inverse Trigonometric Functions (slides)
Lesson 16: Inverse Trigonometric Functions (slides)Lesson 16: Inverse Trigonometric Functions (slides)
Lesson 16: Inverse Trigonometric Functions (slides)Matthew Leingang
 
Complex numbers precalculus
Complex numbers   precalculusComplex numbers   precalculus
Complex numbers precalculusItumeleng Segona
 
Lesson 32: The Fundamental Theorem Of Calculus
Lesson 32: The Fundamental Theorem Of CalculusLesson 32: The Fundamental Theorem Of Calculus
Lesson 32: The Fundamental Theorem Of CalculusMatthew Leingang
 
30 surface integrals
30 surface integrals30 surface integrals
30 surface integralsmath267
 
Unit Circle - Trigonometry
Unit Circle - TrigonometryUnit Circle - Trigonometry
Unit Circle - TrigonometrySimon Borgert
 
Parent function and Transformation.ppt
Parent function and Transformation.pptParent function and Transformation.ppt
Parent function and Transformation.pptRichard Selasie Oteng
 
26 alternating series and conditional convergence x
26 alternating series and conditional convergence x26 alternating series and conditional convergence x
26 alternating series and conditional convergence xmath266
 
Volumes of solids of revolution dfs
Volumes of solids of revolution dfsVolumes of solids of revolution dfs
Volumes of solids of revolution dfsFarhana Shaheen
 
Lesson 2: Vectors and the Dot Product
Lesson 2: Vectors and the Dot ProductLesson 2: Vectors and the Dot Product
Lesson 2: Vectors and the Dot ProductMatthew Leingang
 
Finding the area under a curve using integration
Finding the area under a curve using integrationFinding the area under a curve using integration
Finding the area under a curve using integrationChristopher Chibangu
 
9 trigonometric functions via the unit circle nat
9 trigonometric functions via the unit circle nat9 trigonometric functions via the unit circle nat
9 trigonometric functions via the unit circle natmath260
 
2.5 computations of derivatives
2.5 computations of derivatives2.5 computations of derivatives
2.5 computations of derivativesmath265
 
Logarithm lesson
Logarithm lessonLogarithm lesson
Logarithm lessonyrubins
 

Tendances (20)

14.6 triple integrals in cylindrical and spherical coordinates
14.6 triple integrals in cylindrical and spherical coordinates14.6 triple integrals in cylindrical and spherical coordinates
14.6 triple integrals in cylindrical and spherical coordinates
 
Coordinate and unit vector
Coordinate and unit vectorCoordinate and unit vector
Coordinate and unit vector
 
Lesson 16: Inverse Trigonometric Functions (slides)
Lesson 16: Inverse Trigonometric Functions (slides)Lesson 16: Inverse Trigonometric Functions (slides)
Lesson 16: Inverse Trigonometric Functions (slides)
 
Complex numbers precalculus
Complex numbers   precalculusComplex numbers   precalculus
Complex numbers precalculus
 
Lesson 32: The Fundamental Theorem Of Calculus
Lesson 32: The Fundamental Theorem Of CalculusLesson 32: The Fundamental Theorem Of Calculus
Lesson 32: The Fundamental Theorem Of Calculus
 
30 surface integrals
30 surface integrals30 surface integrals
30 surface integrals
 
Unit Circle - Trigonometry
Unit Circle - TrigonometryUnit Circle - Trigonometry
Unit Circle - Trigonometry
 
parabola class 12
parabola class 12parabola class 12
parabola class 12
 
Curve sketching
Curve sketchingCurve sketching
Curve sketching
 
Parent function and Transformation.ppt
Parent function and Transformation.pptParent function and Transformation.ppt
Parent function and Transformation.ppt
 
Binomial expansion
Binomial expansionBinomial expansion
Binomial expansion
 
26 alternating series and conditional convergence x
26 alternating series and conditional convergence x26 alternating series and conditional convergence x
26 alternating series and conditional convergence x
 
Volumes of solids of revolution dfs
Volumes of solids of revolution dfsVolumes of solids of revolution dfs
Volumes of solids of revolution dfs
 
Lesson 2: Vectors and the Dot Product
Lesson 2: Vectors and the Dot ProductLesson 2: Vectors and the Dot Product
Lesson 2: Vectors and the Dot Product
 
The integral
The integralThe integral
The integral
 
Funzioni esponenziali logaritmiche
Funzioni esponenziali logaritmicheFunzioni esponenziali logaritmiche
Funzioni esponenziali logaritmiche
 
Finding the area under a curve using integration
Finding the area under a curve using integrationFinding the area under a curve using integration
Finding the area under a curve using integration
 
9 trigonometric functions via the unit circle nat
9 trigonometric functions via the unit circle nat9 trigonometric functions via the unit circle nat
9 trigonometric functions via the unit circle nat
 
2.5 computations of derivatives
2.5 computations of derivatives2.5 computations of derivatives
2.5 computations of derivatives
 
Logarithm lesson
Logarithm lessonLogarithm lesson
Logarithm lesson
 

En vedette

Graphing trigonometric functions
Graphing trigonometric functionsGraphing trigonometric functions
Graphing trigonometric functionsLeo Crisologo
 
Graphs of trigonometry functions
Graphs of trigonometry functionsGraphs of trigonometry functions
Graphs of trigonometry functionslgemgnani
 
Similarity of triangles -GEOMETRY
Similarity of triangles -GEOMETRYSimilarity of triangles -GEOMETRY
Similarity of triangles -GEOMETRYindianeducation
 
Chuyên đề tìm giới hạn nâng cao
Chuyên đề tìm giới hạn nâng caoChuyên đề tìm giới hạn nâng cao
Chuyên đề tìm giới hạn nâng caoBống Bình Boong
 
PPT on Trigonometric Functions. Class 11
PPT on Trigonometric Functions. Class 11PPT on Trigonometric Functions. Class 11
PPT on Trigonometric Functions. Class 11Rushikesh Reddy
 
chuyên đề và phương pháp tính giới hạn và liên tục của hàm sô
chuyên đề và phương pháp tính giới hạn và liên tục của hàm sôchuyên đề và phương pháp tính giới hạn và liên tục của hàm sô
chuyên đề và phương pháp tính giới hạn và liên tục của hàm sôThế Giới Tinh Hoa
 

En vedette (11)

Core 3 Modulus 2
Core 3 Modulus 2Core 3 Modulus 2
Core 3 Modulus 2
 
Core 3 Functions 1
Core 3 Functions 1Core 3 Functions 1
Core 3 Functions 1
 
Graphing trigonometric functions
Graphing trigonometric functionsGraphing trigonometric functions
Graphing trigonometric functions
 
Graphs of trigonometry functions
Graphs of trigonometry functionsGraphs of trigonometry functions
Graphs of trigonometry functions
 
Similarity of triangles -GEOMETRY
Similarity of triangles -GEOMETRYSimilarity of triangles -GEOMETRY
Similarity of triangles -GEOMETRY
 
Trigonometry Functions
Trigonometry FunctionsTrigonometry Functions
Trigonometry Functions
 
Taburan normal 1
Taburan normal 1Taburan normal 1
Taburan normal 1
 
Chuyên đề tìm giới hạn nâng cao
Chuyên đề tìm giới hạn nâng caoChuyên đề tìm giới hạn nâng cao
Chuyên đề tìm giới hạn nâng cao
 
PPT on Trigonometric Functions. Class 11
PPT on Trigonometric Functions. Class 11PPT on Trigonometric Functions. Class 11
PPT on Trigonometric Functions. Class 11
 
chuyên đề và phương pháp tính giới hạn và liên tục của hàm sô
chuyên đề và phương pháp tính giới hạn và liên tục của hàm sôchuyên đề và phương pháp tính giới hạn và liên tục của hàm sô
chuyên đề và phương pháp tính giới hạn và liên tục của hàm sô
 
Statistik (Bab 4)
Statistik (Bab 4) Statistik (Bab 4)
Statistik (Bab 4)
 

Similaire à Drawing trigonometric graphs.

Graphs of trigonometric exponential functions lecture
Graphs of trigonometric exponential functions lectureGraphs of trigonometric exponential functions lecture
Graphs of trigonometric exponential functions lectureAdnanBukhari13
 
6.6 analyzing graphs of quadratic functions
6.6 analyzing graphs of quadratic functions6.6 analyzing graphs of quadratic functions
6.6 analyzing graphs of quadratic functionsJessica Garcia
 
Graphs of the Sine and Cosine Functions Lecture
Graphs of the Sine and Cosine Functions LectureGraphs of the Sine and Cosine Functions Lecture
Graphs of the Sine and Cosine Functions LectureFroyd Wess
 
C2 st lecture 5 handout
C2 st lecture 5 handoutC2 st lecture 5 handout
C2 st lecture 5 handoutfatima d
 
Lesson 2: A Catalog of Essential Functions (slides)
Lesson 2: A Catalog of Essential Functions (slides)Lesson 2: A Catalog of Essential Functions (slides)
Lesson 2: A Catalog of Essential Functions (slides)Matthew Leingang
 
Lesson 2: A Catalog of Essential Functions (slides)
Lesson 2: A Catalog of Essential Functions (slides)Lesson 2: A Catalog of Essential Functions (slides)
Lesson 2: A Catalog of Essential Functions (slides)Mel Anthony Pepito
 
5.1graphquadratics
5.1graphquadratics5.1graphquadratics
5.1graphquadraticsvhiggins1
 
C3 Transformations
C3 TransformationsC3 Transformations
C3 TransformationsJJkedst
 
C3 Transformations
C3 TransformationsC3 Transformations
C3 TransformationsJJkedst
 
chapter1_part2.pdf
chapter1_part2.pdfchapter1_part2.pdf
chapter1_part2.pdfAliEb2
 
02.21.2020 Algebra I Quadraic Functions.ppt
02.21.2020  Algebra I Quadraic Functions.ppt02.21.2020  Algebra I Quadraic Functions.ppt
02.21.2020 Algebra I Quadraic Functions.pptjannelewlawas
 
Trigonometric Functions and their Graphs
Trigonometric Functions and their GraphsTrigonometric Functions and their Graphs
Trigonometric Functions and their GraphsMohammed Ahmed
 
6. 1 graphing quadratics
6. 1 graphing quadratics6. 1 graphing quadratics
6. 1 graphing quadraticsJessica Garcia
 
graphs of functions 2
 graphs of functions 2 graphs of functions 2
graphs of functions 2larasati06
 
April 10, 2015
April 10, 2015April 10, 2015
April 10, 2015khyps13
 

Similaire à Drawing trigonometric graphs. (20)

Graphs of trigonometric exponential functions lecture
Graphs of trigonometric exponential functions lectureGraphs of trigonometric exponential functions lecture
Graphs of trigonometric exponential functions lecture
 
6.6 analyzing graphs of quadratic functions
6.6 analyzing graphs of quadratic functions6.6 analyzing graphs of quadratic functions
6.6 analyzing graphs of quadratic functions
 
Graphs of the Sine and Cosine Functions Lecture
Graphs of the Sine and Cosine Functions LectureGraphs of the Sine and Cosine Functions Lecture
Graphs of the Sine and Cosine Functions Lecture
 
C2 st lecture 5 handout
C2 st lecture 5 handoutC2 st lecture 5 handout
C2 st lecture 5 handout
 
Lesson 2: A Catalog of Essential Functions (slides)
Lesson 2: A Catalog of Essential Functions (slides)Lesson 2: A Catalog of Essential Functions (slides)
Lesson 2: A Catalog of Essential Functions (slides)
 
Lesson 2: A Catalog of Essential Functions (slides)
Lesson 2: A Catalog of Essential Functions (slides)Lesson 2: A Catalog of Essential Functions (slides)
Lesson 2: A Catalog of Essential Functions (slides)
 
Properties of-graphs-2.5
Properties of-graphs-2.5Properties of-graphs-2.5
Properties of-graphs-2.5
 
5.1graphquadratics
5.1graphquadratics5.1graphquadratics
5.1graphquadratics
 
C3 Transformations
C3 TransformationsC3 Transformations
C3 Transformations
 
C3 Transformations
C3 TransformationsC3 Transformations
C3 Transformations
 
chapter1_part2.pdf
chapter1_part2.pdfchapter1_part2.pdf
chapter1_part2.pdf
 
02.21.2020 Algebra I Quadraic Functions.ppt
02.21.2020  Algebra I Quadraic Functions.ppt02.21.2020  Algebra I Quadraic Functions.ppt
02.21.2020 Algebra I Quadraic Functions.ppt
 
Trigonometric Functions and their Graphs
Trigonometric Functions and their GraphsTrigonometric Functions and their Graphs
Trigonometric Functions and their Graphs
 
Grph quad fncts
Grph quad fnctsGrph quad fncts
Grph quad fncts
 
6. 1 graphing quadratics
6. 1 graphing quadratics6. 1 graphing quadratics
6. 1 graphing quadratics
 
graphs of functions 2
 graphs of functions 2 graphs of functions 2
graphs of functions 2
 
Notes 3-4
Notes 3-4Notes 3-4
Notes 3-4
 
April 10, 2015
April 10, 2015April 10, 2015
April 10, 2015
 
DIFFERENTIATION
DIFFERENTIATIONDIFFERENTIATION
DIFFERENTIATION
 
Quadratic equations
Quadratic equationsQuadratic equations
Quadratic equations
 

Drawing trigonometric graphs.

  • 2. The Basic Graphs. You should already be familiar with the following graphs: Y = SIN X
  • 5. Changing Trigonometric Graphs. You should know how the following graphs differ from the basic trigonometric graphs: Y= 2 SIN X The 2 in front of the sin x changes the “amplitude” of the graph.
  • 6. Y = 5 COS X As expected the amplitude of the graph is now 5. Hence the graph has a maximum value of 5 and a minimum value of –5.
  • 7. Y = SIN 2X By introducing the 2 in front of the X , the “period” of the graph now becomes 360o ÷ 2 = 180o.
  • 8. Y= COS 6X The period of the graph has now become 360o ÷ 6 = 60o as expected.
  • 9. Y= SIN X + 1 The plus 1 has the effect of “translating” the graph one square parallel to the y axis.
  • 10. Y = COS X - 5 The cosine graph is translated 5 squares downwards parallel to the y axis.
  • 11. Y= – SIN X The minus sign in front of the function “reflects” the whole graph in the X axis.
  • 12. Y = – COS X As expected the cosine graph is reflected in the X axis.
  • 13. Summary Of Effects. (1) Y= K COS X & Y = K SINX +k -k The amplitude of the function is “K” . (2) Y = COS KX & Y = SIN KX 360 ÷ K The period of the function is “360 ÷ k” .
  • 14. (3) Y= COS X + K & Y = SIN X + K +k -k Translates the graph + K or – K parallel to the y axis. (4) Y = - COS X & Y = - SIN X. Y = - COS X Reflects the graph in the x axis.
  • 15. Combining The Effects. We are now going to draw more complex trigonometric graphs like the one shown above, by considering what each part of the equation does to the graph of the equation.
  • 16. y = 4 sin x Example 1. Draw the graph of : 4 y = 4sin2x + 3 Solution. y = 4 sin 2x Draw the graph of : y = sin x 180o y = 4sin 2x + 3 +3
  • 17. Example 2 y = - 6cos5x Draw the graph y = 2 – 6 cos 5x Solution. Draw the graph of : y = cos x y = 2 – 6 cos 5x y= 6cos5x 72o 6
  • 18. Creating A Phase Shift. Shown below is the graph of y = sin xo Now compare it with the graph of y= sin( x - 60o) + 60o The graph is translated 60o to the right parallel to the x axis.
  • 19. Shown below is the graph of y = cos x. Now compare it to the graph of y = cos ( x + 45o) -45o The graph is translated 45o to the left parallel to the x axis.