JLL Louisville Office Insight & Statistics - Q4 2016
•
1 j'aime•170 vues

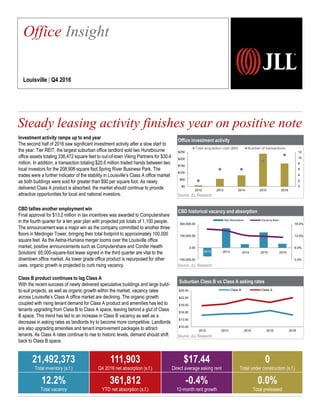
Investment activity returned to Louisville as two high-profile office assets traded hands to end the year, reaffirming investor confidence in the market. The downtown office market notched another significant win as Computershare announced a ten year, 1,100 job hiring increase that will result in an expansion of 100,000 square feet in Meidinger tower. As newly delivered Class A product is be absorbed within the market, Class B space continues to lag behind as asking rates are decreasing.

Recommandé
Recommandé
Contenu connexe
Tendances
Tendances (20)
En vedette
En vedette (17)
Similaire à JLL Louisville Office Insight & Statistics - Q4 2016
Similaire à JLL Louisville Office Insight & Statistics - Q4 2016 (20)
Plus de Ross Bratcher
Plus de Ross Bratcher (8)
Dernier
Dernier (20)
JLL Louisville Office Insight & Statistics - Q4 2016
- 1. Office investment activity Source: JLL Research CBD historical vacancy and absorption Source: JLL Research Suburban Class B vs Class A asking rates Source: JLL Research 2012 2013 2014 2015 2016 $10.00 $13.00 $16.00 $19.00 $22.00 $25.00 Class B Class A Investment activity ramps up to end year The second half of 2016 saw significant investment activity after a slow start to the year. Tier REIT, the largest suburban office landlord sold two Hurstbourne office assets totaling 336,472 square feet to out-of-town Viking Partners for $30.4 million. In addition, a transaction totaling $20.6 million traded hands between two local investors for the 208,906 square foot Spring River Business Park. The trades were a further indicator of the stability in Louisville’s Class A office market as both buildings were sold for greater than $90 per square foot. As newly delivered Class A product is absorbed, the market should continue to provide attractive opportunities for local and national investors. CBD tallies another employment win Final approval for $13.2 million in tax incentives was awarded to Computershare in the fourth quarter for a ten year plan with projected job totals of 1,100 people. The announcement was a major win as the company committed to another three floors in Meidinger Tower, bringing their total footprint to approximately 100,000 square feet. As the Aetna-Humana merger looms over the Louisville office market, positive announcements such as Computershare and Conifer Health Solutions’ 65,000-square-foot lease signed in the third quarter are vital to the downtown office market. As lower grade office product is repurposed for other uses, organic growth is projected to curb rising vacancy. Class B product continues to lag Class A With the recent success of newly delivered speculative buildings and large build- to-suit projects, as well as organic growth within the market, vacancy rates across Louisville’s Class A office market are declining. The organic growth coupled with rising tenant demand for Class A product and amenities has led to tenants upgrading from Class B to Class A space, leaving behind a glut of Class B space. This trend has led to an increase in Class B vacancy as well as a decrease in asking rates as landlords try to become more competitive. Landlords are also upgrading amenities and tenant improvement packages to attract tenants. As Class A rates continue to rise to historic levels, demand should shift back to Class B space. Steady leasing activity finishes year on positive note 2,257 Office Insight Louisville | Q4 2016 0 2 4 6 8 10 12 $0 $50 $100 $150 $200 $250 2012 2013 2014 2015 2016 Total acquisition cost ($M) Number of transactions 0.0% 6.0% 12.0% 18.0% 2012 2013 2014 2015 2016 -150,000.00 0.00 150,000.00 300,000.00 Net Absorption Vacancy Rate 2013 2014 2015 2016 21,492,373 Total inventory (s.f.) 111,903 Q4 2016 net absorption (s.f.) $17.44 Direct average asking rent 0 Total under construction (s.f.) 12.2% Total vacancy 361,812 YTD net absorption (s.f.) -0.4% 12-month rent growth 0.0% Total preleased
- 2. Current conditions – submarket Historical leasing activity (s.f.) Source: JLL Research Source: JLL Research Total net absorption (s.f.) Source: JLL Research Total vacancy rate (%) Source: JLL Research Direct average asking rent ($ p.s.f.) Source: JLL Research 517,690 -148,020 -77,885 86,194 462,281 313,754 426,281 204,612 304,088 361,812 -200,000 0 200,000 400,000 600,000 2007 2008 2009 2010 2011 2012 2013 2014 2015 2016 $16.59 $16.60 $16.93 $17.24 $16.97 $16.31 $17.11 $17.23 $17.50 $17.44 $15.50 $16.00 $16.50 $17.00 $17.50 $18.00 2007 2008 2009 2010 2011 2012 2013 2014 2015 2016 11.0% 12.5% 14.2% 15.9% 15.3% 14.8% 13.6% 13.1% 12.8% 12.2% 5.0% 7.0% 9.0% 11.0% 13.0% 15.0% 17.0% 2007 2008 2009 2010 2011 2012 2013 2014 2015 2016 959,766 1,067,415 938,552 738,564 991,426 0 200,000 400,000 600,000 800,000 1,000,000 1,200,000 2012 2013 2014 2015 2016 ©2016 Jones Lang LaSalle IP, Inc. All rights reserved.For more information, contact: Ross Bratcher | ross.bratcher@am.jll.com Landlordleverage Tenantleverage Peaking market Falling market Bottoming market Rising market Plainview/Middletown CBD South Central Hurstbourne/Lyndon St. Matthews Westport Road/Brownsboro Rd
- 3. Class Inventory (s.f.) Total net absorption (s.f.) YTD total net absorption (s.f.) YTD total net absorption (% ofstock) Directvacancy (%) Total vacancy (%) Average direct asking rent($ p.s.f.) YTD completions (s.f.) Under construction (s.f.) CBD Totals 10,293,175 14,968 32,112 0.3% 11.2% 11.6% $16.54 0 0 Urban Totals 10,293,175 14,968 32,112 0.3% 11.2% 11.6% $16.54 0 0 Hurstbourne/Lyndon Totals 4,808,195 17,519 89,887 1.9% 13.1% 13.3% $21.74 245,000 0 Plainview/Middletown Totals 2,888,204 311 77,715 2.7% 13.5% 13.5% $15.74 38,400 0 South Central Totals 1,493,851 53,410 79,841 5.3% 9.1% 15.3% $13.24 0 0 St. Matthews Totals 1,079,692 23,372 33,897 3.1% 8.4% 8.4% $17.61 45,000 0 WestportRoad/Brownsboro Rd Totals 929,256 2,323 48,360 5.2% 8.5% 9.1% $21.62 0 0 Suburbs Totals 11,199,198 96,935 329,700 2.9% 11.8% 12.8% $18.21 328,400 0 Louisville Totals 21,492,373 111,903 361,812 1.7% 11.5% 12.2% $17.44 328,400 0 CBD A 4,295,069 8,426 35,426 0.8% 11.0% 11.8% $19.42 0 0 Urban A 4,295,069 8,426 35,426 0.8% 11.0% 11.8% $19.42 0 0 Hurstbourne/Lyndon A 3,835,708 24,353 95,432 2.5% 13.6% 13.8% $22.63 245,000 0 Plainview/Middletown A 1,027,506 4,256 54,763 5.3% 6.2% 5.9% $18.47 38,400 0 St. Matthews A 459,453 13,750 33,723 7.3% 7.1% 7.1% $22.45 45,000 0 WestportRoad/Brownsboro Rd A 783,477 2,323 52,571 6.7% 8.8% 9.6% $22.31 0 0 Suburbs A 6,106,144 44,682 236,489 3.9% 11.2% 11.4% $22.12 328,400 0 Louisville A 10,401,213 53,108 271,915 2.6% 11.1% 11.6% $20.98 328,400 0 CBD B 5,998,106 6,542 -3,314 -0.1% 11.3% 11.4% $14.65 0 0 Urban B 5,998,106 6,542 -3,314 -0.1% 11.3% 11.4% $14.65 0 0 Hurstbourne/Lyndon B 972,487 -6,834 -5,545 -0.6% 11.4% 11.4% $16.24 0 0 Plainview/Middletown B 1,860,698 -3,945 22,952 1.2% 17.5% 17.8% $15.35 0 0 South Central B 1,493,851 53,410 79,841 5.3% 9.1% 15.3% $13.24 0 0 St. Matthews B 620,239 9,622 174 0.0% 9.3% 9.3% $15.26 0 0 WestportRoad/Brownsboro Rd B 145,779 0 -4,211 -2.9% 6.8% 6.8% $15.95 0 0 Suburbs B 5,093,054 52,253 93,211 1.8% 12.6% 14.5% $14.89 0 0 Louisville B 11,091,160 58,795 89,897 0.8% 11.9% 12.8% $14.68 0 0 2,257 Office Statistics Louisville | Q4 2016 ©2016 Jones Lang LaSalle IP, Inc. All rights reserved.For more information, contact: Ross Bratcher | ross.bratcher@am.jll.com