1. $5,429
60%
T H E K A I S E R FA M I LY F O U N D AT I O N
Employer Health Benefits
AND
2011
H E A L T H R E S E A R C H & E D Bene A T2I0O1N ANL A LTSR RU ES T
Employer Health U C ts 1 AN U U V Y
2 0 1 1 S u m m a r y o f F i n d i n g s
E mployer-sponsored insurance is the leading source of health insurance, covering about 150 million nonelderly people
in America.1 To provide current information about the nature of employer-sponsored health benefits, the Kaiser Family
Foundation (Kaiser) and the Health Research & Educational Trust (HRET) conduct an annual national survey of nonfederal
private and public employers with three or more workers. This is the thirteenth Kaiser/HRET survey and reflects health benefit
information for 2011.
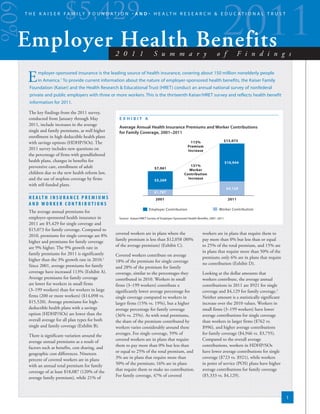
The key findings from the 2011 survey,
conducted from January through May EXHIBIT A
2011, include increases in the average
Average Annual Health Insurance Premiums and Worker Contributions
single and family premiums, as well higher for Family Coverage, 2001–2011
enrollment in high deductible health plans
$15,073
with savings options (HDHP/SOs). The 113%
Premium
2011 survey includes new questions on Increase
the percentage of firms with grandfathered
health plans, changes in benefits for $10,944
preventive care, enrollment of adult 131%
$7,061 Worker
children due to the new health reform law, Contribution
and the use of stoploss coverage by firms $5,269
Increase
with self-funded plans.
$4,129
$1,787
H E A LT H I N S U R A N C E P R E M I U M S 2001 2011
AND WORKER CONTRIBUTIONS
Employer Contribution Worker Contribution
The average annual premiums for
employer-sponsored health insurance in Source: Kaiser/HRET Survey of Employer-Sponsored Health Bene ts, 2001–2011.
2011 are $5,429 for single coverage and
$15,073 for family coverage. Compared to
2010, premiums for single coverage are 8% covered workers are in plans where the workers are in plans that require them to
higher and premiums for family coverage family premium is less than $12,058 (80% pay more than 0% but less than or equal
are 9% higher. The 9% growth rate in of the average premium) (Exhibit C). to 25% of the total premium, and 15% are
family premiums for 2011 is significantly in plans that require more than 50% of the
Covered workers contribute on average premium; only 6% are in plans that require
higher than the 3% growth rate in 2010.2 18% of the premium for single coverage
Since 2001, average premiums for family no contribution (Exhibit D).
and 28% of the premium for family
coverage have increased 113% (Exhibit A). coverage, similar to the percentages they Looking at the dollar amounts that
Average premiums for family coverage contributed in 2010. Workers in small workers contribute, the average annual
are lower for workers in small firms firms (3–199 workers) contribute a contributions in 2011 are $921 for single
(3–199 workers) than for workers in large significantly lower average percentage for coverage and $4,129 for family coverage.3
firms (200 or more workers) ($14,098 vs. single coverage compared to workers in Neither amount is a statistically significant
$15,520). Average premiums for high- larger firms (15% vs. 19%), but a higher increase over the 2010 values. Workers in
deductible health plans with a savings average percentage for family coverage small firms (3–199 workers) have lower
option (HDHP/SOs) are lower than the (36% vs. 25%). As with total premiums, average contributions for single coverage
overall average for all plan types for both the share of the premium contributed by than workers in larger firms ($762 vs.
single and family coverage (Exhibit B). workers varies considerably around these $996), and higher average contributions
There is significant variation around the averages. For single coverage, 59% of for family coverage ($4,946 vs. $3,755).
average annual premiums as a result of covered workers are in plans that require Compared to the overall average
factors such as benefits, cost sharing, and them to pay more than 0% but less than contributions, workers in HDHP/SOs
geographic cost differences. Nineteen or equal to 25% of the total premium, and have lower average contributions for single
percent of covered workers are in plans 3% are in plans that require more than coverage ($723 vs. $921), while workers
with an annual total premium for family 50% of the premium; 16% are in plans in point of service (POS) plans have higher
coverage of at least $18,087 (120% of the that require them to make no contribution. average contributions for family coverage
average family premium), while 21% of For family coverage, 47% of covered ($5,333 vs. $4,129).
1
2. Employer Health Bene ts 2 0 1 1 A N N U A L S U R V E Y
2 011
EXHIBIT B
Average Annual Firm and Worker Premium Contributions and Total Premiums for Covered Workers
for Single and Family Coverage, by Plan Type, 2011
S
HMO
Single $941 $4,408 $5,350
Family $4,148 $11,140 $15,288
PPO
Single $1,002 $4,582 $5,584
Family $4,072 $11,333 $15,404
F
POS
Single $784 $5,057* $5,841
Family $5,333* $9,927 $15,260
HDHP/SO $723*
Single $4,070* $4,793*
Family $3,634 $10,070* $13,704*
ALL PLANS
Single $921 $4,508 $5,429
Family $4,129 $10,944 $15,073
$0 $2,000 $4,000 $6,000 $8,000 $10,000 $12,000 $14,000 $16,000 $18,000
Worker Contribution Employer Contribution
*Estimate is statistically di erent from All Plans estimate by coverage type (p<.05).
Source: Kaiser/HRET Survey of Employer-Sponsored Health Bene ts, 2011.
PLAN ENROLLMENT with no general annual deductible still face The majority of workers also have to pay a
Overall, PPOs are by far the most common other types of cost sharing when they use portion of the cost of physician office visits.
plan type, enrolling 55% of covered covered services. About three-in-four covered workers pay
workers. Seventeen percent of covered a copayment (a fixed dollar amount) for
Among workers with a general annual office visits with a primary care physician
workers are enrolled in an HMO, 10% deductible, the average deductible amount
are enrolled in a POS plan, and 1% are (74%) or a specialist physician (73%), in
for single coverage is $675 for workers in addition to any general annual deductible
enrolled in a conventional plan. Enrollment PPOs, $911 for workers in HMOs, $928
in HDHP/SOs continues to rise, with 17% a plan may have. Smaller shares of workers
for workers in POS plans, and $1,908 for pay coinsurance (a percentage of the
of covered workers in an HDHP/SO in workers in HDHP/SOs (which by definition
2011, up from 13% of covered workers in covered amount) for primary care office
have high deductibles). As in recent years, visits (17%) or specialty care visits (18%).
2010, and 8% in 2009. The enrollment workers with single coverage in small firms
distribution varies by firm size, with PPOs Most covered workers in HMOs, PPOs,
(3–199 workers) have higher deductibles and POS plans face copayments, while
and HMOs relatively more popular among than workers in large firms (200 or
large firms (200 or more workers) and PPOs covered workers in HDHP/SOs are more
more workers); for example, the average likely to have coinsurance requirements
and HDHP/SOs relatively more popular in deductibles for single coverage in PPOs,
smaller firms. or no cost sharing after the deductible is
the most common plan type, are $1,202 met. For in-network office visits, covered
for workers in small firms (3–199 workers) workers with a copayment pay an average of
EMPLOYEE COST SHARING compared to $505 for workers in larger firms. $22 for primary care and $32 for specialty
Most covered workers face additional Overall, 31% of covered workers are in a care. For covered workers with coinsurance,
costs when they use health care services. plan with a deductible of at least $1,000 for the average coinsurance is 18% for both
A large share of workers in PPOs (81%) single coverage, similar to the 27% reported primary care and specialty care. While
and POS plans (69%) have a general in 2010, but significantly more than the the survey collects information on only
annual deductible for single coverage that 22% reported in 2009 (Exhibit E). Covered in-network cost sharing, we note that out-
must be met before all or most services workers in small firms (3–199 workers) of-network cost sharing is often higher.
are reimbursed by the plan. In contrast, remain more likely than covered workers in
only 29% of workers in HMOs have a larger firms (50% vs. 22%) to be in plans
general annual deductible. Many workers with deductibles of at least $1,000.
2
T H E K A I S E R FA M I LY F O U N D AT I O N AND H E A LT H R E S E A R C H & E D U C AT I O N A L T R U S T
3. Employer Health Bene ts 2 0 1 1 A N N U A L S U R V E Y
2 011
EXHIBIT C
Distribution of Premiums for Single and Family Coverage Relative to the Average Annual Single or Family Premium, 2011
S
Single Coverage Family Coverage
Premium Range, Relative to Premium Range, Percentage of Covered Premium Range, Percentage of Covered
Average Premium Dollar Amount Workers in Range Dollar Amount Workers in Range
Less than 80% Less Than $4,344 21% Less Than $12,058 21%
80% to Less Than 90% $4,344 to <$4,886 15% $12,058 to <$13,565 14%
90% to Less Than Average $4,886 to <$5,429 20% $13,565 to <$15,073 16%
Average to Less Than 110% $5,429 to <$5,972 15% $15,073 to <$16,580 16%
F
110% to Less Than 120% $5,972 to <$6,515 11% $16,580 to <$18,087 14%
120% or More $6,515 or More 18% $18,087 or More 19%
Note: The average annual premium is $5,429 for single coverage and $15,073 for family coverage.
Source: Kaiser/HRET Survey of Employer-Sponsored Health Bene ts, 2011.
Almost all covered workers (98%) have pattern for prescription drugs than other Lower percentages have per day (per
prescription drug coverage, and nearly all plan types: 57% of covered workers are diem) payments (6%), a separate hospital
face cost sharing for their prescriptions. enrolled a plan with three or more tiers of deductible (3%), or both copayments
Over three-quarters (77%) of covered cost sharing while 17% are in plans that pay and coinsurance (9%). The average
workers are in plans with three or more 100% of prescription costs once the plan coinsurance rate for hospital admissions is
tiers of cost sharing. Copayments are more deductible is met. Covered workers in these 17%, the average copayment is $246 per
common than coinsurance for each tier of plans are also more likely to pay coinsurance hospital admission, the average per diem
cost sharing. Among workers with three- or than workers in other plan types. charge is $246, and the average separate
four-tier plans, the average copayments in hospital deductible is $627. The cost-
these plans are $10 for first-tier drugs, $29 Most workers also face additional cost sharing provisions for outpatient surgery
for second-tier drugs, $49 for third-tier sharing for a hospital admission or an are similar to those for hospital admissions,
drugs, and $91 for fourth-tier drugs. These outpatient surgery episode. After any as most covered workers have either
amounts are not significantly higher than general annual deductible, 55% of covered coinsurance (57%) or copayments (18%).
the amounts reported last year. HDHP/SOs workers have coinsurance and 17% have For covered workers with cost sharing
have a somewhat different cost-sharing a copayment for hospital admissions.
EXHIBIT D
Distribution of the Percentage of Total Premium Paid by Covered Workers for Single and Family Coverage, by Firm Size, 2011
SINGLE COVERAGE
All Small Firms 35% 42% 19% 4%
(3–199 Workers)*
2%
All Large Firms
7% 68% 23%
(200 or More Workers)*
ALL FIRMS 16% 59% 22% 3%
FAMILY COVERAGE
All Small Firms 14% 28% 26% 32%
(3–199 Workers)*
2%
All Large Firms 56% 35% 7%
(200 or More Workers)*
ALL FIRMS 6% 47% 32% 15%
0% 10% 20% 30% 40% 50% 60% 70% 80% 90% 100%
0% Greater than 25%, less than or equal to 50%
Greater than 0%, less than or equal to 25% Greater than 50%
*Distributions for All Small Firms and All Large Firms within coverage types are statistically di erent (p<.05).
Source: Kaiser/HRET Survey of Employer-Sponsored Health Bene ts, 2011.
3
T H E K A I S E R FA M I LY F O U N D AT I O N AND H E A LT H R E S E A R C H & E D U C AT I O N A L T R U S T
4. Employer Health Bene ts 2 0 1 1 A N N U A L S U R V E Y
for each outpatient surgery episode, the AVAILABILIT Y OF EMPLOYER health benefits, 58% of workers are covered
2 011
average coinsurance is 17% and the average SPONSORED COVERAGE by health plans offered by their employer,
copayment is $145. Sixty percent of firms offer health benefits similar to the percentage in 2010.
Most plans limit the amount of cost to their workers in 2011 – a significant
reduction from the 69% reported in 2010, H I G H D E D U C T I B L E H E A LT H
S
sharing workers must pay each year,
generally referred to as an out-of-pocket but much more in line with the levels for PLANS WITH SAVINGS OPTION
maximum. Eighty-three percent of years prior to 2010 (Exhibit F). The large HDHP/SOs include (1) health plans with
covered workers have an out-of-pocket increase in 2010 was primarily driven by a a deductible of at least $1,000 for single
maximum for single coverage, but the significant (12 percentage points) increase coverage and $2,000 for family coverage
limits differ considerably. For example, in offering among firms with 3 to 9 workers offered with an Health Reimbursement
among covered workers in plans that (from 47% in 2009 to 59% in 2010). This Arrangement (HRA), referred to as
have an out-of-pocket maximum for year, 48% of firms with 3 to 9 employees “HDHP/HRAs,” and (2) high-deductible
single coverage, 38% are in plans with an offer health benefits, a level which is more health plans that meet the federal legal
F
annual out-of-pocket maximum of $3,000 consistent with levels from recent years requirements to permit an enrollee to
or more, and 14% are in plans with an (2010 excluded).4 These figures suggest that establish and contribute to a Health
out-of-pocket maximum of less than the 2010 results may be an aberration. Savings Account (HSA), referred to as
$1,500. Even in plans with a specified “HSA-qualified HDHPs.”
Even in firms that offer health benefits,
out-of-pocket limit, not all spending is not all workers are covered. Some workers Twenty-three percent of firms offering
counted towards meeting the limit. For are not eligible to enroll as a result of health benefits offer an HDHP/SO, up
example, among workers in PPOs with waiting periods or minimum work-hour from 15% in 2010. Firms with 1,000
an out-of-pocket maximum, 77% are in rules. Other workers do not enroll in or more workers are more likely to
plans that do not count physician office coverage offered to them because, for offer an HDHP/SO than smaller firms
visit copayments, 35% are in plans that do example, of the cost of coverage or because (3–199 workers) (41% vs. 23%). Seventeen
not count spending for the general annual they have access to coverage through a percent of covered workers are enrolled
deductible, and 84% are in plans that spouse. Among firms that offer coverage, in HDHP/SOs, up from 13% in 2010,
do not count prescription drug spending an average of 79% of workers are eligible and 8% in 2009. Eight percent of covered
when determining if an enrollee has for the health benefits offered by their workers are enrolled in HDHP/HRAs
reached the out-of-pocket limit. employer. Of those eligible, 81% take and 9% are enrolled in an HSA-qualified
up their employer’s coverage, resulting in HDHP. Twenty-three percent of covered
65% of workers in offering firms having workers in small firms (3–199 workers)
coverage through their employer. Among are enrolled in HDHP/SOs, compared
both firms that offer and do not offer to 15% of workers in large firms (200 or
more workers) (Exhibit G).
EXHIBIT E
Percentage of Covered Workers Enrolled in a Plan with a General Annual Deductible of $1,000 or More for Single Coverage,
by Firm Size, 2006–2011
50% 46%
50%
40%
40%
35%*
31%
30% 27%*
22%* 22%
21%*
20% 16% 18%* 17%
12%* 13%*
10% 9%
10%
8%
6%
0%
2006 2007 2008 2009 2010 2011
All Small Firms (3–199 Workers) All Large Firms (200 or More Workers) All Firms
*Estimate is statistically di erent from estimate for the previous year shown (p<.05).
Note: These estimates include workers enrolled in HDHP/SO and other plan types. Because we do not collect information on the attributes of conventional plans, to be conservative, we
assumed that workers in conventional plans do not have a deductible of $1,000 or more. Because of the low enrollment in conventional plans, the impact of this assumption is minimal.
Average general annual health plan deductibles for PPOs, POS plans, and HDHP/SOs are for in-network services.
Source: Kaiser/HRET Survey of Employer-Sponsored Health Bene ts, 2006–2011.
4
T H E K A I S E R FA M I LY F O U N D AT I O N AND H E A LT H R E S E A R C H & E D U C AT I O N A L T R U S T
5. Employer Health Bene ts 2 0 1 1 A N N U A L S U R V E Y
The distinguishing aspect of these high employer contributions to HSAs in these RETIREE COVERAGE
2 011
deductible plans is the savings feature contributing firms are $886 for single Twenty-six percent of large firms (200 or
available to employees. Workers enrolled coverage and $1,559 for family coverage. more workers) offer retiree health benefits
in an HDHP/HRA receive an average in 2011, which is the same percentage that
annual contribution from their employer The average premiums for single coverage
offered retiree health benefits in 2010. The
S
of $861 for single coverage and $1,539 for workers in HSA-qualified HDHPs and
HDHP/HRAs are lower than the average offer rate has fallen slowly over time, with
for family coverage (Exhibit H). The significantly fewer large employers offering
average HSA annual contribution is premiums for workers in plans that are
not HDHP/SOs (Exhibit H). For family retiree health benefits in 2011 than in
$611 for single coverage and $1,069 for 2007 and years prior.
family coverage. In contrast to HRAs, coverage, the average premium for HSA-
not all firms contribute to HSAs. Sixty qualified HDHPs is lower than the average Among large firms (200 or more workers)
percent of employers offering single family premium for workers in plans that that offer retiree health benefits, 91% offer
coverage and 57% offering family coverage are not HDHP/SOs. For single and family health benefits to early retirees (workers
coverage, the average worker contributions
F
through HSA-qualified HDHPs make retiring before age 65) and 71% offer
contributions towards the HSAs that to HSA-qualified HDHPs are also lower health benefits to Medicare-age retirees.
their workers establish. The average than the average worker contributions to
non-HDHP/SO plans.
EXHIBIT F
Percentage of Firms O ering Health Bene ts, by Firm Size, 1999–2011
FIRM SIZE 1999 2000 2001 2002 2003 2004 2005 2006 2007 2008 2009 2010 2011
3–9 Workers 55% 57% 58% 58% 55% 52% 47% 49% 45% 50% 47% 59%* 48%*
10–24 Workers 74 80 77 70* 76* 74 72 73 76 78 72 76 71
25–49 Workers 88 91 90 87 84 87 87 87 83 90* 87 92 85*
50–199 Workers 97 97 96 95 95 92 93 92 94 94 95 95 93
All Small Firms
65% 68% 67% 65% 65% 62% 59% 60% 59% 62% 59% 68%* 59%*
(3–199 Workers)
All Large Firms
99% 99% 99% 98%* 97% 98% 97% 98% 99% 99% 98% 99% 99%
(200 or More Workers)
ALL FIRMS 66% 68% 68% 66% 66% 63% 60% 61% 59% 63% 59% 69%* 60%*
*Estimate is statistically di erent from estimate for the previous year shown (p<.05).
Note: As noted in the Survey Design and Methods section, estimates presented in this exhibit are based on the sample of both rms that completed the entire survey and those that
answered just one question about whether they o er health bene ts. In 2011 changes were made to the survey’s rm weights decreasing estimates of the overall o er rate by 1% in
2000, 2007 and 2009. Please consult the Survey Design and Methods section for additional information on changes made to the 2011 survey.
Source: Kaiser/HRET Survey of Employer-Sponsored Health Bene ts, 1999–2011.
EXHIBIT G
Percentage of Covered Workers Enrolled in an HDHP/HRA or HSA-Quali ed HDHP, by Firm Size, 2011
40%
30%
23%
20% 17%
15%
13%
10% 9%
10% 7% 8% 8%
0%
HDHP/HRA HSA-Quali ed HDHP* HDHP/SO*
All Small Firms (3–199 Workers)
*Estimates are statistically di erent between All Small Firms and All Large Firms within category (p<.05). All Large Firms (200 or More Workers)
Source: Kaiser/HRET Survey of Employer-Sponsored Health Bene ts, 2011. All Firms
5
T H E K A I S E R FA M I LY F O U N D AT I O N AND H E A LT H R E S E A R C H & E D U C AT I O N A L T R U S T
6. Employer Health Bene ts 2 0 1 1 A N N U A L S U R V E Y
H E A LT H R E F O R M The percentage of covered workers in as preventive because of health reform.
2 011
While many of the most significant grandfathered plans is higher in small Twenty-three percent of covered workers
provisions of the Patient Protection and firms (3–199 workers) than in larger firms are in a plan where the employer reported
Affordable Care Act (ACA) will take effect (63% vs. 53%). changing the cost-sharing requirements
in 2014, important provisions became because of health reform (Exhibit I).
S
Firms with plans that were not Workers in large firms (200 or more
effective in 2010 and others will take effect grandfathered were asked to respond to a
over the next few years. The 2011 survey employees) are more likely than workers
list of potential reasons why each plan is in smaller firms to be in such a plan (28%
asked employers about some of these early not a grandfathered plan. Twenty-eight
provisions. vs. 13%). Thirty-one percent of covered
percent of covered workers are in plans workers are in a plan where the employer
Grandfathered Health Plans. The ACA that were not in effect when the ACA was reported changing the services that are
exempts “grandfathered” health plans from enacted. Roughly similar percentages of considered preventive services because of
a number of its provisions, such as the workers are in plans where the deductibles health reform.
(37%), employee premium contributions
F
requirements to cover preventive benefits
without cost sharing or to have an external (35%), or plan benefits (29%) changed Coverage for Adult Children to Age 26.
appeal process. An employer-sponsored more than was permitted for plans to The ACA requires firms offering health
health plan can be grandfathered if it maintain grandfathered status. The reasons coverage to extend benefits to children of
covered a worker when the ACA became plans were not grandfathered varied by covered workers until the child reaches age
law (March 23, 2010) and if the plan firm size, with workers in small firms 26. The child does not need to be a legal
does not make significant changes that (3–199 workers) much more likely than dependent, but until 2014, grandfathered
reduce benefits or increase employee costs.5 workers in large firms to be in a new plan plans do not have to enroll children of
Seventy-two percent of firms had at least that was not in effect when the ACA was employees if those children are offered
one grandfathered health plan when they enacted (63% vs. 18%) and generally less employer-sponsored health coverage at
were surveyed (January through May of likely to be affected by plan changes. their own job.6 The survey asked firms
2011). Small firms (3–199 workers) were whether any adult children who would
Preventive Benefits. The ACA requires
more likely than larger firms to have a not have been eligible for the plan prior
non-grandfathered plans to provide certain to the change in law had enrolled in health
grandfathered health plan (72% vs. 61%). preventive benefits without cost sharing.
Looking at enrollment, 56% of covered coverage under this provision. Nineteen
Firms were asked whether changes were percent of small firms (3–199 workers)
workers were in grandfathered health made to their cost sharing for preventive
plans when the survey was conducted. and 70% of larger firms enrolled at least
services or the services that were classified one adult child under this provision.
EXHIBIT H
Average Annual Premiums and Contributions to Savings Accounts for Covered Workers in HDHP/HRAs
or HSA-Quali ed HDHPs, Compared to All Non-HDHP/SO Plans, 2011
HDHP/HRA HSA-Quali ed HDHP Non-HDHP/SO Plans§
Single Family Single Family Single Family
Total Annual Premium $5,227* $14,909 $4,427* $12,655* $5,565 $15,363
Worker Contribution to Premium $881 $4,253 $589* $3,076* $964 $4,234
Firm Contribution to Premium $4,347 $10,657 $3,837* $9,579* $4,601 $11,129
Annual Firm Contribution to the HRA or HSA‡ $861 $1,539 $611 $1,069 NA NA
Total Annual Firm Contribution (Firm Share of
Premium Plus Firm Contribution to HRA or HSA) $5,208* $12,196* $4,449 $10,649 $4,601 $11,129
Total Annual Cost (Total Premium Plus Firm
Contribution to HRA or HSA, if Applicable) $6,088* $16,449* $5,038* $13,724* $5,565 $15,363
*Estimate is statistically di erent from estimate for All Non-HDHP/SO Plans (p<.05).
‡
When those rms that do not contribute to the HSA (40% for single and 43% for family coverage) are excluded from the calculation, the average rm contribution to the HSA for covered
workers is $886 for single coverage and $1,559 for family coverage. For HDHP/HRAs, we refer to the amount that the employer commits to make available to an HRA as a contribution for
ease of discussion. HRAs are notional accounts, and employers are not required to actually transfer funds until an employee incurs expenses. Thus, employers may not expend the entire
amount that they commit to make available to their employees through an HRA. Therefore, the employer contribution amounts to HRAs that we capture in the survey may exceed the
amount that employers will actually spend.
§
In order to compare costs for HDHP/SOs to all other plans that are not HDHP/SOs, we created composite variables excluding HDHP/SO data.
NA: Not Applicable.
Note: Values shown in the table may not equal the sum of their component parts. The averages presented in the table are aggregated at the rm level and then averaged,
which is methodologically more appropriate than adding the averages. This is relevant for Total Annual Premium, Total Annual Firm Contribution, and Total Annual Cost.
Source: Kaiser/HRET Survey of Employer-Sponsored Health Bene ts, 2011.
6
T H E K A I S E R FA M I LY F O U N D AT I O N AND H E A LT H R E S E A R C H & E D U C AT I O N A L T R U S T
7. Employer Health Bene ts 2 0 1 1 A N N U A L S U R V E Y
The numbers of children who enroll under Among firms with fewer than 50 employees claims cost at which stoploss insurance
2 011
this provision are closely related to the that offer coverage, 29% said they have begins paying benefits is $78,321 for workers
number of workers in the firm. Smaller made an attempt to determine if the firm in small firms (3–199 workers) with self-
firms (3–24 workers) on average enroll two is eligible for the small employer tax credit. funded plans, and $208,280 for workers in
adult children due to the provision, while Of the firms which attempted to determine larger firms with self-funded plans.
S
the largest firms (5,000 or more workers) eligibility, 30% said that they intend to
High-Performance Networks. Some plans
enroll an average of 492 adult children. claim the credit for both 2010 and 2011,
In total, an estimated 2.3 million adult 21% said they do not intend to claim the offer tiered or high-performance networks,
children were enrolled in their parent’s credit for either year, 41% are not sure, and which group providers in the network based
employer sponsored health plan due to small percentages said they do not know if on quality, cost, and/or efficiency of the care
the Affordable Care Act. they will claim the credit or they intend to they deliver. Plans encourage patients to
claim it for only one of the two years. The visit higher performing providers either by
Small Employer Tax Credit. The ACA restricting networks to efficient providers,
vast majority of those saying they do not
provides a temporary tax credit for small or by having different copayments or
F
intend to claim the tax credit indicated they
employers that offer insurance, have fewer were not eligible to receive it. coinsurance for providers in different tiers
than 25 full-time equivalent employees, in the network. Twenty percent of firms
and have average annual wages of less than Firms with fewer than 50 workers that do offering coverage in 2011 include a high-
$50,000.7 The survey included several not offer health insurance were asked if they performance or tiered provider network in
questions for both offering and non-offering were aware of the small business tax credit. their health plan with the largest enrollment.
employers about their awareness of the tax One-half (50%) of these firms said they Small firms (3–199 workers) and larger
credit and whether they considered claiming it. were aware of the credit, and of those aware, firms are equally likely to offer a plan that
15% are considering offering coverage as a includes a high-performance or tiered
Because our survey gathers information on result of the credit. network.
the total number of full-time and part-time
employees in a firm, we cannot calculate the
OTHER TOPICS CONCLUSION
number of full-time equivalent employees
and therefore could not limit survey Stoploss Coverage. Many firms that have The 2011 survey saw an upturn in
responses only to firms within the size range self-funded health plans purchase insurance, premium growth, as the average premiums
eligible for the credit.8 To ensure that we often called “stoploss” coverage, to limit for family coverage increased 9% between
included employers that may have a number the amount they may have to pay in claims 2010 and 2011, significantly higher than
of part-time or temporary employees but either overall, or for any particular plan the 3% increase between 2009 and 2010.
could still qualify for the tax credit, we enrollee. Fifty-eight percent of workers in The percentage of workers in HDHP/SOs
directed these questions to employers self-funded health plans are enrolled in plans continues to rise as employers seek more
with fewer than 50 total employees. This covered by stoploss insurance. Workers in affordable coverage options and are
approach allowed us to capture some self-funded plans in small firms (3–199 potentially seeking to shift increased costs to
employers with more than 25 employees workers) are more likely than workers in workers. In 2011, 17% of covered workers
who would nonetheless be eligible for self-funded plans in larger firms to be in were enrolled in an HDHP/SO, compared
the tax credit, but this also means some a plan with stoploss protection (72% vs. to 13% in 2010 and 8% in 2009.
employers who are unlikely to be eligible for 57%). About four in five (81%) workers
in self-funded plans that have stoploss Changes from the new health reform law
the tax credit (because they have more than
protection are in plans where the stoploss are beginning to have an impact on the
25 full-time equivalent employees) were
insurance limits the amount the plan spends marketplace. Significant percentages of firms
asked these questions.
on each employee. The average per employee made changes in their preventive care benefits
EXHIBIT I
Among Covered Workers, Changes to Cost Sharing for Preventive Services Because of the A ordable Care Act (ACA),
by Firm Size, 2011
Percentage of Workers in a Plan Percentage of Workers in a Plan
Where Cost Sharing Changed Where the Services Considered
for Preventive Services Preventive Changed
Because of the ACA Because of the ACA
FIRM SIZE
All Small Firms (3–199 Workers) 13%* 25%*
All Large Firms (200 or More Workers) 28%* 34%*
ALL FIRMS 23% 31%
*Estimate is statistically di erent between All Small Firms and All Large Firms (p<.05).
Source: Kaiser/HRET Survey of Employer-Sponsored Health Bene ts, 2011.
7
T H E K A I S E R FA M I LY F O U N D AT I O N AND H E A LT H R E S E A R C H & E D U C AT I O N A L T R U S T
8. Employer Health Bene ts 2 0 1 1 A N N U A L S U R V E Y
and enrolled adult children in their benefits plans in response to was, “Does your company offer a health insurance program as a
2 011
provisions in the new health reform law. Most employees with benefit to any of your employees?” A total of 3,184 firms responded
employment-sponsored insurance are in grandfathered plans that are to this question (including 2,088 who responded to the full survey
exempt from some of the law’s new provisions, but this may change and 1,096 who responded to this one question). Their responses are
over time as firms adjust benefits and cost sharing or change plan included in our estimates of the percentage of firms offering health
S
design to incorporate new features. The survey will continue to coverage. The response rate for this question was 71%. Since firms
monitor employer responses to health reform as firms adapt to early are selected randomly, it is possible to extrapolate from the sample to
provisions in the law and as new provisions take effect. national, regional, industry, and firm size estimates using statistical
weights. In calculating weights, we first determined the basic weight,
METHODOLOGY then applied a nonresponse adjustment, and finally applied a post-
stratification adjustment. We used the U.S. Census Bureau’s Statistics
The Kaiser Family Foundation/Health Research & Educational
of U.S. Businesses as the basis for the stratification and the post-
Trust 2011 Annual Employer Health Benefits Survey (Kaiser/HRET)
stratification adjustment for firms in the private sector, and we used
reports findings from a telephone survey of 2,088 randomly
F
the Census of Governments as the basis for post-stratification for
selected public and private employers with three or more workers.
firms in the public sector. This year, we modified the method used
Researchers at the Health Research & Educational Trust, NORC
to calculate firm-based weights resulting in small changes to some
at the University of Chicago, and the Kaiser Family Foundation
current and past results. For more information on the change consult
designed and analyzed the survey. National Research, LLC
the Survey Design and Methods section of the 2011 report. Some
conducted the fieldwork between January and May 2011. In 2011
exhibits in the report do not sum up to totals due to rounding effects
our overall response rate is 47%, which includes firms that offer
and, in a few cases, numbers from distribution exhibits referenced
and do not offer health benefits. Among firms that offer health
in the text may not add due to rounding effects. Unless otherwise
benefits, the survey’s response rate is 47%.
noted, differences referred to in the text use the 0.05 confidence level
From previous years’ experience, we learned that firms that decline as the threshold for significance.
to participate in the study are less likely to offer health coverage.
For more information on the survey methodology, please visit the Survey Design
Therefore, we asked one question to all firms with which we made and Methods section at http://ehbs.k .org/?page=charts&id=2&sn=15&p=1.
phone contact, but the firm declined to participate. The question The 2011 Employer Health Bene t Survey is available at http://ehbs.k .org/.
__________________________________________________________________________________________________________________________________________________________________________________________________
1
Kaiser Family Foundation, Kaiser Commission on Medicaid and the Uninsured, The Uninsured: A Primer, December 2010. www.k .org/uninsured/upload/7451-06.pdf. 57% of the non-elderly
American population receives insurance coverage through an employer-sponsored plan.
2
The average annual premiums for employer-sponsored health insurance in 2010 were $5,049 for single coverage and $13,770 for family coverage. Kaiser/HRET Survey of Employer-Sponsored
Health Bene ts, 2010.
3
The average worker contribution includes those workers with no contribution.
4
In 2011 changes were made to the survey’s rm weights decreasing estimates of the overall o er rate by 1% in 2000, 2007 and 2009. Please consult the Survey Design and Methods section for
additional information on changes made to the 2011 survey.
5
Federal Register, Vol. 75, No. 116, June 17, 2010. www.gpo.gov/fdsys/pkg/FR-2010-06-17/pdf/2010-14614.pdf. Federal Register, Vol. 7, No. 221, November 17, 2010. http://edocket.access.gpo.
gov/2010/pdf/2010-28861.pdf. For more information please consult: United States. Congressional Research Service CRS. Open CRS. By Bernadette Fernandez. Grandfathered Health Plans Under
the Patient Protection and A ordable Care Act (PPACA), 2 Jan. 2011. Web. 3 Aug. 2011. <http://assets.opencrs.com/rpts/R41166_20110103.pdf>.
6
Federal Register. Vol 75, No 92, May 13, 2010, www.gpo.gov/fdsys/pkg/FR-2010-05-13/pdf/2010-11391.pdf#page=15.
7
Internal Revenue Service, Notice 2010-82, Part III – Administrative, Procedural and Miscellaneous, Section 45R – Tax Credit for Employee Health Insurance Expenses of Small Employers,
www.irs.gov/pub/irs-drop/n-10-82.pdf.
8
In addition, because the number of full-time equivalent employees and average wages are determined over the entire year, rms during a year may not know if they will be eligible for the credit.
-AND-
The Henry J. Kaiser Family Foundation Health Research & Educational Trust
Headquarters 155 North Wacker
2400 Sand Hill Road Suite 400
Menlo Park, CA 94025 Chicago, IL 60606
Phone 650-854-9400 Fax 650-854-4800 Phone 312-422-2600 Fax 312-422-4568
Washington O ces and www.hret.org
Barbara Jordan Conference Center
1330 G Street, NW
Washington, DC 20005
Phone 202-347-5270 Fax 202-347-5274
www.k .org
The Kaiser Family Foundation, a leader in health policy analysis, health The Health Research & Educational Trust is a private, not-for-pro t organization
journalism and communication, is dedicated to lling the need for trusted, involved in research, education, and demonstration programs addressing health
independent information on the biggest health issues facing our nation management and policy issues. Founded in 1944, HRET, an a liate of the American
and its people. The Foundation is a non-pro t private operating foundation, Hospital Association, collaborates with health care, government, academic,
based in Menlo Park, California. business, and community organizations across the United States to conduct
research and disseminate ndings that help shape the future of health care.
The full report of survey ndings (#8225) is available on the Kaiser Family Foundation’s website at www.k .org.
This summary (#8226) is also available at www.k .org.
8
T H E K A I S E R FA M I LY F O U N D AT I O N AND H E A LT H R E S E A R C H & E D U C AT I O N A L T R U S T